

Abstract
We used the framework of the uncontrolled manifold (UCM) hypothesis and explored the reliability of several outcome variables across different spaces of analysis during a very simple four-finger accurate force production task. Fourteen healthy, young adults performed the accurate force production task with each hand on three days. Small spatial finger perturbations were generated by the “inverse piano” device three times per trial (lifting the fingers 1 cm/0.5 s and lowering them). The data were analyzed using the following main methods: 1) computation of indices of the structure of inter-trial variance and motor equivalence in the space of finger forces and finger modes, and 2) analysis of referent coordinates and apparent stiffness values for the hand. Maximal voluntary force and the index of enslaving (unintentional finger force production) showed good to excellent reliability. Strong synergies stabilizing total force were reflected in both structure of variance and motor equivalence indices. Variance within the UCM and the index of motor equivalent motion dropped over the trial duration and showed good to excellent reliability. Variance orthogonal to the UCM and the index of non-motor equivalent motion dropped over the three days and showed poor to moderate reliability. Referent coordinate and apparent stiffness indices co-varied strongly and both showed good reliability. In contrast, the computed index of force stabilization showed poor reliability. The findings are interpreted within the scheme of neural control with referent coordinates involving the hierarchy of two basic commands, the r-command and c-command. The data suggest natural drifts in the finger force space, particularly within the UCM. We interpret these drifts as reflections of a trade-off between stability and optimization of action. The implications of these findings for the UCM framework and future clinical applications are explored in the discussion. Indices of the structure of variance and motor equivalence show good reliability and can be recommended for applied studies.
Keywords: hand, synergy, variance, motor equivalence, referent coordinate, reliability
Introduction
Over the past years, several methods to estimate the stability of action for multi-element systems have been developed within the framework of the uncontrolled manifold (UCM) hypothesis (Scholz and Schöner 1999; reviewed in Latash et al. 2007). According to the UCM hypothesis, the neural controller organizes abundant sets of elemental variables (those produced by elements, e.g., fingers) to ensure the stability of task-specific salient variables (e.g., total force). The most commonly used method quantifies inter-trial variance within a space where a salient performance variable remains unchanged (the UCM for that variable, VUCM) and within an orthogonal space, where the performance variable does change (VORT). If VUCM > VORT, both quantified per dimension in the corresponding spaces, it is concluded that the performance variable is stabilized by the central nervous system (CNS).
This method has been applied in many studies exploring the stability of resultant variables produced by the hand, such as the resultant force and the resultant moment of force, based on covarying contributions from the digits (reviewed in Zatsiorsky and Latash 2008). In different studies, the analysis of inter-trial variance was performed either in the space of forces produced by individual digits or in the space of finger modes - hypothetical neural variables that can be manipulated individually by the CNS (Danion et al. 2003). The former method potentially can produce misleading results due to the phenomenon of enslaving, defined as unintentional finger force production when another finger of the hand produces force intentionally (Ohtsuki 1981; Zatsiorsky et al. 2000; Schieber and Santello 2004). A recent study of hand force variability and optimality compared the results of the analysis in the space of finger forces and modes and provided evidence for more robust results for the analysis in the finger mode space (Martin et al. 2013).
Another method, also based on the UCM hypothesis, has been introduced recently that quantifies displacements within the UCM and ORT spaces during quick actions or reactions (Scholz et al. 2007; Mattos et al. 2011). Larger displacements have been demonstrated in the less stable UCM space (motor equivalent, ME) compared to the more stable orthogonal to the UCM space (non-motor equivalent, nME) in multi-finger tasks (Mattos et al. 2015). Both inter-trial analysis of variance and ME analyses, which is performed within a trial with further averaging across multiple trials, assume a linear UCM or a UCM that can be linearized for small inter-trial deviations of elemental variables. Still, another method has been used in cases when linearity could not be assumed. This method is based on comparing inter-trial variability indices (e.g., the standard deviation) for a salient performance variable across actual trials and across surrogate data sets created by matching elemental variables from different trials and computing performance variable values (Kudo et al. 2000; Müller and Sternad 2003). If the standard deviation of a performance variable in the actual data set is lower than in the surrogate data set, a conclusion is drawn that there is co-variation of elemental variables in the original set that helps to bring down variability of that performance variable. Recently, this method has been applied to quantify the stability of hand force production in the space of control variables associated with referent coordinates for the agonist and antagonist muscle groups (Ambike et al. 2016; Reschechtko and Latash 2017). Changes in these hypothetical variables translate into changes in the referent coordinate (RC, changed by the so-called r-command) for the hand and its apparent stiffness (k, changed by the so-called c-command) (Feldman 1980, 1986, 2015). This method does not consider the action of several fingers but views the hand as a single effector controlled by two variables, RC and k.
A few recent studies compared different methods of analysis (Falaki et al. 2017; Furmanek et al. 2017). No study, however, has explored the reliability of different outcome variables across different spaces of analysis. This is an important issue, particularly given the recent series of studies using some of these approaches in neurological patients (reviewed in Latash and Huang 2015). We purposefully selected a very simple motor task – accurate constant four-finger force production – to minimize the effects of learning, and quantified indices of hand force stability both within a session and across three sessions, run on three different days. Based on the limited available information, we hypothesized that analysis in the space of finger modes would produce more reliable results compared to analysis in the finger force space (cf. Martin et al. 2013). Overall, we expected good reliability across all of the methods.
Methods
Participants
Fourteen healthy, self-reported right-handed adults (8 males and 6 females) 20–40 years old (29.5 ± 5.6 years; mean ± standard deviation), with an average body mass of 66.6 (±10.1) kg and body height of 1.71 (±0.09) m, participated in the study. All participants had neither history of neurological disease nor discomfort or injury in the upper extremities. Prior to participation in the study, all subjects gave written informed consent according to the protocol approved by the Penn State Hershey Institutional Review Board.
Apparatus
This experiment used an “inverse piano” device (Martin et al. 2011), which allows finger forces to be recorded while fingers are raised and lowered. The device uses four force sensors (Honeywell, Model 31, 25 LBS, Columbus, OH, USA) to measure finger downward pressing forces. The sensors were mounted on linear actuators (PS01-23×80; Linmot, Spruitenbach, Switzerland) placed within the slots of a steel frame (140 × 90 mm), 3-cm apart from each other in the medial-lateral direction. The actuators were controlled by a four-channel servo drive (Linmot E400-AT), which allowed each sensor to be raised and lowered along its vertical axis. The sensor position could be adjusted in the anterior-posterior direction to match individual finger anatomy. The top surface of each sensor was covered with sandpaper (100-grit) to increase friction. To avoid movement of the forearm during the tasks, a Velcro strap was placed slightly above the wrist joint to fix the forearm to a board. Figure 1 shows a schematic representation of the experimental setup.
Figure 1.

Experimental setup is shown in A, finger position on the force sensors in B, and the lateral view of the fingers, sensors, and linear actuators in C.
Subjects sat with their forearm in the sagittal plane, parallel to the ground, and placed each finger of the hand on a corresponding force sensor of the inverse piano device (Fig. 1A). A 19″ monitor approximately 0.6 m from the subject’s face provided visual feedback. Sensor positions were adjusted so that each finger was slightly curved when the fingertip was placed on the sensor and the hand formed a natural dome (Fig. 1B, 1C). A customized LabVIEW routine (2014 version, National Instruments, Austin, TX, USA) was used to present visual feedback, control the inverse piano, and acquire the force data. The force data were sampled at 200 Hz with a 16-bit resolution (NI PCI-6225, National Instruments) using a desktop computer and stored for offline data analyses.
Procedures
Participants were tested three times, on two consecutive days (Day-1 and Day-2) and a week from the first day (Day-3); two participants were tested a week from Day-2. The first experimental session lasted approximately 50 min and the other two sessions lasted 35–40 min.
Both hands were tested in a random order. For each hand, participants performed three tasks: the maximal voluntary contraction (MVC) task, the ramp task, and the accurate constant force production task. In the MVC task, participants were asked to press with the four fingertips as hard as they could to reach maximal force within 3–4 s until a command “relax” was given by the experimenter. The total force (FTOT – the sum of the forces applied by individual fingers) was displayed on the monitor. Two MVC trials were performed with a 30-s interval in-between. The trial with the highest FTOT value was used to set the target force levels for subsequent tasks. The finger forces recorded at the moment of maximal FTOT were used to define the target force level during the other tasks.
Immediately after the MVC task, participants performed the ramp task. In this task, subjects were requested to maintain all four fingers on the sensors and produce force with a specific finger (master finger) to match a force profile shown on a computer monitor. The target force profile started with a 4-s horizontal line set at 0 N, followed by an 8-s ramp line starting at 0% and ending at 40% of the master finger’s force measured in the MVC test, and finishing with a 4-s horizontal line set at the 40% level. Only the force produced by the master finger was displayed on the screen and participants were instructed to match the target line by pressing with the master finger. Subjects were instructed not to pay attention to possible force production by non-task (enslaved) fingers and they were told not to lift any of the fingers off the sensors at any time. In general, four trials (one for each master finger) were performed. On a few occasions, trials were repeated, mainly because subjects lifted one or more fingers during the ramp task execution. A single practice trial for each finger on Day-1 was sufficient for participants to perform the task properly.
During the accurate constant force production task, participants were asked to accurately produce constant force at a submaximal level by pressing naturally with all four fingers to match a red horizontal target line shown on the monitor. The target line was set at 20% of the subject’s maximum FTOT during the MVC test. The actual FTOT was shown on the monitor as a black, left-to-right running line. During each trial, the fingers were perturbed three times. In each perturbation episode, the four sensors were simultaneous lifted by 1 cm over 0.5 s (2 cm/s) and immediately lowered over the same distance and time. The perturbations were applied at the 6th, 12th, and 18th s from the beginning of the trial. These perturbation episodes will be referred to as IP1, IP2, and IP3, respectively. Participants were not informed on the timing of perturbations and were asked not to try to predict them; compliance with this instruction was checked using pilot analyses (not presented in the manuscript). Participants were also asked not to react to the perturbations (i.e., not to correct the force changes caused by the finger motion) and, as soon as a perturbation ended, to continue matching the target line. Two practice trials were enough for most participants to adequately perform the task and comply with the instructions. A few participants were given up to three extra practice trials on Day-1 based on their ability not to react to sensor motion.
The number of trials performed in each session depended on the participant’s ability to simultaneously match the prescribed force and not react to the perturbations. Such reactions could be seen easily by the experimenter as non-monotonic force profiles during the ascending phase of the perturbation. Thus, not less than 15 and not more than 20 trials were performed in this task by each hand for each experimental session. Each trial lasted 24 s and 15 s of rest was given between trials. After a set of five trials, a longer rest (≈ 1 min) was given to prevent fatigue. Participants also were encouraged to ask for extra rest as needed. Fatigue was never reported by any participant.
Data Analysis
Customized LabVIEW (2017 version) routines were used to process and analyze the data obtained in the ramp and accurate constant force production tasks. The force signals were filtered with a 4th-order, zero-lag Butterworth low-pass filter with a cutoff frequency of 5 Hz.
For the ramp task, the enslaving matrix E and an index reflecting unintentional force production by non-task fingers (index of enslaving, IEN) were calculated. For each trial, the first and last 1-s intervals of the 8-s ramp phase were removed to avoid possible edge effects. Linear regressions were computed between FTOT and the force produced by each individual finger. The regression coefficients (k) were used as entries in the 4 × 4 E:
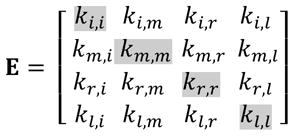 |
Here, the first subscript shows the finger producing force, whereas the second subscript shows the task finger. The main diagonal of E (highlighted in gray) represents the master fingers and the off-diagonal values represent the unintentional force production by the enslaved fingers. An index of enslaving, IEN (in % of the total force produce by all fingers), was computed as the average of the off-diagonal values of E multiplied by 100.
For the accurate constant force production task, we performed the following analyses: Computation of the four-finger force-sharing pattern (Li et al. 1998); the UCM-based analysis of variance (Latash et al. 2001); analysis of motor equivalence (ME) (Mattos et al. 2011, 2015); and {RC,k}-synergy analysis (Ambike et al. 2016). Each of these strategies is described in detail below. Figure 2A depicts the FTOT time-series produced by a representative participant during this task.
Figure 2.

A: The total force (FTOT) time-series for a representative participant (black line); the force target (20% of the MVC) is shown by the thin gray line. The dashed arrows indicate the onset time of each perturbation (IP) and the vertical light gray lines show the time intervals used to compute the UCM-based outcome variables (500-ms intervals prior to each IP). B: An example of the changes in total force and the sensor displacement during IP1 in a typical subject (dashed line). The black line shows the best linear fit between FTOT and finger displacement.
Force-Sharing Pattern
The four-finger force-sharing pattern analysis was performed to assess the contribution of each finger to FTOT during the accurate force production task. We calculated each finger’s percent contribution to FTOT for each time-sample within the three steady-state time intervals, starting 500 ms prior to each inverse piano perturbation (t = −500 ms) and ending with the initiation of the perturbation (t=0; illustrated with the light gray areas in Figure 2A). Further, the across-trial average values were computed for each hand, test session, and participant.
UCM-based analysis of variance
The inter-trial variance within the UCM (VUCM) space and within the space orthogonal to the UCM (VORT) was computed according to the framework of the UCM hypothesis (Scholz and Schöner 1999). According to this hypothesis, VUCM is the variance that does not affect the salient performance variable (FTOT in our study), whereas VORT is the variance component that does affect it. These variance components were computed for each time-sample using the null-space of the Jacobian matrix, J, as an approximation of the UCM. This was done in two spaces, the finger force space and the finger mode space as the elemental variables. Finger modes are hypothetical variables that can be manipulated by the neural controller one at a time (Danion et al 2003); modes were computed from the finger force data using the individual E matrix (details in Latash et al. 2001; Scholz et al. 2002). The finger modes were calculated as the product of the inverse of the enslaving matrix E by the forces recorded from each individual finger [mi=E−1fi].
Further, an index of synergy was calculated: ΔV = (VUCM/3 − VORT/1)/(VTOT/4), where VTOT is the total variance and each variance index is normalized by the dimensionality of the corresponding space (Scholz et al. 2002). Because ΔV is not normally distributed, it was log-transformed taking into account its computational boundaries using a modified Fisher z-transformation, resulting in ΔVZ = 0.5×ln((ΔV + 4)/(1.33 − ΔV)) (Park et al. 2010).
Values of VUCM, VORT, and ΔVZ were averaged within each of the three steady-state time intervals (−500 to 0, vertical light gray lines in Fig. 2A). Further, values of these variables were computed for each IP, for each of the three sessions, and for each participant.
The accuracy of matching the target FTOT was assessed as the root mean square error (RMSE) within the same time intervals (−500 to 0 ms) before each IP. The values of RMSE averaged across trials for each perturbation episode, hand, session, and participant were used for further statistical analysis.
Motor equivalence (ME) analysis
This analysis quantified the magnitude of motion in the finger force (or mode) space in-between time instants within a trial, separated from each other by a perturbation, within the UCM (motor equivalent, ME) and orthogonal to the UCM (non-motor equivalent, nME). For each trial, ME and nME motion was quantified between two instants of time: −0.5 s before a perturbation and 2 s after the end of the perturbation. This was done for each of the three perturbation episodes separately. These times were selected assuming relatively steady FTOT before the perturbation and 2 s after the end of the perturbation. For each measurement, the vectors of motion in the force space (ΔF) and in the mode space (ΔM) were projected onto the corresponding UCM and onto its orthogonal complement. The magnitude of these projections normalized by the square root of the space dimensionality was taken as ME and nME, respectively (for details see Mattos et al. 2015). Three values of ME and nME were obtained for each trial (one per IP). For each participant, the ME and the nME values then were averaged across trials for each session and used for further statistical analysis.
In addition, ME and nME were calculated from the instant before the first perturbation (IP1) to the instant of 2 s after the last perturbation (IP3), referred to as ME3-1 and nME3-1, respectively. This was done to explore the cumulative effect of the sequence of perturbations on the indices of motor equivalence. These values were compared with the ME and nME calculated for each IP using two indices: and . If ME and nME values for the consecutive IPs were independent, IME = 1 and InME = 1 would be expected on average. Values of IME and InME were computed for each trial and then averaged across trials for use in statistical analyses.
{RC, k}-synergy analysis
This analysis quantified stability of FTOT within the space of hypothetical control variables of the hand, RC (referent coordinate) and k (apparent stiffness) (Ambike et al. 2016; Reschechtko and Latash 2017). {RC; k} pairs for the whole hand were calculated for the ascending phase of each of the three IP perturbations (i.e., IP1, IP2, and IP3). During this phase, all four fingers were lifted by 1 cm. We excluded the first 50 and last 150 ms for each of the 500 ms ascending phases. This was done to remove data that did not include reflex-mediated changes in force and to minimize chances of the hand response being affected by voluntary corrections. An example of the force-coordinate time series and the corresponding regression line and equation used for the data analysis are presented in Fig. 2B.
For each IP episode, linear regression was run between the hand force and vertical coordinate (the black line in Fig. 2B). Only IP episodes with correlation coefficients ≥ 0.9 were accepted. Twelve of the 14 participants had at least 10 trials for each IP that met this criterion. The data from the two participants that did not achieve correlation coefficients ≥ 0.9 were excluded from this part of the analysis. For all accepted trials, the apparent stiffness (k) was estimated as the slope of the force-coordinate regression line and the referent coordinate (RC) of the hand was calculated as the X-axis intercept of the regression.
Since the UCM in the two-dimensional {RC, k} space corresponding to a fixed FTOT value was hyperbolic, we could not use variance analysis. Hence, we employed the method of surrogate data analysis (Muller and Sternad 2003). First, the mean and standard deviation of the actual FTOT values across trials for each IP and each subject were calculated (FACT and SDACT). Further, a random permutation of RC and k obtained across trials for each IP was used to generate surrogate {RC; k} pairs (RC was taken from one trial and k from another trial). During this procedure, 1000 {RC; k} pairs were formed per IP. These data were used to compute values of total force and its standard deviation (FSUR and SDSUR). Finally, an index was calculated: RSD=SDSUR/SDACT. RSD > 1 indicates that the actual {RC; k} pairs showed inter-trial co-variation that helped reduce inter-trial FTOT variability. Higher RSD values indicate higher stability of FTOT (Reschechtko and Latash, 2017).
Hyperbolic regressions were fitted to each participant’s {RC; k} data set for each IP and the coefficient of determinations (R2) was computed. For further statistical analysis, R2 values were Fisher z-transformed.
Statistical Analyses
Statistical analysis was run in the IBM SPSS statistics package (version 24). The normality of the data distribution was checked for all dependent variables with the Shapiro-Wilks test. Some variables that were not normally distributed, such as VUCM and VORT, were log transformed to achieve a normal distribution. Repeated measures (RM) two-way analyses of variance (ANOVA) were performed to test the effects of Day (three levels, Day-1, Day-2, and Day-3) and Hand (two levels, right and left) on MVC, IEN, IME, and InME. In addition, a three-way RM ANOVA was performed to test the effects of Day, Hand, and Perturbation (three levels, IP1, IP2, and IP3) on RMSE.
Additional RM ANOVAs were used to explore the effects of Day, Hand, and Perturbation on the force sharing pattern (percent contribution of each finger to FTOT), inter-trial variance analysis (VUCM, VORT, ΔVZ), motor equivalence analysis (ME and nME), and {RC, k}-synergies (RC, k, R2 and RSD). In case of sphericity violations, Greenhouse-Geisser correction was used. Post-hoc tests with Bonferroni corrections for pairwise comparisons were performed when needed. To assess reliability, intra-class correlation analyses (ICC2,1 for MVC, IEN, VUCM, VORT, ΔVZ, and RSD, and ICC2,3 for RMSE, finger shares, ME, nME, RC, and k) were performed for all dependent variables across Days and Perturbations. ICC values below 0.5 were considered as reflecting poor reliability, 0.5 ≤ ICC < 0.75 was considered to represent moderate reliability, 0.75 ≤ ICC < 0.9 was viewed as reflecting good reliability, and ICC ≥ 0.9 was considered as a sign of excellent reliability (Cicchetti 1994; Koo and Li 2016). We did not explore effects of gender because our study was not sufficiently powered for such an analysis.
In order to test the relations between the square root of VUCM and ME and between the square root of VORT and nME in both force and mode spaces, we carried out Spearman’s Rank Order Correlation tests. To test the relationship between ΔVZ (in force space) and RSD, Pearson Correlation Coefficient tests were performed. For all statistical analyses, α = 0.05.
Results
MVC, enslaving, and performance accuracy
There were no changes in the MVC values across the three testing days and no difference between the right and left hands as confirmed by the two-way ANOVA (Hand × Day). The intraclass correlation (ICC) analysis revealed that MVC had excellent reliability, with ICCs ≥ 0.9. The MVC and IEN values averaged across participants for the left and right hands on Day-1, Day-2, and Day-3, as well as their ICCs, are presented in Table 1. There were no differences in the enslaving index, IEN, between hands and across days for both hands, although the left hand data showed a trend toward higher IEN on Day-2 and Day-3 compared to Day-1 (Day × Hand interaction: F2,26=2.84; p=0.077; ηp2=0.18). The IEN index showed good reliability as indicated by the ICC analyses.
Table 1.
Characteristics of performance variables.
| Left Hand | Right Hand | |||||||
|---|---|---|---|---|---|---|---|---|
| Day 1 | Day 2 | Day 3 | ICC | Day 1 | Day 2 | Day 3 | ICC | |
|
|
|
|||||||
| MVC (N) | 84.54 (5.41) |
84.09 (5.97) |
85 (6.36) |
0.90 (0.78–0.96) |
86 (6.11) |
85.56 (6.26) |
86.25 (6.39) |
0.94 (0.85–0.98) |
| IEN (%) | 15.7 (1.54) |
20.9 (2.09) |
20.3 (2.27) |
0.78 (0.55–0.91) |
17.99 (1.65) |
19.61 (2.08) |
18.70 (2.25) |
0.76 (0.53–0.90) |
| RMSE (N) | ||||||||
| IP1 | 0.32 (0.03) |
0.24 (0.02) |
0.33 (0.04) |
0.46 (0–0.81) |
0.27 (0.03) |
0.30 (0.04) |
0.26 (0.03) |
0.64 (0.11–0.87 |
| IP2 | 0.29 (0.03) |
0.24 (0.02) |
0.34 (0.05) |
0.61 (0.04–0.86) |
0.24 (0.02) |
0.27 (0.03) |
0.23 (0.02) |
0.75 (0.38–0.91) |
| IP3 | 0.29 (0.03) |
0.26 (0.03) |
0.34 (0.05) |
0.44 (0–0.81) |
0.25 (0.02) |
0.26 (0.03) |
0.25 (0.02) |
0.8 (0.48–0.93) |
Mean values across subjects with standard errors in parentheses are presented. MVC, maximal voluntary contraction; N, newtons; IEN, index of enslaving; RMSE, root mean square error; IP1-IP3, three perturbations by the inverse piano; ICC, intraclass correlation and 95% confidence interval. ICC values in bold letters represent variables with good to excellent reliability.
The root mean square error of FTOT (RMSE) was small across hands, perturbations, and days. ANOVA showed no significant effects for these factors. The ICC analyses showed that RMSE had moderate to good reliability for the right hand and poor to moderate reliability for the left (Table 1).
Force Sharing
In general, the four-finger force-sharing pattern was stable across days and did not change within the sequence of perturbations. On average, the index, middle, ring, and little fingers of the right hand contributed 37.2% (±1.95, SE), 31.2% (±1.07), 19.8% (±1.29), and 11.8% (±1.17), respectively, of the FTOT during the accurate constant force production task. For the left hand, the corresponding values were 33.9% (±1.29), 32.1% (±1.07), 21.3% (±0.92), and 12.7% (±1.08). There were no main effects of Day or Perturbation on the finger contributions. The contribution of the index finger was slightly higher and that of the ring finger tended to be lower in the right hand when compared to the left hand (effect of Hand, index finger: F1,13=7.78, p<0.05, ηp2=0.37, ring finger: F1,13=4.27, p=0.06, ηp2=0.32). There were no interactions. In terms of reliability, the ICC analyses for each individual finger of the right hand showed excellent reliability (ICC > 0.88), whereas the reliability for the left hand was good (ICC values varied from 0.78–0.87; Table 2).
Table 2.
ICC values.
| Left Hand | Right Hand | ||||
|---|---|---|---|---|---|
|
|
|
||||
| Force Space | Mode Space | Force Space | Mode Space | ||
| S-Index | 0.75 (0.39–0.91) | 0.94 (0.84–0.98) | |||
| S-Middle | 0.86 (0.66–0.95) | 0.88 (0.70–0.96) | |||
| S-Ring | 0.86 (0.67–0.95) | 0.96 (0.90–0.99) | |||
| S-Little | 0.89 (0.72–0.96) | 0.91 (0.78–0.97) | |||
|
| |||||
| VUCM | IP1 | 0.68 (0.41–0.87) | 0.69 (0.41–0.88) | 0.47 (0.14–0.76) | 0.69 (0.42–0.88) |
| IP2 | 0.70 (0.42–0.88) | 0.71 (0.44–0.88) | 0.52 (0.20–0.79) | 0.67 (0.38–0.86) | |
| IP3 | 0.46 (0.13–0.75) | 0.57 (0.26–0.82) | 0.41 (0.08–0.72) | 0.56 (0.24–0.81) | |
|
|
|
||||
| VORT | IP1 | 0.47 (0.14–0.76) | 0.62 (0.32–0.84) | ||
| IP2 | 0.45 (0.12–0.75) | 0.66 (0.38–0.87) | |||
| IP3 | 0.25 (0.00–0.61) | 0.66 (0.37–0.86) | |||
|
|
|
||||
| ΔVZ | IP1 | 0.41 (0.07–0.72) | 0.46 (0.13–0.76) | 0.44 (0.11–0.74) | 0.60 (0.29–0.83) |
| IP2 | 0.54 (0.23–0.80) | 0.60 (0.29–0.83) | 0.22 (0.00–0.59) | 0.38 (0.05–0.70) | |
| IP3 | 0.25 (0.00–0.61) | 0.33 (0.01–0.67) | 0.60 (0.29–0.83) | 0.69 (0.41–0.95) | |
|
| |||||
| ME | IP1 | 0.80 (0.50–0.93) | 0.89 (0.74–0.96) | 0.83 (0.58–0.94) | 0.92 (0.79–0.97) |
| IP2 | 0.84 (0.60–0.94) | 0.85 (0.64–0.95) | 0.85 (0.62–0.95) | 0.90 (0.75–0.96) | |
| IP3 | 0.90 (0.75–0.97) | 0.89 (0.73–0.96) | 0.93 (0.83–0.98) | 0.95 (0.88–0.98) | |
|
|
|
||||
| nME | IP1 | 0.42 (0.00–0.80) | 0.69 (0.24–0.89) | ||
| IP2 | 0.54 (0.00–0.84) | 0.70 (0.28–0.90) | |||
| IP3 | 0.45 (0.00–0.81) | 0.76 (0.40–0.91) | |||
|
|
|
||||
| IME | 0.63 (0.09–0.87) | 0.53 (0.00–0.84) | 0.17 (0.00–0.45) | 0.00 (0.00–0.62) | |
|
|
|
||||
| InME | 0.00 (0.00–0.51) | 0.00 (0.00–0.52) | 0.43 (0.00–0.80) | 0.40 (0.00–0.79) | |
|
| |||||
| RC | IP1 | 0.80 (0.47–0.94) | 0.90 (0.74–0.97) | ||
| IP2 | 0.85 (0.62–0.95) | 0.93 (0.83–0.98) | |||
| IP3 | 0.86 (0.65–0.96) | 0.91 (0.76–0.97) | |||
|
|
|
||||
| k | IP1 | 0.69 (0.25–0.90) | 0.89 (0.71–0.96) | ||
| IP2 | 0.71 (0.27–0.91) | 0.87 (0.65–0.96) | |||
| IP3 | 0.79 (0.46–0.93) | 0.86 (0.64–0.96) | |||
|
|
|
||||
| RSD | IP1 | 0.00 (0.00–0.00) | 0.33 (0.00–0.70) | ||
| IP2 | 0.65 (0.13–0.88) | 0.41 (0.06–0.75) | |||
| IP3 | 0.25 (0.00–0.61) | 0.12 (0.00–0.55) | |||
|
|
|
||||
| R2: {RC;k} | IP1 | 0.13 (0.00–0.55) | 0.53 (0.18–0.81) | ||
| IP2 | 0.00 (0.00–0.29) | 0.24 (0.00–0.64) | |||
| IP3 | 0.39 (0.04–0.74) | 0.05 (0.00–0.47) | |||
ICC, intraclass correlation values and 95% confidence intervals; S in the first four rows stands for the share of individual fingers; VUCM, variance within the UCM; VORT, variance orthogonal to the UCM; ΔVZ, z-transformed synergy index; ME, motor equivalent; nME, non-motor equivalent; IME, index of motor equivalence; InME, index of non-motor equivalence; RC, referent coordinate; k, apparent stiffness; RSD=SDSUR/SDACT; R2: {RC;k}, the coefficients of determination defined by the hyperbolic regression of the {RC;k} data; IP1-IP3, three perturbations delivered by the inverse piano. ICC values in bold letters represent variables with good to excellent reliability.
UCM-based analysis of variance
As described in Methods, analysis of inter-trial variance was run in the spaces of finger forces and finger modes. The main outcome variables reflected inter-trial variance within the UCM and orthogonal to the UCM per dimension, VUCM, and VORT. Figure 3 shows the components of variance in both force and mode space, whereas the synergy index (ΔVZ) values are presented in Table 3.
Figure 3.

Across-subject means and standard errors for VUCM and VORT, normalized per dimension (in both force and mode space), shown separately for the left and right hands, three days (Day-1 – white bars, Day-2 – gray bars, and Day-3 – black bars) and three perturbations (IP1, IP2, and IP3). Note that VORT is the same in the force and mode space.
Table 3.
Indices of the structure of variance and motor equivalence.
| Left Hand | Right Hand | ||||||
|---|---|---|---|---|---|---|---|
|
|
|
||||||
| Day 1 | Day 2 | Day 3 | Day 1 | Day 2 | Day 3 | ||
|
|
|
||||||
| Force Space | |||||||
| ΔVZ | IP1 | 2.19 (0.088) | 2.22 (0.130) | 2.11 (0.118) | 2.22 (0.098) | 2.31 (0.108) | 2.28 (0.088) |
| IP2 | 2.01 (0.108) | 2.14 (0.121) | 2.09 (0.088) | 2.35 (0.115) | 2.29 (0.079) | 2.29 (0.071) | |
| IP3 | 2.02 (0.114) | 2.09 (0.124) | 1.96 (0.099) | 2.24 (0.091) | 2.24 (0.090) | 2.17 (0.094) | |
|
| |||||||
| IME | 0.93 (0.046) | 1.10 (0.049) | 1.09 (0.043) | 1.02 (0.043) | 1.06 (0.066) | 1.07 (0.038) | |
|
| |||||||
| InME | 0.59 (0.048) | 0.54 (0.029) | 0.59 (0.042) | 0.67 (0.036) | 0.62 (0.044) | 0.63 (0.040) | |
|
| |||||||
| Mode Space | |||||||
| ΔVZ | IP1 | 2.39 (0.088) | 2.59 (0.168) | 2.41 (0.140) | 2.47 (0.146) | 2.65 (0.152) | 2.52 (0.092) |
| IP2 | 2.23 (0.111) | 2.48 (0.148) | 2.39 (0.116) | 2.56 (0.120) | 2.57 (0.103) | 2.54 (0.093) | |
| IP3 | 2.26 (0.107) | 2.42 (0.144) | 2.27 (0.101) | 2.46 (0.103) | 2.51 (0.115) | 2.43 (0.100) | |
|
| |||||||
| IME | 0.92 (0.040) | 1.07 (0.042) | 1.06 (0.037) | 1.02 (0.043) | 1.03 (0.047) | 1.03 (0.030) | |
|
| |||||||
| InME | 0.59 (0.048) | 0.54 (0.030) | 0.59 (0.043) | 0.64 (0.036) | 0.62 (0.045) | 0.63 (0.036) | |
Mean values across subjects with standard errors in parentheses are presented. ΔVZ, z-transformed synergy index; IME, index of motor equivalence; InME, index of non-motor equivalence; IP1-IP3, three perturbations by the inverse piano.
There was a drop in VORT from Day-1 to Day-2 and Day-3 confirmed by the main effect of Day in the three-way ANOVA (Day × Hand × Perturbation; F2,26=4.26; p < 0.05; ηp2=0.25); note that VORT values in the finger force and mode spaces are identical. No effects of Day on VUCM and ΔVZ were seen. The synergy index ΔVZ was larger for the right than the left hand in both force (F1,13=14.86; p < 0.005; ηp2=0.53) and mode (F1,13=9.28; p < 0.01; ηp2=0.42) spaces. This was due to the tendency of VORT to be larger in the left hand in both force and mode spaces (F1,13=4.68; p = 0.05; ηp2=0.27). ICC analyses revealed that the reliability of VUCM, VORT, and ΔVZ ranged from poor to moderate for both hands, and in both force and mode spaces. The ICCs for all outcome variables are presented in Table 2 for each hand.
There were no differences in VORT and ΔVZ across the three perturbations. In contrast, VUCM dropped from IP1 to IP2 and IP3 (effect of Perturbation, F2,26=22.8; p < 0.001; ηp2=0.64 in the force space and F2,26=25.68; p < 0.001; ηp2=0.66 in the mode space). This effect tended to be stronger in the left hand as reflected by the Perturbation × Hand interaction (F2,26=7.48; p < 0.005; ηp2=0.37 in the force space and F2,26=2.87; p = 0.075; ηp2=0.18 in the mode space).
ME analysis
Effects on ME were similar to those described for VUCM, whereas effects on nME were similar to those for VORT. These results are presented in Figure 4. In particular, nME showed a drop from Day-1 to Day-2 and Day-3 (effect of Day, F1.27,16.56=8.32; p < 0.01; ηp2=0.39); note that nME values in the force and mode spaces are identical. In addition, nME was higher in the left than in the right hand in both force and mode (F1,13=6.53; p < 0.05; ηp2=0.33) spaces.
Figure 4.

Across-subject means and standard errors for indices of motor equivalence, ME and nME, shown separately for the left and right hands (in both force and mode spaces), three days (Day-1 – white bars, Day-2 – gray bars, and Day-3 – black bars) and three perturbations (IP1, IP2, and IP3). Note the nME is the same in the force and mode space.
Both ME and nME over IP1 were greater than over IP2 and IP3. These effects were confirmed by the main effects of Perturbation on ME (F1.1,14.4=50.85; p < 0.001; ηp2=0.8 in the force space and F1.06,13.82=34.98; p < 0.001; ηp2=0.73 in the mode space) and on nME (F1.35,16.8=11.56; p < 0.001; ηp2=0.47).
Whereas ME showed good or excellent reliability for both hands in both spaces, the reliability of nME ranged from moderate to good for the right hand and from poor to moderate for the left hand. ICC values for ME and nME for each IP are shown in Table 2.
We also calculated indices for the cumulative effect of the three perturbations on ME and nME (IME and InME). These indices are presented in Table 2. The results showed that in both force and mode spaces, IME was not different from 1 across the two hands and three days. In contrast, InME was always smaller than 1 in both force and mode spaces (p<0.001). ANOVA revealed no difference between the hands for either IME or InME. There was a trend for IME to increase from Day-1 to Day-2 and Day-3 in both force (F2,26=3.72; p < 0.05; ηp2=0.22) and mode (F2,26=3.66; p. < 0.05; ηp2=0.22) spaces. Overall, these indices showed poor reliability (Table 2).
{RC, k}-synergy analysis
For most participants, RC and k values were aligned closely with a hyperbolic line corresponding to the prescribed FTOT value. The R2 values for the hyperbolic regressions ranged from 0.75–0.99 for the right hand and from 0.87–0.99 for the left hand. There were no differences between the hands and across days on the z-transformed R2 values. Figure 5 depicts scatter plots on the {RC, k} space from data of a representative participant in the IP1 for both right and left hands and for the three testing days.
Figure 5.

Values of the referent coordinate (RC) and apparent stiffness (k) for a representative subject computed for IP1 on Day-1 (white circles), Day-2 (gray circles), and Day-3 (black circles) separately, for the left and right hands. R2 values are the coefficients of determination for the hyperbolic regressions shown with the dashed black line, gray line, and solid black line for Days 1–3, respectively.
There was a gradual reduction in both RC and k from IP1 to IP3 (effect of Perturbation, F2,22=23.9; p < 0.001; ηp2=0.68 and F1.22,13.4=24.4; p < 0.001; ηp2=0.69, respectively; see Figure 6) and this reduction was steeper on Day-1 compared to Day-2 and Day-3 (Day × Perturbation interaction; F4,44=6.62; p < 0.001; ηp2=0.38 and F4,44=10.57; p < 0.001; ηp2=0.49, respectively). Overall, the reliability of RC and k ranged from good to excellent (Table 2).
Figure 6.

Across-subject means and standard errors for the referent coordinate (RC) and apparent stiffness (k) for the left and right hands, three days (Day-1 – white bars, Day-2 – gray bars, and Day-3 – black bars), and three perturbations (IP1, IP2, and IP3).
In addition, the strong co-variation between RC and k stabilizing FTOT was reflected in very high values of RSD (RSD ≫1, see Figure 6). RSD was larger on Day-1 compared to Day-2 and Day-3 (effect of Day, F1.2,13.2=5.73; p < 0.05; η2=0.34). There were no other effects. Overall, ICCs revealed that the reliability of RSD was poor (Table 2).
Correlations across indices
The similarity of statistical effects on VUCM vs. ME and on VORT vs. nME was confirmed by correlations analysis showing strong associations between these pairs of outcome variables. The top panels of Figure 7 depict the scatter plots, regression lines, and correlation coefficients for the data across subjects for each of the three days in the force space (Fig. 7A) and mode space (Fig. 7B). Overall, the correlations between and ME for both hands were significant and moderate in both force and mode spaces. Similarly, the results showed significant correlations between and nME (Fig. 7) that ranged from moderate to strong. There were no significant correlations between ΔVZ and RSD. Pearson’s correlation coefficients across hands and days were within the range of −0.15 <r10 <0.38.
Figure 7.

Scatter plots showing the relationship between and ME and and nME. These variables were averaged across the three perturbation episodes (IPs) and their relationships are shown for each day separately.
Discussion
Overall, our hypotheses and expectations have been falsified by the results. Despite the very simple motor task indicated by the low RMSE, we observed significant changes in many of the outcome variables both within a single trial and across the three testing days. Whereas significant changes across the three days were seen in outcome variables reflecting accuracy of performance (such as VORT and nME), changes during a trial were seen in outcome variables that by definition had no effect on performance (VUCM and ME) as well as in “hidden” control variables (RC and k). The former group of results is compatible with learning effects over the three days that occurred despite the aforementioned task simplicity. The latter group of results suggests subtle adaptive changes, which we interpret as consequences of a natural drift in control variables (cf. Latash 2016; Reschechtko et al. 2017). Further, we invoke the idea of a trade-off between stability and optimality (Park et al. 2010) to discuss these phenomena.
One of our predictions was that there would be higher reliability of indices in the space of finger modes compared to the force space (based on an earlier study, Martin et al. 2013). This prediction was not supported since the reliability of the outcome variables was similar in the two spaces. The magnitudes of VUCM, ΔVZ, and ME were higher in the mode space as expected, however, given the positive finger force co-variation that can be attributed to the phenomenon of enslaving (cf. Zatsiorsky et al. 2000).
The significant changes in some of the outcome variables over the three testing days naturally compromised their reliability. We also observed relatively poor reliability in outcome variables reflecting action stability (ΔVZ and RSD), however, that showed no significant changes over the three days. These observations suggest that magnitudes of these variables should be interpreted with caution and potentially important findings expressed in those variables should be reproduced across studies. In the following Discussion sections, we address important aspects of motor control such as neural control with referent coordinates, the hierarchy of the two basic commands (the r-command and c-command, Feldman 1980, 1986), the stability-optimality tradeoff, and the natural drifts in performance and “hidden” variables.
Control of hand action with referent coordinates
A physical approach to motor control has been developed for many years (reviewed in Latash 2016, 2017). In contrast to computational approaches, the physical approach views movements as consequences of natural laws that unite salient variables with the help of parameters without computations (operations with numbers and vectors) performed by the CNS. A particularly influential theory within the physical approach has been the equilibrium-point hypothesis (Feldman 1966, 1986) developed into the idea of control with referent coordinates (RCs) (Feldman 2015). RCs play the role of parameters in natural laws that link performance variables of different natures, kinetics, kinematics, and electromyographics.
This framework has been combined recently with the idea of synergies stabilizing salient variables (Latash 2010; Ambike et al. 2016). In particular, our computations of RC and k values from experimental data assumed that the force produced by an effector could be described as a linear function of the difference between the actual and referent configuration, F = k(AC-RC). When agonist and antagonist muscle groups show non-zero co-contraction, the overall effector (e.g., joint or fingertip) characteristic becomes closer to linear within the co-contraction range. This effect may be viewed as a consequence of the algebraic summation of symmetrical non-linear muscle characteristics. Close to linear joint characteristics were reported in several studies of natural human actions, but these studies did not explore muscle-level characteristics (Feldman 1980; Gottlieb and Latash 1989). On the other hand, animal studies typically reported strongly non-linear muscle characteristics without exploring joint-level characteristics with and without co-contraction (Matthews 1989; Feldman and Orlovsky 1972).
In isometric conditions, muscle co-contraction is a function of the c-command (one of the two basic commands within the equilibrium-point hypothesis, Feldman 1980), which reflects the spatial zone between the activation thresholds for agonist (λag) and antagonist (λant) muscle groups. We assumed that the linear approximation was adequate in our study for three reasons. First, modeling has demonstrated the necessity of extensor activity to ensure the fingers do not collapse during pressing (Li et al. 1999, 2001). Second, several studies provided experimental evidence for non-zero antagonist activation during steady-state isometric force production (Ghez and Gordon 1987; Corcos et al. 1990). Third, our observations of strong linear correlations between force and coordinate during the episodes of finger perturbation with the “inverse piano” (R2 > 0.9) supported a linear approximation.
The idea of two basic commands, r-command and c-command (Feldman 1980), has been introduced based on the fact that every joint is spanned by at least two muscles with opposing actions. The r-command effectively shifts RC for the joint, whereas the c-command reflects common spatial activation zones of muscles with antagonistic actions leading to changes in the joint apparent stiffness (Latash and Gottlieb 1991). During the accurate force-production task by the hand, the r- and c-commands define its referent coordinate and apparent stiffness, RC and k, an abundant set of two commands in the task characterized by a single constraint (the required force level). This abundance can be used to ensure stability of force magnitude as demonstrated in several earlier studies (Ambike et al. 2016; Reschechtko and Latash 2017), as well as in the current study (RSD ≫ 1). Contrary to our expectations, we observed consistent shifts in RC and k over the trial duration: k dropped and RC adjusted to keep total force constant as required by the task. A similar result was reported in a recent study exploring unintentional drifts in force in the absence of visual feedback (Reschechtko and Latash 2017). In that study, no total force drift was seen in control conditions with visual feedback, whereas both k and RC drifted similarly to our current observations.
A novel finding in our study is the higher ICC values for RC as compared to ICC computed for k. This result suggests that the two control variables may not be equivalent: RC changes based on certain factors (these may include a shift toward higher optimality and lower stability, as discussed in the next section) and k adjusts accordingly. This interpretation is consistent with Feldman’s interpretation (Feldman 2015) of the well-known phenomenon of a drop in muscle co-contraction after a quick movement (e.g., Gottlieb et al. 1989), which is not accompanied by a drift in the final joint position.
Stability and optimality of action
The problem of motor redundancy (Bernstein 1967) has been one of the central issues in motor control. Two approaches have dominated the field (reviewed in Latash and Zatsiorsky 2016). One of them follows directly the original Bernstein’s formulation that the main problem is in the elimination of redundant degrees-of-freedom (DOFs). It assumes that the CNS selects a unique solution for a given motor task by optimizing a cost function (reviewed in Seif-Naraghi and Winters 1990; Prilutsky and Zatsiorsky 2003). The alternative view assumes that no DOFs are ever eliminated, but they are all used to facilitate families of solutions stabilizing action with respect to salient performance variables (the principle of abundance, Gelfand and Latash 1998; Latash 2012). The two approaches seemed incompatible (a single solution vs. a family of solutions). It has been suggested recently, however, that the inherent conflict between stability and optimality can be resolved differently depending on the task (Park et al. 2010). Optimization may be used to define a preferred set of coordinates in the space of elemental variables, whereas inter-trial distributions of these variables about the preferred coordinates may be defined by ensuring task-specific stability.
For example, accurate four-finger force production is a typical example of a task performed in conditions of abundance (redundancy). This task may be characterized by a preferred sharing pattern of total force among the four fingers seen in averaged across-trials data (Li et al. 1998) and also by the structure of inter-trial variance (Latash et al. 2001; Scholz et al. 2002). The former characteristic may be viewed as defined by an optimization principle, whereas the second one reflects stability of a salient performance variable. Note that the explicit task formulation and feedback may not define unambiguously what variable would be stabilized. These previous studies showed preferred stabilization of the total moment of force produced by the fingers, not total force, although the task emphasized accurate total force production and the visual feedback was organized accordingly (Latash et. al. 2001; Scholz et al. 2002).
We analyzed stability of total force production using two levels of analysis, three spaces of elemental variables, and three sets of indices. The two levels of analysis considered total hand force as either the sum of forces produced by the four parallel effectors (fingers) or as an output of a single effector controlled by two variables, RC and k. In addition to these two spaces of elemental variables, we also analyzed stability of the four-finger action in the space of finger modes defined as hypothetical control variables that can be manipulated by the CNS one at a time (Latash et al. 2001; Danion et al. 2003). In addition to the {RC; k} set, we used two sets of indices at the four-finger level of analysis, structure of inter-trial variance (VUCM, VORT, and ΔV) and motor equivalence (ME and nME).
Whereas these indices may be viewed as providing redundant information because they reflect stability of the same single performance variable, total force, our results show that at least some of the outcome variables may be viewed as complementary rather than redundant. In particular, we observed no significant correlations between the index of synergy at the {RC; k} level (RSD) and the index computed based on inter-trial analysis of the structure of variance (ΔVZ). This was unexpected given that a recent study reported significant correlations between these two indices (Reschechtko and Latash 2017). The difference between the studies could be in the range of values for the two indices. In the earlier study, the range was very large reflecting loss of force stability without visual feedback (see also Parsa et al. 2016), whereas in our current study total force always was stabilized strongly and, as a result, the range of both RSD and ΔVZ was small. Note also that the outcome variables from the analysis of variance (VUCM and VORT) and motor equivalence (ME and nME) are expected to correlate based on statistical considerations (Falaki et al. 2017); however, their behavior may be statistically different with changes in external conditions (Mattos et al. 2010), possibly reflecting subtle deviations of the data from a normal distribution. Taken together, the results suggest that the explored sets of outcome variables may or may not provide useful complementary information depending on the range of stability variations in the study and the range of changes in external conditions.
Our observations suggest that subjects start with relatively high stability of total force (high VUCM and ΔVZ values) and then, given the predictable task and relatively minor perturbations, converge on more stereotypical solutions (similar results were reported by Reschechtko and Latash 2017). In other words, by the end of the trial, subjects became more optimal in terms of higher consistency of their sharing patterns. Note that high VUCM violates optimality in the finger force space because it means larger deviations from any particular sharing pattern (assuming that such an optimal sharing patterns exists; cf. Prilutsky and Zatsiorsky 2002). We purposefully limit our analysis here to optimality with respect to a cost function reflecting measured performance variables such as finger forces; in a more general case, optimality based on intrinsic physiological variables may not be reflected in consistent sharing patterns. Since large VUCM values signify high stability, a drop in VUCM suggests convergence on a specific (optimal) pattern of finger force sharing at the expense of stability of the multi-finger action. These results are unexpected given the relatively short trials and very simple task.
Another index of force stability, RSD, which is based on the idea of control with referent coordinates, dropped significantly over the three testing sessions. This result confirms the convergence of solutions in a different abundant space, {RC; k}. In conjunction with the results above, it also illustrates the trend towards more optimal but less stable solutions seen at a different level of analysis that views the hand as a single effector, in contrast to the VUCM and ΔV indices that were computed for the hand as a combination of four effectors (fingers).
In contrast to the current observations, practicing in conditions that challenge stability leads to higher VUCM, which is observed in parallel to a drop in VORT (Wu et al. 2012; Wu and Latash 2014). These results carry a potentially important message for motor rehabilitation. Depending on the patient’s state and goals, different training routines may be recommended such that more stereotypical tasks would be advised if optimality of action is a major goal and variable tasks challenging stability would be favored if stability of action needs to be improved.
We would like to comment on the observed trend toward higher enslaving (IEN) over the three testing days, which was stronger in the left hand (Table 1). This trend is similar to findings of higher enslaving following different practice routines (Kang et al. 2004; Olafsdottir et al. 2008; Wu et al. 2012, 2013) and even within a single trial (Reschechtko et al. 2014). Enslaving may be viewed as both a negative characteristic (low finger independence) and as a positive characteristic potentially contributing to stabilization of the rotational hand action (Zatsiorsky et al. 2000). Such quick changes in enslaving are a strong argument for its neural origin (cf. Schieber and Santello 2004). These quick changes suggest caution is using enslaving matrices obtained at the beginning of an experimental session for analysis of data recorded later in the session.
Lessons for applied studies
A number of studies have documented consistent changes in indices of performance-stabilizing synergies across various conditions with impaired motor function, from normal fatigue (Singh et al. 2010) and healthy aging (Shim et al. 2004) to peripheral disorders such as osteoarthritis (Tokuda et al. 2017; Tawy et al. 2018), and to neurological disorders such as Parkinson’s disease, multi-system brain atrophy, and multiple sclerosis (reviewed in Latash and Huang 2015). In contrast, studies of stroke survivors produced ambiguous results. Some studies reported no difference in the UCM-based indices of synergies between the ipsilesional and contralesional limbs and between the patients and age-matched controls (Reisman and Scholz 2003; Jo et al. 2016). Other studies, however, reported weaker performance-stabilizing synergies in patients after cortical stroke (Gera et al. 2016a,b; Kang and Cauraugh 2017). A recent study (Falaki et al. 2017) has shown similar effects of Parkinson’s disease and dopamine-replacement drugs on indices as inter-trial variance (VUCM and VORT) and motor equivalence (ME and nME). This is a predicted result for a set of observations with a perfectly normal distribution: sampling at random data points and computing variance and distance between pairs of points are expected to lead to correlated outcomes (see properties of folded distributions, Leone et al. 1961). Our study confirms this prediction by showing significant correlations between VUCM and ME and between VORT and nME (Figure 7).
Are there better (more reliable) and worse (less reliable) outcome variables? Table 3 suggests that indices of ME show, on average, better reliability compared to indices of inter-trial variance. Given the correlation between the sets of outcome variables, ME indices have an advantage and may be recommended for applied studies of synergic control. With respect to analysis of synergies in the space of hypothetical control variables, both RC and k showed very good reliability. The recently suggested metric RSD (Reschechtko and Latash 2017), however, shows poor reliability and, as of now, cannot be recommended for applied studies.
Our analysis of the indices of total force stability in the spaces of finger forces and finger modes has not shown an advantage of one method over the other. Whereas an earlier paper presented data in favor of analysis in the space of finger modes (Martin et al. 2013), our current analysis does not confirm those conclusions. Analysis in the space of modes has been a preferred method because the CNS can change finger modes one at a time, at least theoretically, whereas finger forces are coupled via the phenomenon of enslaving (Kilbreath and Gandevia 1994; Zatsiorsky et al. 2000; Schieber and Santello 2004). On the other hand, enslaving characteristics show changes over short intervals of practice and even over a trial duration (Kang et al. 2004; Olafsdottir et al. 2008; Wu et al. 2012, 2013; Reschechtko et al. 2014). These findings potentially require performing analysis of enslaving repetitively over the course of a testing session, which may be cumbersome for clinical studies. In addition, analysis in the mode space has been possible only in tasks with unidirectional force production (such as pressing) in isometric conditions. Changing finger configuration may lead to changes in properties of enslaving. For example, if more natural tasks are considered, each digit produces six components of the force/moment vector, and characterizing enslaving across all the components may be prohibitively complex and time-consuming. So far, only one study characterized enslaving across the three components of the force vector (Kapur et al. 2010); no studies quantified enslaving across the force/moment components comprehensively.
Concluding comments
Our original goal was relatively modest: To quantify reliability of outcome variables across methods and spaces of analysis of the multi-finger hand action. This goal has been accomplished with some recommendations for specific methods and outcome measures. In addition, however, we observed unexpected adaptive changes in several characteristics of the hand action over the three testing sessions and even over the three small perturbation episodes within each trial. These adaptive changes suggest, in particular, that in predictable conditions of laboratory testing, subjects start each trial with relatively high stability indices. Over the trial duration, these indices drop, converging on a smaller set of solutions, possibly defined by an optimality principle. Other indices of stability showed significant trends over days: subjects showed a tendency to converge on less variable sets to solve the very simple task.
Our study has several drawbacks that may be fixed in follow-up studies. One of them is the limited number of testing sessions (only three) and individual trial duration. Both were defined based on pragmatic reasons such as avoiding fatigue and subject attrition. Nevertheless, it is possible that analysis over longer trials and more sessions could reveal new important properties of the outcome variables.
Two subjects were not able to follow the instructions of not reacting to the perturbation. This could be a problem in clinical studies, in which patients may have difficulty in understanding and following this seemingly simple but unusual instruction. Our conclusions may be seen as limited to the specific set of effectors (fingers) and task. Future studies are needed to determine whether similar conclusions would be reached during analysis of kinematic variables (such as joint configurations), and muscle activations in reaching and whole-body tasks.
Acknowledgments
The study was in part supported by NIH grants NS082151 and NS095873.
References
- Ambike S, Mattos D, Zatsiorsky VM, Latash ML. Synergies in the space of control variables within the equilibrium-point hypothesis. Neurosci. 2016;315:150–161. doi: 10.1016/j.neuroscience.2015.12.012. [DOI] [PMC free article] [PubMed] [Google Scholar]
- Bernstein NA. The Co-ordination and Regulation of Movements. Pergamon Press; Oxford: 1967. [Google Scholar]
- Cicchetti DV. Guidelines, criteria, and rules of thumb for evaluating normed and standardized assessment instruments in psychology. Psychol Assess. 1994;6:284–290. [Google Scholar]
- Corcos DM, Agarwal GC, Flaherty BP, Gottlieb GL. Organizing principles for single-joint movements: IV. Implications for isometric contractions. J Neurophysiol. 1990;64:1033–1042. doi: 10.1152/jn.1990.64.3.1033. [DOI] [PubMed] [Google Scholar]
- Danion F, Schöner G, Latash ML, Li S, Scholz JP, Zatsiorsky VM. A force mode hypothesis for finger interaction during multi-finger force production tasks. Biol Cybern. 2003;88:91–98. doi: 10.1007/s00422-002-0336-z. [DOI] [PubMed] [Google Scholar]
- Falaki A, Huang X, Lewis MM, Latash ML. Motor equivalence and structure of variance: Multi-muscle postural synergies in Parkinson’s disease. Exp Brain Res. 2017;235:2243–2258. doi: 10.1007/s00221-017-4971-y. [DOI] [PMC free article] [PubMed] [Google Scholar]
- Feldman AG. Superposition of motor programs. I. Rhythmic forearm movements in man. Neurosci. 1980;5:81–90. doi: 10.1016/0306-4522(80)90073-1. [DOI] [PubMed] [Google Scholar]
- Feldman AG. Once more on the equilibrium-point hypothesis (γ-model) for motor control. J Mot Behav. 1986;18:17–54. doi: 10.1080/00222895.1986.10735369. [DOI] [PubMed] [Google Scholar]
- Feldman AG. Referent control of action and perception: Challenging conventional theories in behavioral science. Springer; NY: 2015. [Google Scholar]
- Feldman AG, Orlovsky GN. The influence of different descending systems on the tonic stretch reflex in the cat. Exp Neurol. 1972;37:481–494. doi: 10.1016/0014-4886(72)90091-x. [DOI] [PubMed] [Google Scholar]
- Furmanek M, Solnik S, Piscitelli D, Rasouli O, Falaki A, Latash ML. Synergies and motor equivalence in voluntary sway tasks: The effects of visual and mechanical constraints. J Mot Behav. 2017 doi: 10.1080/00222895.2017.1367642. in press. [DOI] [PMC free article] [PubMed] [Google Scholar]
- Gelfand IM, Latash ML. On the problem of adequate language in movement science. Motor Control. 1998;2:306–313. doi: 10.1123/mcj.2.4.306. [DOI] [PubMed] [Google Scholar]
- Gera G, Freitas SM, Scholz JP. Relationship of diminished interjoint coordination after stroke to hand path consistency. Exp Brain Res. 2016a;234:741–751. doi: 10.1007/s00221-015-4500-9. [DOI] [PubMed] [Google Scholar]
- Gera G, McGlade KE, Reisman DS, Scholz JP. Trunk muscle coordination during upward and downward reaching in stroke survivors. Motor Control. 2016b;20:50–69. doi: 10.1123/mc.2014-0038. [DOI] [PubMed] [Google Scholar]
- Ghez C, Gordon J. Trajectory control in targeted force impulses. Exp Brain Res. 1987;67:225–240. doi: 10.1007/BF00248545. [DOI] [PubMed] [Google Scholar]
- Gottlieb GL, Corcos DM, Agarwal GC. Strategies for the control of voluntary movements with one mechanical degree of freedom. Behav Brain Sci. 1989;12:189–250. [Google Scholar]
- Jo HJ, Maenza C, Good DC, Huang X, Park J, Sainburg RL, Latash ML. Effects of unilateral stroke on multi-finger synergies and their feed-forward adjustments. Neurosci. 2016;319:194–205. doi: 10.1016/j.neuroscience.2016.01.054. [DOI] [PMC free article] [PubMed] [Google Scholar]
- Kang N, Cauraugh JH. Bilateral synergy as an index of force coordination in chronic stroke. Exp Brain Res. 2017;235:1501–1509. doi: 10.1007/s00221-017-4904-9. [DOI] [PubMed] [Google Scholar]
- Kang N, Shinohara M, Zatsiorsky VM, Latash ML. Learning multi-finger synergies: An uncontrolled manifold analysis. Exp Brain Res. 2004;157:336–350. doi: 10.1007/s00221-004-1850-0. [DOI] [PubMed] [Google Scholar]
- Kilbreath SL, Gandevia SC. Limited independent flexion of the thumb and fingers in human subjects. J Physiol. 1994;479:487–497. doi: 10.1113/jphysiol.1994.sp020312. [DOI] [PMC free article] [PubMed] [Google Scholar]
- Koo TK, Li MY. A guideline of selecting and reporting intraclass correlation coefficients for reliability research. J Chiropract Med. 2016;15:155–163. doi: 10.1016/j.jcm.2016.02.012. [DOI] [PMC free article] [PubMed] [Google Scholar]
- Kapur S, Friedman J, Zatsiorsky VM, Latash ML. Finger interaction in a three-dimensional pressing task. Exp Brain Res. 2010;203:101–118. doi: 10.1007/s00221-010-2213-7. [DOI] [PMC free article] [PubMed] [Google Scholar]
- Kudo K, Tsutsui S, Ishikura T, Ito T, Yamamoto Y. Compensatory coordination of release parameters in a throwing task. J Mot Behav. 2000;32:337–345. doi: 10.1080/00222890009601384. [DOI] [PubMed] [Google Scholar]
- Latash ML. Motor synergies and the equilibrium-point hypothesis. Motor Control. 2010a;14:294–322. doi: 10.1123/mcj.14.3.294. [DOI] [PMC free article] [PubMed] [Google Scholar]
- Latash ML. Stages in learning motor synergies: A view based on the equilibrium-point hypothesis. Hum Move Sci. 2010b;29:642–654. doi: 10.1016/j.humov.2009.11.002. [DOI] [PMC free article] [PubMed] [Google Scholar]
- Latash ML. The bliss (not the problem) of motor abundance (not redundancy) Exp Brain Res. 2012;217:1–5. doi: 10.1007/s00221-012-3000-4. [DOI] [PMC free article] [PubMed] [Google Scholar]
- Latash ML. Towards physics of neural processes and behavior. Neurosci Biobehav Rev. 2016;69:136–146. doi: 10.1016/j.neubiorev.2016.08.005. [DOI] [PMC free article] [PubMed] [Google Scholar]
- Latash ML. Biological movement and laws of physics. Motor Control. 2017;21:327–344. doi: 10.1123/mc.2016-0016. [DOI] [PubMed] [Google Scholar]
- Latash ML, Gottlieb GL. Reconstruction of elbow joint compliant characteristics during fast and slow voluntary movements. Neurosci. 1991;43:697–712. doi: 10.1016/0306-4522(91)90328-l. [DOI] [PubMed] [Google Scholar]
- Latash ML, Huang X. Neural control of movement stability: Lessons from studies of neurological patients. Neurosci. 2015;301:39–48. doi: 10.1016/j.neuroscience.2015.05.075. [DOI] [PMC free article] [PubMed] [Google Scholar]
- Latash ML, Scholz JF, Danion F, Schöner G. Structure of motor variability in marginally redundant multi-finger force production tasks. Exp Brain Res. 2001;141:153–165. doi: 10.1007/s002210100861. [DOI] [PubMed] [Google Scholar]
- Latash ML, Scholz JP, Schöner G. Toward a new theory of motor synergies. Motor Control. 2007;11:275–307. doi: 10.1123/mcj.11.3.276. [DOI] [PubMed] [Google Scholar]
- Latash ML, Zatsiorsky VM. Biomechanics and Motor Control: Defining Central Concepts. Academic Press; New York, NY: 2016. [Google Scholar]
- Leone FC, Nottingham RB, Nelson LS. The folded normal distribution. Technometrics. 1961;3:543–550. [Google Scholar]
- Li ZM, Latash ML, Zatsiorsky VM. Force sharing among fingers as a model of the redundancy problem. Exp Brain Res. 1998;119:276–286. doi: 10.1007/s002210050343. [DOI] [PubMed] [Google Scholar]
- Li ZM, Zatsiorsky VM, Latash ML. Contributions of the extrinsic and intrinsic hand muscles to the moments in finger joints. J Clin Biomech. 1999;15:203–211. doi: 10.1016/s0268-0033(99)00058-3. [DOI] [PubMed] [Google Scholar]
- Li ZM, Zatsiorsky VM, Latash ML. The effect of finger extensor mechanism on the flexor force during isometric tasks. J Biomech. 2001;34:1097–1102. doi: 10.1016/s0021-9290(01)00061-6. [DOI] [PubMed] [Google Scholar]
- Martin JR, Budgeon MK, Zatsiorsky VM, Latash ML. Stabilization of the total force in multi-finger pressing tasks studied with the ‘inverse piano’ technique. Hum Mov Sci. 2011;30:446–458. doi: 10.1016/j.humov.2010.08.021. [DOI] [PMC free article] [PubMed] [Google Scholar]
- Martin JR, Terekhov AA, Latash ML, Zatsiorsky VM. Optimization and variability of motor behavior in multi-finger tasks: What variables does the brain use? J Motor Behav. 2013;45:289–305. doi: 10.1080/00222895.2013.792234. [DOI] [PMC free article] [PubMed] [Google Scholar]
- Matthews PBC. The dependence of tension upon extension in the stretch reflex of the soleus of the decerebrate cat. J Physiol. 1959;47:521–546. doi: 10.1113/jphysiol.1959.sp006260. [DOI] [PMC free article] [PubMed] [Google Scholar]
- Mattos D, Latash ML, Park E, Kuhl J, Scholz JP. Unpredictable elbow joint perturbation during reaching results in multijoint motor equivalence. J Neurophysiol. 2011;106:1424–1436. doi: 10.1152/jn.00163.2011. [DOI] [PMC free article] [PubMed] [Google Scholar]
- Mattos D, Schöner G, Zatsiorsky VM, Latash ML. Motor equivalence during accurate multi-finger force production. Exp Brain Res. 2015;233:487–502. doi: 10.1007/s00221-014-4128-1. [DOI] [PMC free article] [PubMed] [Google Scholar]
- Müller H, Sternad D. A randomization method for the calculation of covariation in multiple nonlinear relations: illustrated with the example of goal-directed movements. Biol Cybern. 2003;89:22–33. doi: 10.1007/s00422-003-0399-5. [DOI] [PubMed] [Google Scholar]
- Ohtsuki T. Inhibition of individual fingers during grip strength exertion. Ergonomics. 1981;24:21–36. doi: 10.1080/00140138108924827. [DOI] [PubMed] [Google Scholar]
- Olafsdottir HB, Zatsiorsky VM, Latash ML. The effects of strength training on finger strength and hand dexterity in healthy elderly individuals. J Appl Physiol. 2008;105:1166–1178. doi: 10.1152/japplphysiol.00054.2008. [DOI] [PMC free article] [PubMed] [Google Scholar]
- Park J, Zatsiorsky VM, Latash ML. Optimality vs. variability: An example of multi-finger redundant tasks. Exp Brain Res. 2010;207:119–132. doi: 10.1007/s00221-010-2440-y. [DOI] [PMC free article] [PubMed] [Google Scholar]
- Parsa B, O’Shea DJ, Zatsiorsky VM, Latash ML. On the nature of unintentional action: A study of force/moment drifts during multi-finger tasks. J Neurophysiol. 2016;116:698–708. doi: 10.1152/jn.00180.2016. [DOI] [PMC free article] [PubMed] [Google Scholar]
- Prilutsky BI, Zatsiorsky VM. Optimization-based models of muscle coordination. Exer Sport Sci Rev. 2002;30:32–38. doi: 10.1097/00003677-200201000-00007. [DOI] [PMC free article] [PubMed] [Google Scholar]
- Reschechtko S, Latash ML. Stability of hand force production: I. Hand level control variables and multi-finger synergies. J Neurophysiol. 2017;118:3152–3164. doi: 10.1152/jn.00485.2017. [DOI] [PMC free article] [PubMed] [Google Scholar]
- Reisman D, Scholz JP. Aspects of joint coordination are preserved during pointing in persons with post-stroke hemiparesis. Brain. 2003;126:2510–2527. doi: 10.1093/brain/awg246. [DOI] [PubMed] [Google Scholar]
- Reschechtko S, Zatsiorsky VM, Latash ML. Stability of multi-finger action in different spaces. J Neurophysiol. 2014;112:3209–3218. doi: 10.1152/jn.00395.2014. [DOI] [PMC free article] [PubMed] [Google Scholar]
- Schieber MH, Santello M. Hand function: peripheral and central constraints on performance. J Appl Physiol. 2004;96:2293–2300. doi: 10.1152/japplphysiol.01063.2003. [DOI] [PubMed] [Google Scholar]
- Scholz JP, Danion F, Latash ML, Schöner G. Understanding finger coordination through analysis of the structure of force variability. Biol Cybern. 2002;86:29–39. doi: 10.1007/s004220100279. [DOI] [PubMed] [Google Scholar]
- Scholz JP, Schöner G, Hsu WL, Jeka JJ, Horak F, Martin V. Motor equivalent control of the center of mass in response to support surface perturbations. Exp Brain Res. 2007;180:163–179. doi: 10.1007/s00221-006-0848-1. [DOI] [PubMed] [Google Scholar]
- Scholz JP, Schöner G. The uncontrolled manifold concept: Identifying control variables for a functional task. Exp Brain Res. 1999;126:289–306. doi: 10.1007/s002210050738. [DOI] [PubMed] [Google Scholar]
- Seif-Naraghi AH, Winters JM. Optimized strategies for scaling goal-directed dynamic limb movements. In: Winters JM, Woo SL-Y, editors. Multiple Muscle Systems. Biomechanics and Movement Organization. New York e.a: Springer-Verlag; 1990. pp. 312–334. [Google Scholar]
- Shim JK, Lay B, Zatsiorsky VM, Latash ML. Age-related changes in finger coordination in static prehension tasks. J Appl Physiol. 2004;97:213–224. doi: 10.1152/japplphysiol.00045.2004. [DOI] [PMC free article] [PubMed] [Google Scholar]
- Singh T, SKM V, Zatsiorsky VM, Latash ML. Fatigue and motor redundancy: Adaptive increase in force variance in multi-finger tasks. J Neurophysiol. 2010;103:2990–3000. doi: 10.1152/jn.00077.2010. [DOI] [PMC free article] [PubMed] [Google Scholar]
- Tawy GF, Rowe P, Biant L. Gait variability and motor control in patients with knee osteoarthritis as measured by the uncontrolled manifold technique. Gait Posture. 2018;59:272–277. doi: 10.1016/j.gaitpost.2017.08.015. [DOI] [PubMed] [Google Scholar]
- Tokuda K, Anan M, Takahashi M, Sawada T, Tanimoto K, Kito N, Shinkoda K. Biomechanical mechanism of lateral trunk lean gait for knee osteoarthritis patients. J Biomech. 2018;66:10–17. doi: 10.1016/j.jbiomech.2017.10.016. [DOI] [PubMed] [Google Scholar]
- Wu Y-H, Pazin N, Zatsiorsky VM, Latash ML. Practicing elements vs. practicing coordination: Changes in the structure of variance. J Motor Behav. 2012;44:471–478. doi: 10.1080/00222895.2012.740101. [DOI] [PMC free article] [PubMed] [Google Scholar]
- Wu Y-H, Pazin N, Zatsiorsky VM, Latash ML. Improving finger coordination in young and elderly persons. Exp Brain Res. 2013;226:273–283. doi: 10.1007/s00221-013-3433-4. [DOI] [PMC free article] [PubMed] [Google Scholar]
- Zatsiorsky VM, Latash ML. Multi-finger prehension: An overview. J Mot Behav. 2008;40:446–476. doi: 10.3200/JMBR.40.5.446-476. [DOI] [PMC free article] [PubMed] [Google Scholar]
- Zatsiorsky VM, Li ZM, Latash ML. Enslaving effects in multi-finger force production. Exp Brain Res. 2000;131:187–195. doi: 10.1007/s002219900261. [DOI] [PubMed] [Google Scholar]