Significance
The disparate results for shifts of polymer thin films raise the question of whether provides a good metric to characterize changes in the overall dynamics of these films. Our work demonstrates how different techniques to measure are influenced by the relaxation gradient across the film. We find that different measurement methods can provide contradictory estimates, depending on their sensitivity to dynamics near the substrate, providing a possible explanation for prior contradictory results. We take advantage of these differences by combining estimates to predict near the substrate. Our findings should be useful for polymer thin film applications, including microelectronic devices, lithium battery technology, and the development of biomedical devices.
Keywords: thin polymer film, glass transition, film dynamics
Abstract
There is significant variation in the reported magnitude and even the sign of shifts in thin polymer films with nominally the same chemistry, film thickness, and supporting substrate. The implicit assumption is that methods used to estimate in bulk materials are relevant for inferring dynamic changes in thin films. To test the validity of this assumption, we perform molecular simulations of a coarse-grained polymer melt supported on an attractive substrate. As observed in many experiments, we find that based on thermodynamic criteria (temperature dependence of film height or enthalpy) decreases with decreasing film thickness, regardless of the polymer–substrate interaction strength . In contrast, we find that based on a dynamic criterion (relaxation of the dynamic structure factor) also decreases with decreasing thickness when is relatively weak, but increases when exceeds the polymer–polymer interaction strength. We show that these qualitatively different trends in reflect differing sensitivities to the mobility gradient across the film. Apparently, the slowly relaxing polymer segments in the substrate region make the largest contribution to the shift of in the dynamic measurement, but this part of the film contributes less to the thermodynamic estimate of . Our results emphasize the limitations of using to infer changes in the dynamics of polymer thin films. However, we show that the thermodynamic and dynamic estimates of can be combined to predict local changes in near the substrate, providing a simple method to infer information about the mobility gradient.
Ultrathin polymer films have important practical applications, ranging from flexible integrated circuits (1) to tissue engineering (2). These films are often spin coated on solid substrates, including silicon, silica, and aluminum, and the properties of the resulting polymer films are often found to deviate from those of the corresponding bulk material (3–20). Understanding the origin of thermodynamic and dynamic changes in “ultrathin” films is important not only for the applications of these materials, but also for our understanding of the fundamental nature of glass formation. The most common metric to quantify the dynamic changes in these films is the glass transition temperature . Many studies have been devoted to how the substrate (21–25), film thickness (15, 26), molecular mass (4, 27), or physical aging (8, 28–30) affects the apparent film . It is generally appreciated that the “free” surface layer of the polymer film, i.e., the polymer–air interface, exhibits enhanced dynamics; changes to dynamics near the substrate vary, depending on the strength of polymer–substrate interactions, and strongly attractive substrates are expected to slow dynamics. As the film thickness decreases, the effects of the interfaces become increasingly large. The theoretical challenge is to understand how competing interfacial and confinement effects give rise to changes in observed values, as well as the sensitivity of various methods to the gradient of molecular relaxation across the film.
Despite the substantial literature on changes in polymer films, there are wide variations in the magnitude, and even whether should decrease or increase, for a given film. For example, polystyrene, one of the most commonly studied polymer films, shows a decreasing with decreasing film thickness for many different experimental methods, sample preparation procedures, and the physical nature of the supporting substrate. Many of these experiments use measurements from a thermodynamic approach, e.g., ellipsometry (measuring the change of film thickness with temperature) or differential scanning calorimetry (measuring specific heat as a function of temperature). On the other hand, inelastic neutron-scattering measurements (31–33) probing the mean-square molecular displacement on a picosecond timescale (fast relaxation time), a quantity directly related to the structural relaxation time at a segmental scale (34), indicate an upward shift of the for the same film for which a downward shift is indicated by the thermodynamics measurements. A summary of the wide range of reported results among many experimental methods is illustrated in figure 1 of Kremer et al. (35); we also recommend the recent review article on polymer films by Priestley et al. (36) which discusses the large disparities between estimates based on quasi-thermodynamic measurements vs. dynamic measurements. These conflicting estimates of illustrate the essential problem at hand.
Underlying these measurements is the assumption that methods to estimate in bulk materials are equally applicable to ultrathin films. Given the presence of significant mobility gradients and conflicting results, we raise the question of whether alone is a useful way to characterize dynamic changes in ultrathin films. To address this question, we carried out molecular dynamics simulations of thin polymer films having variable thickness and polymer–substrate interaction strength. We use both thermodynamic and dynamic definitions of to show that these different metrics can give qualitatively different indications of how film confinement influences glass formation. While it is evident that the community needs more direct measures of the mobility gradient across the film, as well as direct measures of relaxation time of the film as whole, we propose an approach to combine thermodynamic and dynamic estimates of to distinguish the substrate from the upper layers of the film. Thus, we do not suggest that we abandon as a tool to characterize thin polymer films. Instead, these measurements need to be considered in the context of which aspects of the mobility gradient they best reflect and how they can be combined to yield a more complete picture of the film dynamics.
Results and Discussion
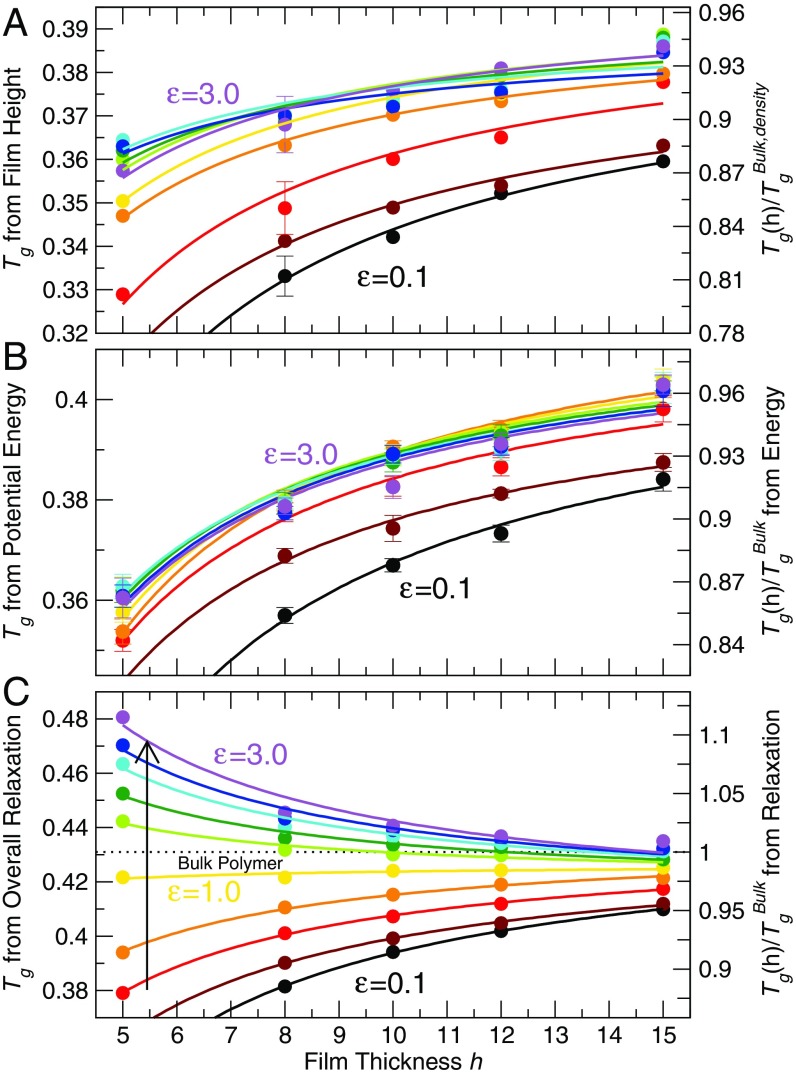
To illustrate the nature of the conflict among various measures of , we first contrast of the polymer film derived from both thermodynamic and dynamic approaches in Fig. 1. For thermodynamic definitions of , we examine measurements of film thickness (Fig. 1A) (analogous to ellipsometry measurements) or film potential energy (Fig. 1B) [analogous to differential scanning calorimetry (DSC) measurements]. As observed in many experiments (3, 6, 15, 21, 38–40), we find a decrease of for thinner films for the entire range of polymer–substrate interaction strength examined—even when substrate interactions are three times larger than those of the polymer–polymer interactions. In contrast, if we use a purely dynamic definition of from the incoherent intermediate scattering function, which is closely related to inelastic neutron-scattering experiments, we find that decreases for small , but increases when substrate–polymer interaction strengths exceed those of the polymer interaction strengths, . Thus, when the polymer–substrate interaction strength exceeds the polymer–polymer interaction strength, the thermodynamic and dynamic definitions of qualitatively disagree, the primary phenomenon that we address. We explain the technical procedure for these estimates of in SI Appendix, section II.
Fig. 1.
(A–C) The glass transition temperatures of thin polymer films, defined from the dependence of (A) film height and (B) potential energy, and (C) a fixed relaxation time [] plotted as a function of film thickness for polymer–substrate interaction strengths 0.1, 0.25, 0.5, 0.75, 1.0, 1.25, 1.5, 2.0, 2.5, and 3.0 (bottom to top). On the right side of the vertical axis, we normalize each definition of by the corresponding glass transition temperature of the bulk polymer . For A, we use defined by the dependence of density on heating, the nearest equivalent to film thickness. For both A and B, we average obtained from at least three independent runs and show the representative SE of the estimates. For extremely thin films , polymers do not adhere to the substrate for weak substrate interactions ( 0.1, 0.25), and thus we exclude values for those films. The lines are a guide for the eye and come from a fit to a model for the thickness dependence of (ref. 37 and SI Appendix, section IV).
Film Dynamics and Relaxation Gradient.
To explain the differences in values, we focus on polymer relaxation and its spatial variation. One common method to quantify the relaxation dynamics of the film is through the self-part of the intermediate scattering function,
| [1] |
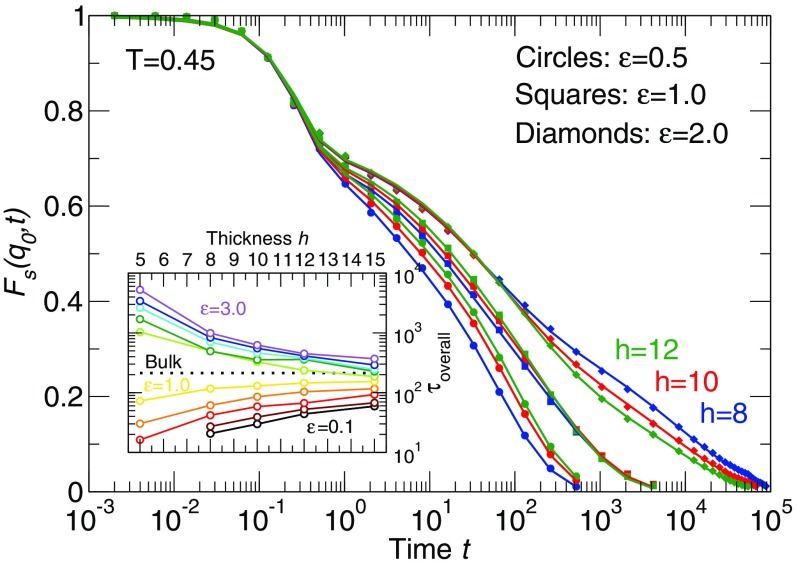
evaluated at , corresponding to the nearest-neighbor periodicity, so that we are determining a segmental relaxation time; the subscript s in stands for self. We also considered smaller corresponding to scale of the chain radius of gyration, as well as the center of mass relaxation, and we find results very similar to those presented below (SI Appendix, section III). can also be determined as a function of monomer position, which allows us to probe relaxation gradients in the film. Representative data for for several film thicknesses and substrate interactions are shown in in Fig. 2. For weak substrate–polymer interactions (), we use a two-step relaxation function to describe the data in Fig. 2,
| [2] |
where is the primary or “-relaxation time”; the vibrational relaxation time is nearly constant for all film heights , temperatures , and studied. For strong polymer–substrate interactions (), we follow earlier works (41–44) that examine the emergence of a bound layer near the substrate, which requires that we add an additional relaxation process to Eq. 2 to explicitly describe the bound layer relaxation time near the substrate,
| [3] |
where can be associated with the fraction of the substrate bound polymer segments ; is dominated by the relaxation of the unbound polymers in the film, and and are the stretching exponents for unbound and bound layer relaxations, respectively. We use Eq. 3 to fit in Fig. 2. From these data, it is apparent that for a sufficiently large , the relaxation from the plateau region is a multistep process, due to the presence of a large relaxation gradient near the interface. We address this complication below.
Fig. 2.
The self-part of the intermediate scattering function of thin polymer films at for representative polymer–substrate interaction strengths, 0.1, 1.0, and 2.0 and for representative film thickness , 10, and 12. Symbols are simulation data and lines are fits from Eqs. 2 and 3. The maximum root-mean-square deviation of all of the fits is . The black, red, and green curves represent film thickness , 10, and 12, respectively. For , the relaxation is substantially suppressed compared with smaller with the same film thickness. Inset shows the thickness dependence of overall film relaxation time . When the strength of the polymer–substrate interaction is nearly identical to the polymer–polymer interaction strength, is nearly independent of film thickness.
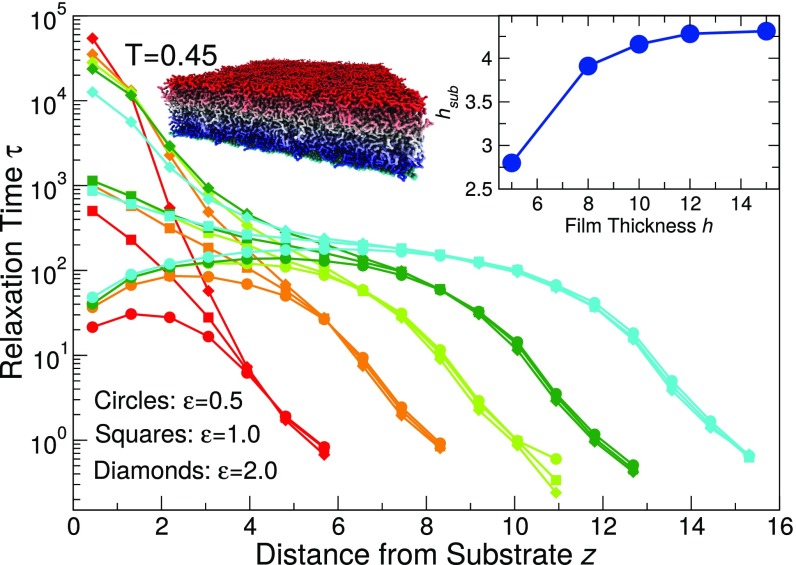
To understand the contradictory estimates of from thermodynamic and dynamic properties when the substrate is strongly attractive (Fig. 1), we focus on the gradient of the relaxation time in the polymer film in Fig. 3. Since the ultimate goal of reporting changes is to inform on the dynamics of the polymer film, we quantify the relaxation time of monomers across the film profile by partitioning into layers of thickness 0.875 parallel to the substrate; this layer size is similar to the spacing between monomers perpendicular to substrate direction, although the precise value of size used to group layers does not affect our findings. Monomers are associated with a layer based on their location at the time origin over which is calculated, and we average over many such time origins. Note that because is restricted to a local region, the gradient of mobility does not introduce a multistep decay from the plateau; in other words, the decay of from the plateau can be described by a single stretched exponential function, with a corresponding relaxation time . Fig. 3 shows the relaxation time as a function of the distance from the substrate for several representative and film thicknesses . We see that there is a significant mobility gradient across the film for all of the film thicknesses; the relaxation time near the substrate varies substantially with , spanning over three decades of time. Near the free surface, the relaxation time of all of the films is nearly the same for all of the thicknesses and studied; this result has also been observed in experiments (8, 45).
Fig. 3.
The spatial variation of relaxation time at for various film thicknesses (red), 8 (orange), 10 (light green), 12 (green), and 15 (light blue) and representative polymer–substrate interaction strength 0.5 (circles), 1.0 (squares), and 2.0 (diamonds). The relaxation time near the substrate spans over three decades of time for the range of shown here. The picture shows an illustration of the mobility gradient of the thin polymer film with a strongly interacting substrate; colors indicate the logarithmic scaled relaxation time from red (most mobile) to blue (least mobile). Inset shows the bound layer thickness as a function of the overall film thickness; is nearly and independent, and so we show an average over strong substrate interaction strengths .
Local Dynamic .
We suspect the large mobility gradient in the film is the origin of differences in the values reported by the thermodynamic and dynamic definitions of . Thus, we examine how varies in different regions of the film and how this compares to our previous estimates. To evaluate a dynamic for different parts of the film, we need to evaluate the dependence of relaxation time in each part of the film. Following a commonly invoked description of polymer films, we find it instructive to group the film into three parts—(i) a free surface layer, (ii) the middle layer, and (iii) the substrate layer. The free surface layer is defined by the top part of the film with a thickness of , corresponding to roughly two monomer “layers”; provided we average over an interfacial scale less than four monomer diameters at the free surface, the precise scale we choose is not important for the qualitative trends we report. The middle layer is defined by the central two monolayers (corresponding to a thickness ). To ensure the robustness of our findings, we also varied the scale of the middle region from one monolayer up to four monolayers and see no qualitative changes of our results. We can quantitatively estimate the thickness of the bound substrate layer using our fits (Eq. 3) to . Since , the fraction of substrate bound segments, the substrate layer thickness . Clearly, this definition is valid only when there are bound segments, which occurs for . Fig. 3, Inset shows that approaches a constant value () for thick films; for , decreases due to strong finite-size effects in very thin films. We find that is nearly independent of temperature and (above the threshold for bound segments), and thus we have reported averaged over various . In the case where there is no bound substrate layer (), we use the same values for shown in Fig. 3, Inset so that we have a comparable scale to define the substrate relaxation for all interaction strengths. Note that for , the film is so thin that the three regions are not readily distinguishable, so that the results for the thinnest film deviate from those for all other thicker films.
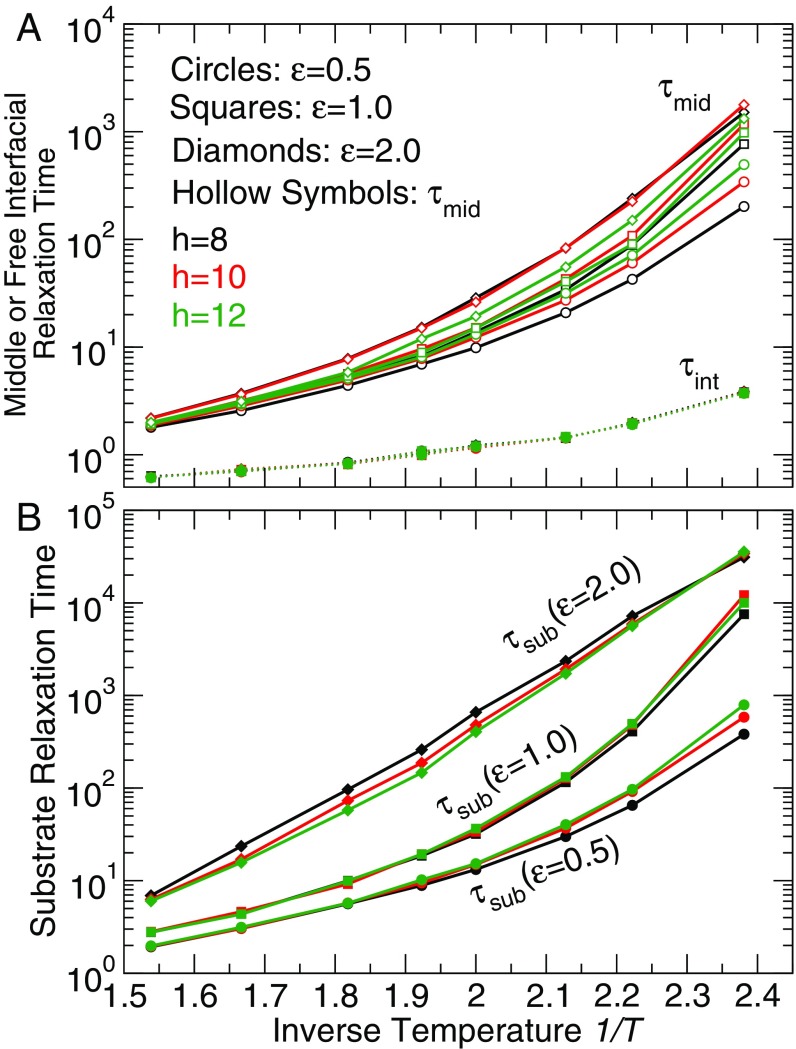
Using these definitions of film regions, we average the relaxation time in each of these three layers for all of the film thicknesses , temperatures , and polymer–substrate interaction strengths and obtain relaxation times for the interface , middle , and substrate . Fig. 4 shows for these layers as a function of inverse temperature for representative film thicknesses and interaction strengths . The relaxation time of the free surface layer is independent of film thickness and (excepting the thinnest film, ). The relaxation time of the middle film is nearly the same for all of the film thicknesses and at high (Fig. 4A). As temperature decreases, of thicker films increases more rapidly on cooling than that of thinner films; depends only weakly on (Fig. 4A). In contrast, the relaxation time of the substrate layer is more sensitive to the strength of polymer–substrate interactions than film thickness (Fig. 4B). Specifically, is significantly larger for larger , as expected from the profile of relaxation times across the film (Fig. 3). Note that, for substrate interaction strength and low , the substrate layer relaxation time exceeds accessible equilibrium scales of our simulations.
Fig. 4.
The average relaxation time of (A) film middle (open symbols), (B) substrate layer , and (A) free surface layer as a function of inverse temperature for representative film thickness (black), 10 (red), and 12 (green) and polymer–substrate interaction 0.5 (circles), 1.0 (squares), and 2.0 (diamonds). (solid symbols with dashed lines) for all of the and thickness is nearly identical at the same temperature; is nearly the same at high temperature and exhibits stronger dependence for thicker film; however, shows a significant dependence.
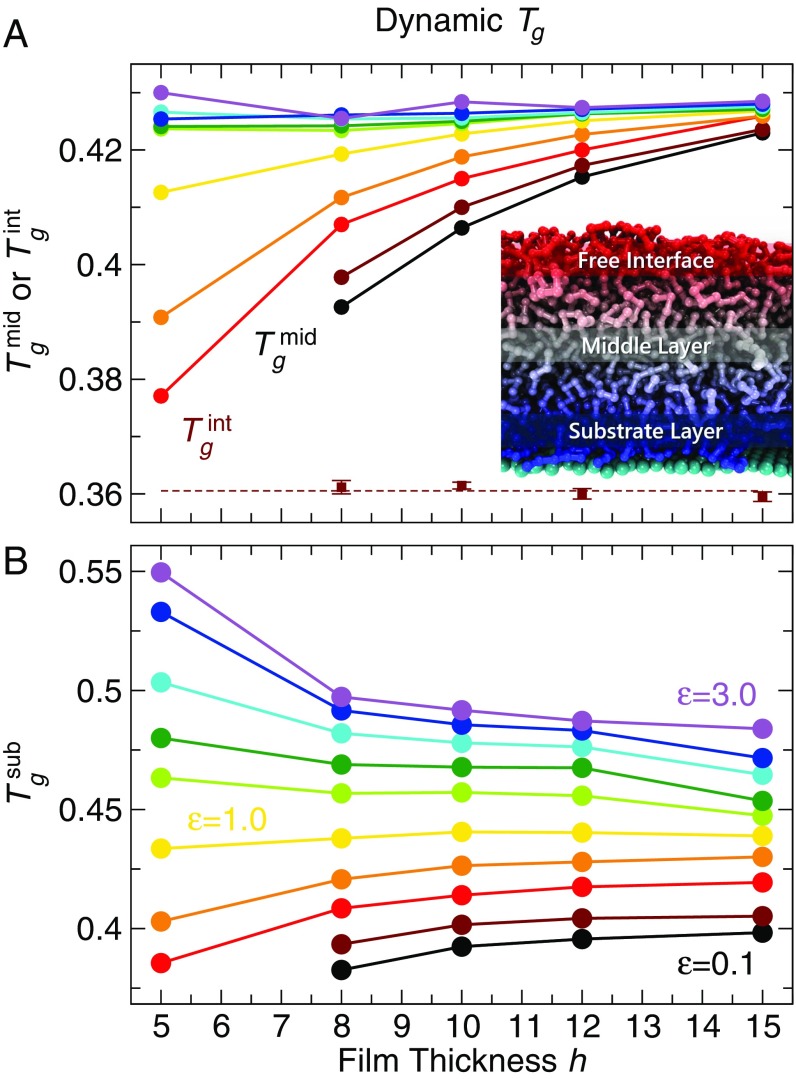
Based on the relaxation data for each region, we examine the dynamic glass transition temperature for each region of the film and compare this estimate with that determined from our previous thermodynamic and dynamic definitions for the overall changes. For each region, we use the same dynamic definition of as in Fig. 1C. Fig. 5 shows of the substrate, middle, and interfacial layers. For of the substrate layers, the thickness and behavior of tracks that of of the overall film relaxation in Fig. 1C. This result indicates that the slow-moving part of the film (substrate layer) significantly impacts the overall dynamic relaxation. In other words, substrate dynamics directly affect the overall dynamic . In contrast, from decreases for thinner films for all studied, similar to from the thermodynamic definitions in Fig. 1 A and B. Finally, of the free interface is reduced relative to the bulk and is nearly constant for all thicknesses and studied (except for the thinnest film , in which case the strongly attractive substrate effects impact the entire film profile). We also examined the local estimated from thermodynamic quantities for the same regions defined above. As shown in SI Appendix, section II.A, the local from potential energy decreases with increasing confinement for both the middle and substrate regions, mimicking the overall from potential energy for the film. It is particularly notable that for strong polymer–substrate interaction strengths, the thermodynamic of the substrate layer as a function of film thickness has the opposite trend to that from dynamics (relaxation time). This finding further reaffirms that the thermodynamic and dynamic definitions of decouple when there are strong interfacial interactions.
Fig. 5.
The dynamic glass transition temperatures from (A) middle film and free surface layers and (B) substrate layers of the film, defined by a fixed relaxation time, as a function of film thickness for all studied. For , from decreases with decreasing film thickness. For , from increases with decreasing thickness. In contrast, from decreases with decreasing film thickness for all . from is nearly identical for all thicknesses and (except for ). Therefore, we average over all for each film thickness and the error bars indicate the SE of .
These findings offer a clear picture of how different techniques to measure are affected by the presence of a large gradient in the polymer relaxation across the film. Specifically, the measured by the thermodynamic approach is evidently more strongly affected by changes in the relaxation of the interior and free interface of the film, but less sensitive to the substrate layer when that layer exhibits very slow relaxation due to strong attractive polymer–substrate interactions. As described in ref. 44, we expect the dynamics of the film interior are more strongly affected by the free surface than by the substrate, since substrate effects can be masked by a nearly immobile polymer layer at the substrate when is large; this is the so-called “cloaking” effect with strong substrate interactions. In contrast, the relaxation time of the film as a whole averages over the entire mobility gradient, which incorporates the effects of a slow substrate layer at strong interaction strength. It is for this reason that the thermodynamic and dynamic definitions can qualitatively differ for large substrate attraction strength. Consequently, the differences in from the thermodynamic and dynamic approaches are not contradictory; rather, they inform on different aspects of the film dynamics. The difference in sensitivity of thermodynamic and dynamic measurements is consistent with that obtained in recent simulations of free-standing films (46). From a more general perspective, the combination of these measurements could be helpful to estimate mobility gradients in thin films that are otherwise difficult to measure experimentally.
To build on this idea, we develop a simple model that allows us to estimate of the substrate layer using only data for the overall film that are readily accessible to experiments. To do so, we consider that our data suggest that the dynamic is a combination of the of bound substrate layer and unbound layers of the film, weighted in proportion to their respective thicknesses. Since we have shown that the thermodynamic estimate of appears to report only on the “unbound” portions of the film, we can write a simple superposition description that allows us to predict , as,
| [4] |
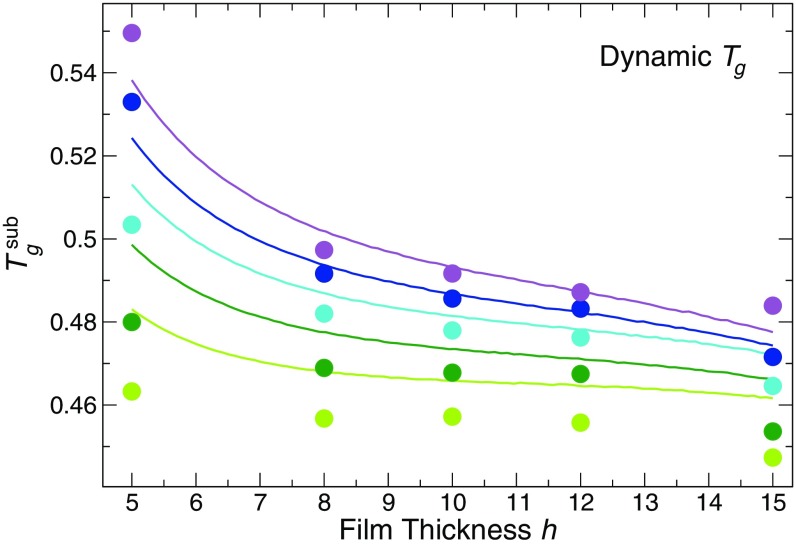
where is the glass transition temperature relative to the bulk value for the specific measurement method; this relative value accounts for minor differences in of the bulk material based on the technique used. This model applies only to cases where there is a distinct bound layer that the thermodynamic definition is not sensitive to (here, ). The substrate layer thickness is determined from the relaxation of , as shown previously in Fig. 3, Inset. We test our prediction for using as an input our measured dynamic and thermodynamic values and comparing them to the value directly evaluated from the relaxation time of the substrate layer. Fig. 6 shows the actual (solid circles) and predicted (solid curves) values from Eq. 4, which demonstrates that the simple layer model can reasonably predict the substrate relaxation. Since thermodynamic and dynamic measurements are experimentally possible, this model provides a way to experimentally estimate the substrate layer for strongly attractive substrates, without needing to directly probe substrate dynamics.
Fig. 6.
Comparison of the predicted dynamic substrate glass transition temperatures with values obtained from simulation. The solid circles are the values directly obtained from our data (same data as in Fig. 5A) with 1.25, 1.5, 2.0, 2.5, and 3.0. The solid curves are the values predicted from Eq. 4. The curves are obtained by first fitting the thickness dependence of the mean values from dynamic and thermodynamic methods using a Gibbs–Thomson-inspired model (see SI Appendix, section IV for a description).
Conclusions
We used molecular dynamics simulations to study the origin of the shifts in supported coarse-grained polymer films with variable film thickness and polymer–substrate interaction strength, . In particular, we investigated the impact of the mobility gradient within the thin polymer film on widely used methods for defining of these films. When the polymer–substrate interaction strength is less than that of the polymer–polymer interaction strength (), thermodynamic definitions of from film thickness and enthalpy, as well as a dynamic definition of from the density–density correlation function, all show a decreasing with decreasing film thickness, as anticipated by many previous experimental studies (3–10, 12–15). When the substrate interaction strength is greater than polymer–polymer interaction strength, the thickness dependence of the thermodynamic and dynamic measurements of decouples; specifically, from thermodynamic approaches still decreases with decreasing film thickness, while the dynamic increases with decreasing thickness. Apparently, on decreasing film thickness, estimated from the thermodynamic approaches is more strongly affected by the growing proportion of the free interfacial layer than by the substrate layer. This observation is consistent with the behavior of polymer–nanoparticle composites with strong polymer–nanoparticle interactions (41, 47–50). On the other hand, the slow relaxation near an attractive substrate significantly contributes to the dynamically determined relaxation of the film as a whole, so that the dynamically defined increases for large . The differences in sensitivity of these approaches to the relaxation near the film substrate lead to a decoupling between the thermodynamically and dynamically defined when substrate interactions are strong. Of course, we must be cautious about the generality of these findings since there are also experimental reports of increases of from thermodynamic methods (11, 18, 19, 51). Our important take-home message is that the different measurement methods can indeed yield qualitatively different estimates of .
The disparate results for raise the question of whether any single method provides a good metric for characterizing the dynamics of ultrathin polymer films. We propose that the answer to this question is “no.” Since the dynamics of these films differ substantially from the free surface to the substrate layer, attempts to characterize the dynamic changes in terms of changes in a single variable are inadequate. This is especially true in the case of a supported film on a strongly interacting substrate, where the dynamics at the substrate and free interface exhibit opposite changes relative to the bulk material. At best, changes in the value of report on some average of this gradient in mobility. On the other hand, these measurements are still valuable. Our results suggest that estimates from different approaches are sensitive to the different regions within the film. Thus, a combination of such measurements can be informative on the more detailed picture of the gradient in molecular mobility of the film. Indeed, we developed a simple approach that suggests we can predict near the substrate of a film using only data for the mean obtained from thermodynamic and dynamic methods. It will be valuable to test this approach experimentally. However, careful measurements of the gradient of relaxation across the film profile are ultimately needed to provide a complete picture of the film dynamics.
Simulation Methods
We simulate supported thin polymer films with variable film thickness and strength of attractive interaction between the substrate and polymer, using molecular dynamics simulations. The polymer film model is the same as that used in refs. 37 and 44. The polymer films have 200, 320, 400, 480, or 600 polymer chains; these films have thicknesses , , , , and , respectively, which decrease approaching . These films are referred to as , 8, 10, 12, and 15. Above the film is free (empty) space, so the film is effectively at pressure . As a reference for the thermodynamic and dynamic properties, we also simulated a bulk polymer with periodic boundary conditions in all directions at pressure . The reduced units can be mapped onto physical units relevant to the commonly used polymer materials, such as polystyrene, by taking nm, 1 time unit ps, kJ/mol, and C. Additional technical details of the simulations are provided in SI Appendix, section I.
Supplementary Material
Acknowledgments
Computer time was provided by Wesleyan University. This work was supported in part by National Institute of Standards and Technology (NIST) Award 70NANB15H282.
Footnotes
The authors declare no conflict of interest.
This article is a PNAS Direct Submission.
This article contains supporting information online at www.pnas.org/lookup/suppl/doi:10.1073/pnas.1722024115/-/DCSupplemental.
References
- 1.Salvatore GA, et al. Wafer-scale design of lightweight and transparent electronics that wraps around hairs. Nat Commun. 2014;5:2982. doi: 10.1038/ncomms3982. [DOI] [PubMed] [Google Scholar]
- 2.Liu X, Ma PX. Polymeric scaffolds for bone tissue engineering. Ann Biomed Eng. 2004;32:477–486. doi: 10.1023/b:abme.0000017544.36001.8e. [DOI] [PubMed] [Google Scholar]
- 3.Forrest JA, Dalnoki-Veress K, Stevens JR, Dutcher JR. Effect of free surfaces on the glass transition temperature of thin polymer films. Phys Rev Lett. 1996;77:2002–2005. doi: 10.1103/PhysRevLett.77.2002. [DOI] [PubMed] [Google Scholar]
- 4.Forrest JA, DalnokiVeress K, Dutcher JR. Interface and chain confinement effects on the glass transition temperature of thin polymer films. Phys Rev E. 1997;56:5705–5716. [Google Scholar]
- 5.Fukao K, Miyamoto Y. Slow dynamics near glass transitions in thin polymer films. Phys Rev E. 2001;64:011803. doi: 10.1103/PhysRevE.64.011803. [DOI] [PubMed] [Google Scholar]
- 6.Ellison CJ, Torkelson JM. The distribution of glass-transition temperatures in nanoscopically confined glass formers. Nat Mater. 2003;2:695–700. doi: 10.1038/nmat980. [DOI] [PubMed] [Google Scholar]
- 7.Bansal A, et al. Quantitative equivalence between polymer nanocomposites and thin polymer films. Nat Mater. 2005;4:693–698. doi: 10.1038/nmat1447. [DOI] [PubMed] [Google Scholar]
- 8.Priestley RD, Ellison CJ, Broadbelt LJ, Torkelson JM. Structural relaxation of polymer glasses at surfaces, interfaces, and in between. Science. 2005;309:456–459. doi: 10.1126/science.1112217. [DOI] [PubMed] [Google Scholar]
- 9.Kim S, Hewlett SA, Roth CB, Torkelson JM. Confinement effects on glass transition temperature, transition breadth, and expansivity: Comparison of ellipsometry and fluorescence measurements on polystyrene films. Eur Phys J E. 2009;30:83–92. doi: 10.1140/epje/i2009-10510-y. [DOI] [PubMed] [Google Scholar]
- 10.Yang Z, Fujii Y, Lee FK, Lam CH, Tsui OKC. Glass transition dynamics and surface layer mobility in unentangled polystyrene films. Science. 2010;328:1676–1679. doi: 10.1126/science.1184394. [DOI] [PubMed] [Google Scholar]
- 11.Roth CB, Dutcher JR. Glass transition temperature of freely-standing films of atactic poly(methyl methacrylate) Eur Phys J E. 2003;12:91–95. doi: 10.1140/epjed/e2003-01-024-2. [DOI] [PubMed] [Google Scholar]
- 12.Roth CB, Dutcher JR. Glass transition and chain mobility in thin polymer films. J Electroanal Chem. 2005;584:13–22. [Google Scholar]
- 13.Glor EC, Fakhraai Z. Facilitation of interfacial dynamics in entangled polymer films. J Chem Phys. 2014;141:194505. doi: 10.1063/1.4901512. [DOI] [PubMed] [Google Scholar]
- 14.Gao S, Koh YP, Simon SL. Calorimetric glass transition of single polystyrene ultrathin films. Macromolecules. 2013;46:562–570. [Google Scholar]
- 15.Forrest JA, Dalnoki-Veress K. The glass transition in thin polymer films. Adv Colloid Interf Sci. 2001;94:167–196. [Google Scholar]
- 16.Napolitano S, Glynos E, Tito NB. Glass transition of polymers in bulk, confined geometries, and near interfaces. Rep Prog Phys. 2017;80:036602. doi: 10.1088/1361-6633/aa5284. [DOI] [PubMed] [Google Scholar]
- 17.Glor EC, Angrand GV, Fakhraai Z. Exploring the broadening and the existence of two glass transitions due to competing interfacial effects in thin, supported polymer films. J Chem Phys. 2017;146:203330. doi: 10.1063/1.4979944. [DOI] [PubMed] [Google Scholar]
- 18.Hartmann L, Gorbatschow W, Hauwede J, Kremer F. Molecular dynamics in thin films of isotactic poly(methyl methacrylate) Eur Phys J E. 2002;8:145–154. doi: 10.1140/epje/i2001-10073-y. [DOI] [PubMed] [Google Scholar]
- 19.Grohens Y, Brogly M, Labbe C, David MO, Schultz J. Glass transition of stereoregular poly(methyl methacrylate) at interfaces. Langmuir. 1998;14:2929–2932. [Google Scholar]
- 20.Zhang W, Douglas JF, Starr FW. Dynamical heterogeneity in a vapor-deposited polymer glass. J Chem Phys. 2017;146:203310. doi: 10.1063/1.4976542. [DOI] [PubMed] [Google Scholar]
- 21.Alexandris S, et al. Interfacial energy and glass temperature of polymers confined to nanoporous alumina. Macromolecules. 2016;49:7400–7414. [Google Scholar]
- 22.Perez-De-Eulate NG, Sferrazza M, Cangialosi D, Napolitano S. Irreversible adsorption erases the free surface effect on the Tg of supported films of poly(4-tert-butylstyrene) ACS Macro Lett. 2017;6:354–358. doi: 10.1021/acsmacrolett.7b00129. [DOI] [PubMed] [Google Scholar]
- 23.Nguyen HK, et al. Interfacial and annealing effects on primary -relaxation of ultrathin polymer films investigated at nanoscale. Macromolecules. 2012;45:2138–2144. [Google Scholar]
- 24.Fryer DS, et al. Dependence of the glass transition temperature of polymer films on interfacial energy and thickness. Macromolecules. 2001;34:5627–5634. [Google Scholar]
- 25.Napolitano S, Capponi S, Vanroy B. Glassy dynamics of soft matter under 1D confinement: How irreversible adsorption affects molecular packing, mobility gradients and orientational polarization in thin films. Eur Phys J E Soft Matter. 2013;36:61. doi: 10.1140/epje/i2013-13061-8. [DOI] [PubMed] [Google Scholar]
- 26.Keddie JL, Jones RA, Cory RA. Size-dependent depression of the glass transition temperature in polymer films. Europhys Lett. 1994;27:59–64. [Google Scholar]
- 27.Dalnoki-Veress K, Forrest J, Murray C, Gigault C, Dutcher J. Molecular weight dependence of reductions in the glass transition temperature of thin, freely standing polymer films. Phys Rev E. 2001;63:031801. doi: 10.1103/PhysRevE.63.031801. [DOI] [PubMed] [Google Scholar]
- 28.Koh YP, Grassia L, Simon SL. Structural recovery of a single polystyrene thin film using nanocalorimetry to extend the aging time and temperature range. Thermochim Acta. 2015;603:135–141. [Google Scholar]
- 29.Koh YP, Simon SL. Structural relaxation of stacked ultrathin polystyrene films. J Polym Sci B Polym Phys. 2008;46:2741–2753. [Google Scholar]
- 30.Pye JE, Rohald KA, Baker EA, Roth CB. Physical aging in ultrathin polystyrene films: Evidence of a gradient in dynamics at the free surface and its connection to the glass transition temperature reductions. Macromolecules. 2010;43:8296–8303. [Google Scholar]
- 31.Inoue R, et al. Glass transition and molecular mobility in polymer thin films. Phys Rev E. 2009;80:031802. doi: 10.1103/PhysRevE.80.031802. [DOI] [PubMed] [Google Scholar]
- 32.Soles CL, Douglas JF, Wu Wl, Dimeo RM. Incoherent neutron scattering and the dynamics of confined polycarbonate films. Phys Rev Lett. 2002;88:037401. doi: 10.1103/PhysRevLett.88.037401. [DOI] [PubMed] [Google Scholar]
- 33.Soles CL, Douglas JF, Wu Wl, Dimeo RM. Incoherent neutron scattering as a probe of the dynamics in molecularly thin polymer films. Macromolecules. 2003;36:373–379. [Google Scholar]
- 34.Betancourt BAP, Hanakata PZ, Starr FW, Douglas JF. Quantitative relations between cooperative motion, emergent elasticity, and free volume in model glass-forming polymer materials. Proc Natl Acad Sci USA. 2015;112:2966–2971. doi: 10.1073/pnas.1418654112. [DOI] [PMC free article] [PubMed] [Google Scholar]
- 35.Kremer F, Tress M, Mapesa EU. Glassy dynamics and glass transition in nanometric layers and films: A silver lining on the horizon. J Non-Cryst Solids. 2015;407:277–283. [Google Scholar]
- 36.Priestley RD, Cangialosi D, Napolitano S. On the equivalence between the thermodynamic and dynamic measurements of the glass transition in confined polymers. J Non-Cryst Solids. 2015;407:288–295. [Google Scholar]
- 37.Hanakata PZ, Pazmiño Betancourt BA, Douglas JF, Starr FW. A unifying framework to quantify the effects of substrate interactions, stiffness, and roughness on the dynamics of thin supported polymer films. J Chem Phys. 2015;142:234907. doi: 10.1063/1.4922481. [DOI] [PubMed] [Google Scholar]
- 38.Fakhraai Z, Forrest JA. Probing slow dynamics in supported thin polymer films. Phys Rev Lett. 2005;95:025701. doi: 10.1103/PhysRevLett.95.025701. [DOI] [PubMed] [Google Scholar]
- 39.Ellison C, Kim S, Hall D, Torkelson J. Confinement and processing effects on glass transition temperature and physical aging in ultrathin polymer films: Novel fluorescence measurements. Eur Phys J E Soft Matter. 2002;8:155–166. doi: 10.1140/epje/i2001-10057-y. [DOI] [PubMed] [Google Scholar]
- 40.Fukao K, Miyamoto Y. Glass transitions and dynamics in thin polymer films: Dielectric relaxation of thin films of polystyrene. Phys Rev E. 2000;61:1743–1754. doi: 10.1103/physreve.61.1743. [DOI] [PubMed] [Google Scholar]
- 41.Starr FW, Douglas JF, Meng D, Kumar SK. Bound layers “cloak” nanoparticles in strongly interacting polymer nanocomposites. ACS Nano. 2016;10:10960–10965. doi: 10.1021/acsnano.6b05683. [DOI] [PubMed] [Google Scholar]
- 42.Solar M, Binder K, Paul W. Relaxation processes and glass transition of confined polymer melts: A molecular dynamics simulation of 1, 4-polybutadiene between graphite walls. J Chem Phys. 2017;146:203308. doi: 10.1063/1.4975390. [DOI] [PubMed] [Google Scholar]
- 43.Yelash L, Virnau P, Binder K, Paul W. Three-step decay of time correlations at polymer-solid interfaces. Europhys Lett. 2012;98:28006. [Google Scholar]
- 44.Zhang W, Douglas JF, Starr FW. Effects of a “bound” substrate layer on the dynamics of supported polymer films. J Chem Phys. 2017;147:044901. doi: 10.1063/1.4994064. [DOI] [PubMed] [Google Scholar]
- 45.Zhang Y, Fakhraai Z. Decoupling of surface diffusion and relaxation dynamics of molecular glasses. Proc Natl Acad Sci USA. 2017;114:4915–4919. doi: 10.1073/pnas.1701400114. [DOI] [PMC free article] [PubMed] [Google Scholar]
- 46.Mangalara JH, Mackura ME, Marvin MD, Simmons DS. The relationship between dynamic and pseudo-thermodynamic measures of the glass transition temperature in nanostructured materials. J Chem Phys. 2017;146:203316. doi: 10.1063/1.4977520. [DOI] [PubMed] [Google Scholar]
- 47.Moll J, Kumar SK. Glass transitions in highly attractive highly filled polymer nanocomposites. Macromolecules. 2012;45:1131–1135. [Google Scholar]
- 48.Harton SE, et al. Immobilized polymer layers on spherical nanoparticles. Macromolecules. 2010;43:3415–3421. [Google Scholar]
- 49.Lu H, Nutt S. Restricted relaxation in polymer nanocomposites near the glass transition. Macromolecules. 2003;36:4010–4016. [Google Scholar]
- 50.Ash BJ, Schadler LS, Siegel RW. Glass transition behavior of alumina/polymethylmethacrylate nanocomposites. Mater Lett. 2002;55:83–87. [Google Scholar]
- 51.Priestley RD, Mundra MK, Barnett NJ, Broadbelt LJ, Torkelson JM. Effects of nanoscale confinement and interfaces on the glass transition temperatures of a series of poly(n-methacrylate) films. Aust J Chem. 2007;60:765–771. [Google Scholar]
Associated Data
This section collects any data citations, data availability statements, or supplementary materials included in this article.


