

Abstract
Even through more sensitive methods for quantifying trace levels of curcumin in plasma were urgently needed, beyond tandem mass spectrometry, the Paul trap MS/MS/MS has never been tested for curcumin quantification. Because of its unique trap function to accumulate target compounds selectively by optimizing multiple stage MS experiments, it showed great potential to remove background issues reported at low concentration ranges. A novel Triple stage Ion Trap Mass Spectrometry coupled with High Performance Liquid Chromatography (HPLC–ITMS/MS/MS) method has been developed and validated as a curcumin quantification method, for the first time. The use of isotope labeled curcumin-d6 as a novel internal standard (IS) is suggested and tested according to FDA validation procedure. A simplified sample preparation is introduced and validated by coupling a novel acetonitrile precipitation with molecular weight cut-off size exclusion method. This method demonstrated excellent recovery rate of 96.69%–109.26% and minimum matrix effect of 95.40%–110.98%. The lower limit of detection (LLOD) and lower limit of quantification (LLOQ) for curcumin in rat plasma were 0.1ng/ml and 1 ng/ml respectively. The linear calibration curve for quantifying curcumin in rat plasma was 1–3000 ng/ml (r2> 0.99) with intra-day and inter-day RSD and accuracy within ±5.11%. Its application in a Pharmacokinetics (PK) study demonstrated detection of curcumin at a very low plasma level (1.0 ng/ml) and it would be applied to larger sample size animal and clinical pharmacokinetic studies. The presented ITMS/MS/MS quantification method has shown its advantages, including better sensitivity, accuracy, precision, wider calibration range and simplicity in sample preparation, when comparing with other curcumin LC/MS analysis methods in the latest 4 years.
Keywords: curcumin, HPLC ITMS/MS/MS, rat plasma, curcumin-d6, pharmacokinetic
1. Introduction
Curcumin (CUR) has been categorized as a class IV molecule for its low water solubility and low permeability properties [1, 2] in the biopharmaceutical classification system (BCS). Although CUR has a variety of benefits, its low oral bioavailability [3] and rapid metabolism and elimination properties [4] result in very low plasma concentrations and limit its clinical application. Studies utilizing CUR with oral administration [5, 6] are increasing, which requires a highly sensitive analytical method. In 1953, the first liquid chromatographic (LC) method using spectrophotometric detection was designed to isolate and measure curcuminoids [7]. In 1993, Gas chromatography (GC) was also applied for the quantification of CUR [8]. Capillary electrophoresis was utilized for measurement of curcuminoids using photodiode array [9] or amperometric detection [10]. In 2003, a method for measurement in pig plasma using liquid–liquid extraction had also been developed with high-performance liquid chromatography (HPLC) with UV detection at 430 nm [11]. In 2003, Health et al. published a HPLC–UV (262 nm) detection for quantitative measurement of CURin human plasma and urine [12].
As the requests of detecting the small amount of detection CUR in biological matrix upon oral administration [5, 6] are increasing, a highly sensitive analytical method is badly needed. Subsequently, many methods have been developed for detecting CUR in plasma; however, their applicability for detecting lower amount CUR in in vivo pharmacokinetic (PK) research is limited. In a clinical study with healthy subjects, after orally taking 650 mg/kg free CUR (from 95% curcuminoids extract), the CUR concentration in plasma was undetectable [13]. The LC/MS method for measuring CUR in rat plasma by Vandita Kakkar et. al. can only quantify the concentration from 10–2000 ng/ml with determination coefficient (r2) >0.99 [14]. Even though multiple CUR determination methods were reported, in other reported references, at lower concentrations, the background noise is very high [15, 16], which limits the lower limit of quantification. Hence a more sensitive detection method with higher signal to noise ratio (S/N) is necessary for quantification of CUR at low concentrations in plasma.
While quardrupole MS remains as the major quantification methodology, an Ion trap triple stage MS method was introduced as an affordable alternative but only for identification of CUR and its metabolites [17]. Since then, however, the Ion trap MS3 has never been tested for quantification of CUR even it has great potential in accumulating target signature ions selectively in the Paul cavity. For the first time, as our primary aim, this manuscript describes a novel High-Performance Liquid Chromatography/Electrospray Ionization-Triple stage Ion Trap Mass Spectrometry (HPLC/ITMS/MS/MS) as a CUR quantification method, to increase the S/N ratio by reducing matrix background noises, resulting in a concurrent increase in sensitivity and in a wider range of concentration range.
In addition, using deuterated internal standards of CUR removed structure and biochemical differences, thus can help the detection of CUR in plasma after sample preparation. One publication used 18O labeled CUR as an internal standard [18], but it required significant time for synthesis. Nowadays, curcumin-d6 (CUR-d6) is commercially available. CUR-d6 should be tested as an internal standard for better CUR extraction efficiency and for more precise calibration curves based on isotope ratio quantification. The second aim of this study is to apply CUR-d6 for CUR assay by using a FDA validation procedure.
The third aim of this study is to validate a simplified sample preparation method. Pre-concentration using liquid-liquid extraction with evaporation under nitrogen is time consuming and labor intensive, causing fluctuation between batches. Here, we report a new validated preparation method, coupling protein precipitation extraction with size exclusion chromatography for CUR quantification in biological matrix in a more consistent and reproducible manner.
In the last several years, many LC/MS based CUR determination methods have been published [15, 16, 19–21]. Most of them were validated and tested by applications. Those latest methods are worth to be summarized and compared to advance the development of better CUR quantification methods. The final aim is to briefly compare the validated LC/MS based CUR quantification methods in the latest 4 years with presented new HPLC-IT/MS/MS/MS method.
2. Materials and Methods
2.1 Chemicals and reagents
CUR (98%), ethanol (99%), and formic acid (98%) were purchased from Sigma-Aldrich (St. Louis, MO). CUR-d6 (>98%, Santa Cruz Biotechnology, TX), Acetonitrile (ACN) and pure water for the LC mobile phase were purchased from Honeywell Burdick & Jackson (Muskegon, MI). Deionized water was obtained from a Milli-Q system (EMD Millipore™ Direct-Q™ 3, Millipore, Bedford, MA). Heparin sodium injections (1,000 U/ml) was purchased from Baxter Healthcare Corporation (Deerfield, IL) and sodium chloride injections (0.9%) were purchased from Hospira Inc. (Lake Forest, IL).
2.2 Animals
Three adult female Sprague-Dawley (SD) rats (250–300 g) with cannulated jugular veins were ordered from Hilltop Laboratories (Scottsdale, PA). The rats were acclimatized for three days in the Laboratory Animal Service facility at Rutgers University and had free access to food and water before the pharmacokinetics study. The experiments were carried out following the animal protocol approved by the Institutional Animal Care and Use Committee of Rutgers University (01–016).
2.3 Dosing of animals and plasma collection
On the day of the study, the cannulas inserted in rats’ jugular veins were cut open for blood collection. Heparinized saline (50 U/ml) was used to flush the cannulas and tubes. CUR was suspended in vehicle consisting of Cremophor, Tween 80, ethanol and water at a volume ratio of 1:1:1:7. CUR 250 mg/kg body weight was administered through oral gavage. Blood samples (0.2 ml) were withdrawn at 0, 10, 20, 30, 40, 50, 60, 120, 240, 360, 480 and 720 min after the oral administration of CUR. All blood samples were immediately centrifuged at 2,500 rpm at 4°C for 10 min to isolate plasma samples, which were saved at −80°C for further HPLC-ITMS/MS/MS analysis.
2.4 Sample preparation
CUR samples in rat plasma were prepared by a novel protein precipitation extraction (PPE) coupled with size exclusion chromatography (SEC) methods. PPE was carried out with cold acetonitrile (−20°C). Aliquots of original rats’ plasma samples (100 μL) and CUR standard samples in blank SD rat plasma (100 μL, Innovative Research, MI) spiked with CUR-d6 as an internal standard (IS) were mixed with 300 μL cold acetonitrile and whirled for 30 sec on a desktop vortex. The resulted mixture was followed by a SEC procedure. It was centrifuged at 4°C, 16,000g for 25 min. Three hundred microliter (300 μl) of the supernatant was carefully transferred to an OMEGA NANOSEP 10K size exclusion tubes (cut-off 10kd, Pall cooperation, NY) and centrifuged at 4°C, 16,000g for 30 min. The filtered CUR-IS solution was then added into a 300 μL autosampler vial (Life Technologies, NY).
2.5 HPLC-ITMS/MS/MS analysis of CUR in rat plasma
HPLC-ITMS/MS/MS analysis was performed using a Thermo Finnigan LTQ mass spectrometer coupled with a Thermo Finnigan Surveyor HPLC System (Thermo Fisher Scientific Inc., San Jose, CA). LC separation was achieved by a Zorbax Eclipse XDB C18 column (3.5 μm, 4.6×50 mm, Agilent Technologies, Santa Clara, CA). The aqueous mobile phase A was composed of 0.1% formic acid in water, and the organic mobile phase B was acetonitrile (ACN). The temperatures of column oven and auto-sampler were 40°C and 4°C, respectively. The total run time for the analysis was 11 min. The mobile phase was 25:75 (A: B, v/v) for the first 0.8 min with flow rate 250 μL/min, followed by 15:85 (A: B, v/v) for 1.1 min at flow rate 250 μL/min then transited to 5:95 (A:B, v/v) with flow rate 400 μL/min in 2 min. The mobile phase was maintained at 5:95 (A: B, v/v) at 400 μL/min for an additional 4 min and then returned to 25:75 (A: B, v/v) at250 μL/min for 3 min. The volume of the injected sample was 25 μL. ITMS system was operated in a MS3 mode with a positive Electrospray ionization (ESI) ion source. The analytes were detected using consecutive reaction monitoring (CRM) mode. The ion transition for CUR was m/z 369-245-213 (detection of base peak 213 m/z for MS3 after 245.1 m/z for MS2 of 369.2 m/z) and for CUR-d6 was m/z 375-248-213 (detection of base peak 213 m/z for MS3 after 248.1 m/z for MS2 of 375.2 m/z) with normalized collision energy of 30V for the first transition and 35V for the second transition.
2.6. Bioanalytical method validation
2.6.1. Specificity
The specificity of the analytical method was determined by comparing different concentrations of CUR in rat plasma samples to investigate whether CUR and CUR-d6 can be differentiated using the established extraction procedure and analysis method.
2.6.2. Calibration, linearity, and limit of quantification
Calibration standard samples were prepared by spiking 500ng/ml CUR-d6 (IS) and different concentrations of CUR to the blank rat plasma. The calibration curves (y = ax + b) were calculated by plotting peak area ratios of CUR to the CUR-d6 (y) versus CUR concentration (x). The linearity of the calibration curve was evaluated with calibration standards over the different concentration range of 1–3000 ng/ml. The slope, intercept, and correlation coefficient (r) were measured by 1/X weighting factor. The lower limit of quantification (LLOQ) was determined as 5 times the response compared to blank response and the lower concentration of the calibration standards at which the precision was less than 20% and accuracy was within ±20% of the nominal concentration.
2.6.3. Precision and accuracy
Accuracy of the method was calculated as following: Accuracy = [(observed concentration – nominal concentration)/nominal concentration] × 100. Precision refers to coefficient of variation (%CV). Precision was determined by quality control (QC) samples at six concentrations (1–3000ng/ml). Intra-day accuracy and precision was calculated within one day by repeating analysis of the QC samples at concentrations ranging from 1ng/ml to 3000ng/ml (n = 6). Inter-day accuracy and precision were calculated by repeating analysis of QC samples on three different days for the same concentration range. The acceptable values of accuracy and precision were both set within ±15%.
2.6.4. Matrix effects
Post extraction spike method was used to evaluate the matrix effects (ME). The ME of analyte and IS were computed by calculating ratio of the peak area in the presence of rat plasma (B) (matrix spiked with high, middle and low concentration levels of QC samples) to the peak area of the standard CUR in the reconstitution solvent (A), and expressed as [%ME = B/A × 100]. A value of %ME = 100% is indicative of no matrix effects, a value %ME < 100% suggests ionization suppression or loss upon extraction and a value %ME > 100% suggests ionization enhancement.
2.6.5. Recovery
The extraction efficiency was calculated by comparing the peak areas of post-spiked standard solutions (Spost) with areas of pre-spiked standard solutions (Spre). The recovery (RE) of CUR was calculated as follows: RE (%) = Spost/Spre × 100.
2.7. Data analysis and PK
All quantification and calibration data were analyzed with Excel (Microsoft Office 2010, Microsoft, Redmond, USA). PK parameters for CUR in rat plasma were determined using noncompartmental analysis (NCA) and PK model in WinNonlin software (version 7.0, Pharsight, USA).
3. Results
3.1. Optimization of HPLC–ITMS/MS/MS setting
CUR and CUR-d6 were detected in a positive ESI with CRM mode. MS1, 2, 3 and related chromatography of CUR and CUR-d6 are presented in Figures 1 and 2. The mass spectrum of CUR and the IS obtained during full ITMS, displayed precursor ions [M+H] + at m/z of 369 for CUR (Figure 1B) and 375 (Figure 2B) for CUR-d6 respectively. During the initial MS2 analysis, after collision using 30 ev energy, product ions were generated at m/z of 245.1 for CUR (Figure 1D) and 248.1 for CUR-d6 (Figure 2D), respectively. Collision energies changed to 30 and 35 eV in sequence during optimization of the analysis to MS3, producing strong product ions at m/z of 175.1 and 213.0 for CUR (Figure 1F) and 178.1 and 213.1 for CUR-d6, respectively (Figure 2F). The optimized mobile phase composition produced stable peak shapes for CUR and CUR-d6 with the 25:75 mixtures of 0.1% formic acid and acetonitrile. The addition of 0.1% formic acid in water to the mobile phase improved the peak shape and accuracy of the analytes. After optimization, the chromatograms of CUR and IS under Triple stage ITMS3 mode displayed excellent symmetry and more specific peaks (Figures 1E and 2E).
Figure 1.

MS1, 2, 3 analysis of high concentration CUR: (A) Chromatogram of CUR under full ITMS mode; (B) +ESI Full ITMS of CUR and chemical structure of CUR; (C) Chromatogram of CUR under ITMS2 mode; (D) +ESI ITMS2 of 369.2 m/z; (E) Chromatogram of CUR under ITMS3 mode; (F) +ESI ITMS3 of CUR-d6 (MS3 of 245.1m/z after MS2 of 369.2 m/z)
Figure 2.

MS1, 2, 3 analysis of high concentration CUR-d6: (A) Chromatogram of CUR-d6 under full ITMS mode; (B) +ESI Full ITMS of CUR-d6 and chemical structure of CUR-d6; (C) Chromatogram of CUR-d6 under ITMS2 mode; (D) +ESI Full ITMS2 of 375.2 m/z; (E) Chromatogram of CUR under ITMS3 mode; (F)+ESI ITMS3 of CUR-d6 (MS3 of 248.1m/z after MS2 of 375.2 m/z)
3.2 Selection between MS2 or MS3 and Extracted Ion Chromatogram (EIC) mode or Total Ion Chromatogram (TIC) mode
Figure 3 demonstrates the comparison between MS2 or MS3 analysis method under EIC of ITMS2 at m/z 245 or ITMS3 at m/z 213 modes or TIC modes (both ITMS2 and ITMS3) for 5ng/ml CUR in rat plasma. By comparing MS2 results to MS3 results, Figures 3A vs 3B and 3C vs 3D, the S/N ratio have been greatly enhanced when using MS3 analysis in both samples. S/N has been increased from 9 to 235 and from 18 to infinity respectively. By comparing TIC analysis mode and EIC mode, Figures 3B vs 3D, EIC at m/z 213 analysis mode was found to generate the highest S/N ratio (235 vs. infinity). Hence Triple stage ITMS3 detection mode using EIC at m/z 213 is the optimized mode and has been selected.
Figure 3.

MS2 and MS3 of CUR in rat plasma by using EIC mode or TIC mode: (A) MS2 analysis of 5 ng/ml CUR in TIC; (B) MS3 analysis of 5ng/ml CUR in TIC; (C) MS2 analysis of 5ng/ml CUR of EIC at m/z 245.1; (D) MS3 analysis of 5ng/ml CUR of EIC at m/z 213.1
3.3. Specificity
The specificity of the analytical method was determined by comparing the chromatograms of different concentrations of CUR in rat plasma. Representative chromatograms are shown in Figure 4, including blank rat plasma (Figure 4A), 0.1ng/ml CUR spiked in rat plasma (Figure 4B) and 3000ng/ml CUR spiked in rat plasma (Figure 4C). Under the MS3 of EIC at m/z 213 detection condition, the background noise is negligible and 0.1ng/ml to 3000ng/ml CUR in rat plasma can be detected with a very high S/N ratio (27 and 1267 respectively). The method was proven to be specific to detect CUR with very minor influence by other internal constituent in rat plasma.
Figure 4.

MS3 of blank plasma, 0.1ng/ml CUR and 3000ng/ml CUR in rat plasma: (A) MS3 analysis of blank plasma of EIC at m/z 213.1; (B) MS3 analysis of 0.1ng/ml CUR of EIC at m/z 213.1; (C) MS3 analysis of 3000 ng/ml CUR of EIC at m/z 213.1.
3.4. Calibration, linearity, and limit of quantification
The calibration curve was linear within the concentration range of 1–3000 ng/ml of CUR in rat plasma, with determination coefficient r2 > 0.99 and consistent slope when determined by weighted (1/x) linear regression. The calibration curve equation is Y=0.00199954+0.00233542X. The lower limit of detection (LLOD) was 0.1 ng/ml and lower limit of quantitation (LLOQ) for CUR in rat plasma was 1 ng/ml.
3.5. Accuracy and precision
The results of intra-day (n = 6) and inter-day (n = 6) accuracies and precisions of CUR estimated by evaluating six concentrations of QC samples (1–3000 ng/ml) (each repeated 6 times) are shown in Table 1. Intra- and inter-day RSD and accuracy in rat plasma were within ±5.11% for all concentrations. All bias and RSD values met the acceptance limits set by the FDA guidance Bioanalytical Method Validation (less than 15%) (2001).
Table 1.
Intra-day and inter day accuracies and precisions of CUR (n=6)
| Concentration (ng/ml) | Intra-day mean (ng/ml) | RSD (%) | Accuracy (%) | Inter-day Mean (ng/ml) | RSD (%) | Accuracy (%) |
|---|---|---|---|---|---|---|
| 1 | 1.03 | 4.42 | 3.17 | 1.01 | 5.05 | 1.12 |
| 5 | 4.99 | 3.60 | −0.12 | 5.00 | 3.60 | 0.09 |
| 50 | 50.42 | 3.83 | 0.85 | 49.53 | 3.32 | −0.94 |
| 400 | 412.58 | 1.87 | 3.14 | 406.21 | 2.00 | 1.55 |
| 1200 | 1209.69 | 1.87 | 0.81 | 1210.87 | 2.39 | 0.91 |
| 3000 | 2846.70 | 1.87 | −5.11 | 2945.93 | 2.26 | −1.80 |
3.6. Matrix Effects (ME)
Effects of rat plasma on ion suppression/enhancement were evaluated at three concentration levels (5, 400, 3000 ng/ml) for CUR and at 500 ng/ml for the CUR-d6. The detailed matrix results are shown in Table 2. The ME of CUR at three QC levels was found to be within the acceptable limits (95%–111%) and with a very low RSD (1.28%–2.24%). These above finding suggested that ME from the rat plasma were minor under the current method settings.
Table 2.
CUR recovery rate and matrix effect (%) (n=6)
| Concentration (ng/ml) | Recovery (%) | Matrix Effect (%) | ||
|---|---|---|---|---|
| Mean | RSD | Mean | RSD | |
| 5 | 96.69 | 2.24 | 95.40 | 8.12 |
| 400 | 96.17 | 1.54 | 110.98 | 1.48 |
| 3000 | 109.26 | 1.28 | 109.52 | 1.25 |
3.7 Recovery
The sample preparation recovery of CUR was evaluated by comparing the CUR/IS peak area ratios of extracted QC standards (5, 400, 3000 ng/ml for CUR) with those from the of non-extracted same-concentration standards. The recovery percentage were ranging from 96.69%–109.26% (Table 2) with a very low RSD (1.25%–8.12%), which indicated an outstanding reproducible recovery rate for CUR from plasma by current method.
3.8 Application of the validated CUR quantification method to oral pharmacokinetic (PK) study
We continued to investigate the application of the validated quantification method to analyze pharmacokinetic (PK) profile in rats’ plasma after orally given 250 mg/kg CUR. The mean plasma CUR concentration versus time and PK analysis and prediction by Pheonix WinNonlin (Cetera, Princeton, NJ) are shown in Figure 5 and Table 3. The maximum plasma drug concentration (Cmax)was 25.89 ng/ml with Tmax= 10.00 min. Based on WinNonlin analysis, the oral PK data fits a two-compartment model quite well (Figure 5). The indefinite Area Under curve (AUC 0–∞) (ng/ml min) of CUR after oral administration was 1392.78 min×ng/ml. The indefinite Mean Residence Time (MRT0–∞) (min) was 73.45min. The t1/2α and t1/2β were 20.09 min and 68.72 min respectively (Table 3).
Figure 5.
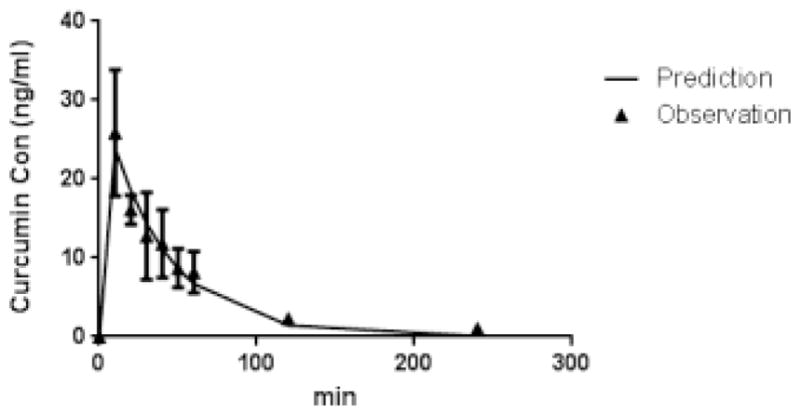
Rat CUR plasma pharmacokinetics profile after oral administration of CUR (250 mg/kg) by two-compartment model. Solid triangles with error bar represent the observed mean plasma concentration with standard deviation and the solid line represents the two-compartment analysis and prediction for CUR oral pharmacokinetics results.
Table 3.
CUR rat oral PK parameters
| Parameters | Curcumin |
|---|---|
| V1_F (ml) | 1940929.94 |
| V2_F (ml) | 808969.97 |
| CL_F (ml/min) | 39413.94 |
| CLD2_F (ml/min) | 13860.51 |
| t1/2α (min) | 20.09 |
| t1/2β (min) | 68.72 |
| Cmax (ng/ml) | 25.89 |
| Tmax (min) | 10.00 |
| AUC0–∞ (min×ng/ml) | 1392.78 |
| MRT0–∞(min) | 73.45 |
4. Discussion
As summarized in the analysis methods comparison table (Table 4), triple quadrupole mass spectrometers are still the first choice for pharmacokinetic studies. However, as bench-top scale Ion trap has been a good alternative with better affordability, the presented method planned to make good use of one of the old-fashioned Ion Trap MS systems, not a latest ITMS model with high resolution and sensitivity. Ion trap has a freedom of multiple state MS to maximize selectivity and to reduce noise without scarifying sensitivity because it could accumulate and concentrate target ions in the Paul cavity.
Table 4.
Comparison of liquid chromatographic tendon mass spectrometry methods to quantify CUR
| Current method |
Chen, Z. et. al.[16] |
Ratnatilaka Na Bhuket, P. et. al.[19] |
Ma, W. et. al.[20] |
Ramalingam, P. et. al.[21] |
Cao, Y. et. al.[15] |
|
|---|---|---|---|---|---|---|
| Separation column | Agilent Zorbax Eclipse XDB C18 column (3.5 μm, 4.6×50 mm) | Agilent Poroshell SB-C18 (2.7 μm, 4.6 ×150mm) | Halo C8 column (2.7 μm, 4.6 × 50mm) | Waters ACQUITY UPLC BEH C18(1.7 μm, 100 × 2.1mm) | Sepax BR-C18 (5 μm, 1.0 × 100 mm) | Thermo BetaBasic-8 column (5 μm, 2.1 × 50 mm) |
|
| ||||||
| Detection Instrumentation | Thermo Finnigan LTQ XL iontrap MS, CRM | Thermo TSQ Quantum, SRM | AB SCIEX QTRAP®6500 mass spectrometer, MRM | AB SCIEX QTRAP®5500 tandem mass spectrometer, MRM | 6490 triple quadrupole MS, MRM | API 3000 quadrupole mass, MRM |
|
| ||||||
| Ionization/Mass Spectrometry mode | ESI/MS3 with Ion Trap MS | ESI/MS2 with Quadrupole | ESI/MS2 with Triple-Quadrupole | ESI/MS2 with Quadrupole | ESI/MS2 with Quadrupole | ESI/MS2 with Quadrupole |
|
| ||||||
| Ion pairs for CUR quantification | 369-245-213 | 369-179 | 369-177 | 369-177 | 369-285 | 369-177 |
|
| ||||||
| Internal Standard Type | CUR-d6 | Verapamil | dimethylcurcumin CUR analog | Glibenclamide CUR structure similarities | Salbutamol | Hesperetin |
| Deuterium labeled CUR | CUR structure similarities | CUR structure similarities | CUR structure similaities | |||
|
| ||||||
| Sample preparation method | Two dimension | Single dimension | Single dimension | Single dimension | Single dimension | Single dimension |
| PPE with acetonitrile and SEC | LLE with methyl tert-butyl | PPE with acetonitrile | PPE with methanol | LLE with ethyl acetate | LLE with ethyl acetate | |
|
| ||||||
| Recovery rate (%) | 96.2–109.3 | 90.3–102.8 | 81.4–86.7 | 89.2–100.5 | 77.7–84.1 | 35.2–44.6 |
|
| ||||||
| Recovery RSD (%) | 1.3–2.2 | 8.2–10.7 | 9.6–14.0 | 9.6 | 4.6–13.8* | N/A |
|
| ||||||
| Matrix Effect (%) | 95.4–111.0 | 76.7–88.6 | 41.4–44.3 | 89.2–105.9 | 101.9–103.5 | 69.2–80.3 |
|
| ||||||
| ME RSD (%) | 1.3–8.1 | 7.4–11.4 | N/A | N/A | 2.3–4.2* | N/A |
|
| ||||||
| LLOQ (ng/ml) | 1 | 1 | 1 | 5 | 2.5 | 2 |
|
| ||||||
| LLOD (ng/ml) | 0.1 | 0.5 | N/A | N/A | N/A | 1 |
|
| ||||||
| Linear Calibration range:ng/ml | 1–3000 | 1–1000 | 1–500 | 5–2000 | 2.5–2000 | 2–500 |
|
| ||||||
| Retention time (min) | 2.5 | 1.5 | 1.5 | 4.1 | 2.2 | N/A |
|
| ||||||
| Intra-assay accuracy (%) | −5.1–3.2 | 0.9–13.8 | −4.8–8.5 | −2.1–6.1 | −1.3–4.7 | −1.3–8.0 |
|
| ||||||
| Inter-assay accuracy (%) | −1.8–1.6 | −0.7–9.1 | −3.3–1.5 | −2.0–4.6 | −6.6–0.7 | −2.1–4.0 |
|
| ||||||
| Intra-assay precision (RSD %) | 1.9–4.4 | 2.1–5.1 | 3.1–12.6 | 7.7–14.4 | 1.8–12.3 | 4.7–7.6 |
|
| ||||||
| Inter-assay precision (RSD %) | 2.0–5.1 | 6.2–10.3 | 8.8–10.7 | 0.6–5.6 | 1.7–13.1 | 1.8–10.9 |
|
| ||||||
| Remarks | First ITMS3; PPE+SEC; Curcumin-d6; 1–3000 ng/ml for curcumin Linear calibration range | UPLC-MS-MS | protein precipitation method | 5–2000 ng/ml for curcumin Linear calibration range | LC-MS/MS method for the analysis of curcumin in mouse plasma and brain tissue | 2–1000 ng/ml for curcumin Linear calibration range |
calculated by (Standard Deviation/Average) ×100%
Although there are several publications utilized LC-tandem quadrupole with ion trap to detect curcuminoids [17, 22–26], only Tamvakopoulos C. et. al.[17] applied triple stage MS for CUR and its metabolites identification purpose only. Since previous ITMS3 method was solely tested for CUR identification in an ex-vivo experiment in mouse and human microsomes with a single step sample preparation without using any internal standard, naturally there is no report of validation procedure and no calibration curves for quantification of CUR in biological samples by using this previous ITMS3.
To the best of our knowledge, this presented ITMS3 method is the first validated ITMS3 based CUR quantification method according to the latest FDA requirements. This experimental method also introduced a simplified two-dimension PPE+SEC sample preparation method, which generated a more pure background and assured the better sensitivity and selectivity. For the first time, CUR-d6 was tested as an internal standard in CUR quantification and was successfully validated in this study. The suggested method is also tested to quantify CUR in in vivo experiment in rat plasma samples and has proven its applicability in PK study.
ValidatedLC/MS methods in quantifying CUR in the latest 4 years have been compared with the current experiment method in Table 4. The current method has the following remarkable advantages in detecting LLOQ and LLOD of CUR comparing with others. First of all, most of the latest CUR assays showed interference and background problems at the lower concentration levels of CUR (please refer to figure 1B of reference [16], figure 5H of reference [19] and figure 3C of the reference [15]). By developing this quantitative ITMS3 method, extremely clean backgrounds were achieved even at the LLOD level in this study. Figure 4 showed S/N=27 at the LLOD of CUR (0.1 ng/ml) in plasma. However, the minimum LLOD of other methods are only 0.5ng/ml. Secondly, to be strict for this manuscript, current ITMS3 method suggested 1ng/ml as the LLOQ. In the future practice, it is very likely to get it close to 0.5 ng/ml at least and LLOD could be 0.01 ng/ml assuming the minimum S/N ratio is 3. Thirdly, the intra-day, inter-day accuracies and precisions of LLOQ of this validated method are remarkably all less than 5.05%, which is less than other methods and FDA requirement (less than 20%). In the end, the linear Calibration range was larger than the others [15, 16, 19–21] (Table 4). That means this method can be applied for both our oral (with lowest detection concentration around 1ng/ml) and IV CUR PK/PD study (with highest detection concentration around 3000ng/ml) with one set of calibration curve. The innovation of current method will be further discussed in the following three more aspects.
4.1 PPE coupled SEC preparation
Table 4 compares recent (last 4 years) sample preparation methods for detection CUR in plasma. Liquid-Liquid Extraction (LLE) method [15, 16, 21] and PPE method [19, 20] were the most commonly applied methods. LLE methods have low noise in the prepared samples but are time consuming and labor intensive. Relatively large variability also hindered reproducibility due to multiple rounds of extraction. PPE is relatively easy and less time/labor consuming; however low molecular weight proteins and other impurities, which are difficult to get rid of by precipitation, will increase the sample background and lower the LLOQ. The new reported two-dimension sample preparation method, which includes both PPE and SEC, can extract cleaner target fractions from plasma with lower noise (Figure 4) and with very low labor and fast speed. Thecurrent method has demonstrated comparable good recovery rate to the methods with best recovery rate [16, 20] and comparable minimum ME to the methods with minimum ME [20, 21], which are all close to 100%. Meanwhile, the new extraction method also has lowest recovery RSD (1.3%–2.2%), Intra-assay RSD (1.9%–4.4%) and Inter-assay RSD (2.0%–5.1%), which suggests the new reported method is more consistent and reproducible than others as well (Table 4).
4.2 CUR-d6 as a novel internal standard
Previous papers used structure simulants, such as verapamil [16], glibenclamide [20], salbutamol [21] and hesperetin [15]. CUR analog dimethylcurcumin was also utilized [19]. The structural differences prohibit precise extraction recovery estimation of CUR and generating bias in compound quantification. Stable isotope labeled compounds are most structurally similar and always desirable. CUR-d6 is a safe and stable deuterated labeled CUR, differing only 6 Dalton in molecular mass from CUR. This method is the first to report using CUR-d6 as an internal standard to quantify CUR. The results using the d6 demonstrated a much larger calibration range, higher accuracy and precision and higher recovery rate as compared with other methods (Table 4).
4.3 Improved HPLC-MS/MS/MS
In Table 4, ion pairs for quantification of CUR are compared. Most of the publications used 369–177[15, 19, 20]; there are also other ion pairs reports of 369–179[16] and 369–285[21]. In this study, it was observed that, by confirming with calibration curves of pure standards, both m/z 213 and 175 were fragmentations from CUR and both could be used as signature ions. However, MS calibration curves based on m/z 213 showed better linearity, selectivity and repeatability for actual spiked experiment by using rat plasma in this study. When comparing with quantification of CUR with m/z 213 and 175 and CUR-d6 with m/z 213 and 178, it was suggested to track both m/z 213, i.e. 369-245-213 for CUR and 375-248-213 for CUR-d6, will generate better S/N ratio in both compounds (Supplement Figure 1). The presented HPLC-MS/MS/MS also generated lowest LLOD and LLOQ with high S/N among all the methods in Table 4. Moreover, after applying the MS3 analysis method of CUR instead of MS2, it was found that a shorter run time is possible because of interference-free background. Naturally LC gradient has been re-optimized as currently reported and the retention time of CUR has been accelerated to around 2.5 min (Figures 3B & 3D and Figures 4B & 4C). This proves that this ITMS3 method could bring significant advantages when an ultra-performance liquid chromatography (UPLC) system is coupled.
The low oral bioavailability causes the plasma concentration of CUR, after taken orally, to be very low [27]. In vivo analysis of PK/PK-PD requires both oral and IV CUR administration and a large quantification range. This method does not suffer from the sensitivity and linear calibration range limitations of other two stage LC/MS/MS CUR quantification methods [15, 16, 19–21] (Table 4). The greater sensitivity and selectivity of MS3 spectrometry allows for quantitation over a much larger calibration range (1–3000ng/ml) (Table 4). This method provides an easier and more sensitive means to study oral and IV CUR PK/PK-PD simultaneously.
5. Conclusions
In conclusion, for the first time, we have developed and validated a robust and sensitive HPLC-ITMS/MS/MS method for the accurate and precise determination of CUR in rat plasma. By comparing with the latest CUR detection methods, our current method offers several advantages including: a simple and efficient PPE and SCE preparation method, a deuterated internal standard for better CUR extraction efficiency control, a triple stage LC/MS with improved sensitivity & selectivity, and a larger calibration range for both IV and oral PK study. PK results from rats after orally administration of CUR strongly suggest that this validated method can detect CURat a very low plasma level (1ng/ml) and it would be applied to larger sample size animal and clinical pharmacokinetic studies.
Supplementary Material
Highlights.
We are the first to develop and validate a quantitative High Performance Liquid Chromatography with Triple stage Ion Trap Mass Spectrometry (HPLC–ITMS/MS/MS) method to determine curcumin in rat plasma.
We are the first to introduce stable deuterated labeled curcumin, curcumin-d6 as an internal standard to quantify curcumin.
We are the first to apply and validate the two dimensional sample preparation method by coupling the Protein Precipitation Extraction (PPE) with Size Exclusion Chromatography (SEC) preparation methods to extract curcumin and curcumin-d6 from plasma samples.
A brief review on validated curcumin LC/MS analysis methods in the latest 4 years is summarized in the appendix Table, including comparison with presented new HPLC-IT/MS/MS/MS method
Acknowledgments
Funding
This work was supported in part by institutional funds and by R01-AT007065 from NCCIH and the Office of Dietary Supplements (ODS). Analytical support was provided in part by NIEHS ES05022.
The authors express sincere gratitude to all of the members of Dr. Tony Kong’s laboratory for their helpful discussions.
Footnotes
Notes
The authors declare that there are no conflicts of interest.
Publisher's Disclaimer: This is a PDF file of an unedited manuscript that has been accepted for publication. As a service to our customers we are providing this early version of the manuscript. The manuscript will undergo copyediting, typesetting, and review of the resulting proof before it is published in its final citable form. Please note that during the production process errors may be discovered which could affect the content, and all legal disclaimers that apply to the journal pertain.
References
- 1.Wahlang B, Pawar YB, Bansal AK. Identification of permeability-related hurdles in oral delivery of curcumin using the Caco-2 cell model. Eur J Pharm Biopharm. 2011;77(2):275–82. doi: 10.1016/j.ejpb.2010.12.006. [DOI] [PubMed] [Google Scholar]
- 2.Tonnesen HH. Solubility, chemical and photochemical stability of curcumin in surfactant solutions. Studies of curcumin and curcuminoids, XXVIII. Pharmazie. 2002;57(12):820–4. [PubMed] [Google Scholar]
- 3.Yang KY, Lin LC, Tseng TY, Wang SC, Tsai TH. Oral bioavailability of curcumin in rat and the herbal analysis from Curcuma longa by LC-MS/MS. Journal of chromatography. B Analytical technologies in the biomedical and life sciences. 2007;853(1–2):183–9. doi: 10.1016/j.jchromb.2007.03.010. [DOI] [PubMed] [Google Scholar]
- 4.Shoba G, Joy D, Joseph T, Majeed M, Rajendran R, Srinivas PS. Influence of piperine on the pharmacokinetics of curcumin in animals and human volunteers. Planta Med. 1998;64(4):353–6. doi: 10.1055/s-2006-957450. [DOI] [PubMed] [Google Scholar]
- 5.Anand P, Kunnumakkara AB, Newman RA, Aggarwal BB. Bioavailability of curcumin: problems and promises. Mol Pharm. 2007;4(6):807–18. doi: 10.1021/mp700113r. [DOI] [PubMed] [Google Scholar]
- 6.Pan MH, Huang TM, Lin JK. Biotransformation of curcumin through reduction and glucuronidation in mice. Drug Metab Dispos. 1999;27(4):486–94. [PubMed] [Google Scholar]
- 7.Srinivasan KR. A chromatographic study of the curcuminoids in Curcuma longa, L. J Pharm Pharmacol. 1953;5(7):448–57. doi: 10.1111/j.2042-7158.1953.tb14007.x. [DOI] [PubMed] [Google Scholar]
- 8.Sanagi MM, Ahmad UK, Smith RM. Application of supercritical fluid extraction and chromatography to the analysis of turmeric. Journal of chromatographic science. 1993;31(1):20–25. [Google Scholar]
- 9.Lechtenberg M, Quandt B, Nahrstedt A. Quantitative determination of curcuminoids in Curcuma rhizomes and rapid differentiation of Curcuma domestica Val. and Curcuma xanthorrhiza Roxb. by capillary electrophoresis. Phytochemical Analysis. 2004;15(3):152–158. doi: 10.1002/pca.759. [DOI] [PubMed] [Google Scholar]
- 10.Sun X, Gao C, Cao W, Yang X, Wang E. Capillary electrophoresis with amperometric detection of curcumin in Chinese herbal medicine pretreated by solid-phase extraction. Journal of Chromatography A. 2002;962(1):117–125. doi: 10.1016/s0021-9673(02)00509-5. [DOI] [PubMed] [Google Scholar]
- 11.Pak Y, Patek R, Mayersohn M. Sensitive and rapid isocratic liquid chromatography method for the quantitation of curcumin in plasma. Journal of Chromatography B. 2003;796(2):339–346. doi: 10.1016/j.jchromb.2003.08.018. [DOI] [PubMed] [Google Scholar]
- 12.Heath DD, Pruitt MA, Brenner DE, Rock CL. Curcumin in plasma and urine: quantitation by high-performance liquid chromatography. Journal of Chromatography B. 2003;783(1):287–295. doi: 10.1016/s1570-0232(02)00714-6. [DOI] [PubMed] [Google Scholar]
- 13.Gota VS, Maru GB, Soni TG, Gandhi TR, Kochar N, Agarwal MG. Safety and pharmacokinetics of a solid lipid curcumin particle formulation in osteosarcoma patients and healthy volunteers. J Agric Food Chem. 2010;58(4):2095–9. doi: 10.1021/jf9024807. [DOI] [PubMed] [Google Scholar]
- 14.Kakkar V, Singh S, Singla D, Sahwney S, Chauhan AS, Singh G, Kaur IP. Pharmacokinetic applicability of a validated liquid chromatography tandem mass spectroscopy method for orally administered curcumin loaded solid lipid nanoparticles to rats. Journal of chromatography. B, Analytical technologies in the biomedical and life sciences. 2010;878(32):3427–31. doi: 10.1016/j.jchromb.2010.10.017. [DOI] [PubMed] [Google Scholar]
- 15.Cao Y, Xu RX, Liu Z. A high-throughput quantification method of curcuminoids and curcumin metabolites in human plasma via high-performance liquid chromatography/tandem mass spectrometry. Journal of chromatography. B, Analytical technologies in the biomedical and life sciences. 2014;949–950:70–8. doi: 10.1016/j.jchromb.2013.12.039. [DOI] [PMC free article] [PubMed] [Google Scholar]
- 16.Chen Z, Sun D, Bi X, Zeng X, Luo W, Cai D, Zeng Q, Xu A. Pharmacokinetic based study on “lagged stimulation” of Curcumae Longae Rhizoma - Piper nigrum couplet in their main active components’ metabolism using UPLC-MS-MS. Phytomedicine : international journal of phytotherapy and phytopharmacology. 2017;27:15–22. doi: 10.1016/j.phymed.2017.01.012. [DOI] [PubMed] [Google Scholar]
- 17.Tamvakopoulos C, Sofianos ZD, Garbis SD, Pantazis P. Analysis of the in vitro metabolites of diferuloylmethane (curcumin) by liquid chromatography--tandem mass spectrometry on a hybrid quadrupole linear ion trap system: newly identified metabolites. European journal of drug metabolism and pharmacokinetics. 2007;32(1):51–7. doi: 10.1007/BF03190990. [DOI] [PubMed] [Google Scholar]
- 18.Gao D, Chen X, Yang X, Wu Q, Jin F, Wen H, Jiang Y, Liu H. Stable isotope labeling strategy for curcumin metabolite study in human liver microsomes by liquid chromatography-tandem mass spectrometry. J Am Soc Mass Spectrom. 2015;26(4):686–94. doi: 10.1007/s13361-014-1064-z. [DOI] [PubMed] [Google Scholar]
- 19.Ratnatilaka Na Bhuket P, Niwattisaiwong N, Limpikirati P, Khemawoot P, Towiwat P, Ongpipattanakul B, Rojsitthisak P. Simultaneous determination of curcumin diethyl disuccinate and its active metabolite curcumin in rat plasma by LC-MS/MS: Application of esterase inhibitors in the stabilization of an ester-containing prodrug. Journal of chromatography. B, Analytical technologies in the biomedical and life sciences. 2016;1033–1034:301–10. doi: 10.1016/j.jchromb.2016.08.039. [DOI] [PubMed] [Google Scholar]
- 20.Ma W, Wang J, Guo Q, Tu P. Simultaneous determination of doxorubicin and curcumin in rat plasma by LC-MS/MS and its application to pharmacokinetic study. Journal of pharmaceutical and biomedical analysis. 2015;111:215–21. doi: 10.1016/j.jpba.2015.04.007. [DOI] [PubMed] [Google Scholar]
- 21.Ramalingam P, Ko YT. A validated LC-MS/MS method for quantitative analysis of curcumin in mouse plasma and brain tissue and its application in pharmacokinetic and brain distribution studies. Journal of chromatography. B, Analytical technologies in the biomedical and life sciences. 2014;969:101–8. doi: 10.1016/j.jchromb.2014.08.009. [DOI] [PubMed] [Google Scholar]
- 22.Awad H, Das U, Dimmock J, El-Aneed A. Establishment of tandem mass spectrometric fingerprint of novel antineoplastic curcumin analogues using electrospray ionization. Rapid communications in mass spectrometry : RCM. 2015;29(14):1307–16. doi: 10.1002/rcm.7222. [DOI] [PubMed] [Google Scholar]
- 23.Jiang H, Somogyi A, Jacobsen NE, Timmermann BN, Gang DR. Analysis of curcuminoids by positive and negative electrospray ionization and tandem mass spectrometry. Rapid communications in mass spectrometry : RCM. 2006;20(6):1001–12. doi: 10.1002/rcm.2401. [DOI] [PubMed] [Google Scholar]
- 24.Li R, Qiao X, Li Q, He R, Ye M, Xiang C, Lin X, Guo D. Metabolic and pharmacokinetic studies of curcumin, demethoxycurcumin and bisdemethoxycurcumin in mice tumor after intragastric administration of nanoparticle formulations by liquid chromatography coupled with tandem mass spectrometry. Journal of chromatography. B, Analytical technologies in the biomedical and life sciences. 2011;879(26):2751–8. doi: 10.1016/j.jchromb.2011.07.042. [DOI] [PubMed] [Google Scholar]
- 25.Rahman AF, Angawi RF, Kadi AA. Spatial localisation of curcumin and rapid screening of the chemical compositions of turmeric rhizomes (Curcuma longa Linn.) using Direct Analysis in Real Time-Mass Spectrometry (DART-MS) Food chemistry. 2015;173:489–94. doi: 10.1016/j.foodchem.2014.10.049. [DOI] [PubMed] [Google Scholar]
- 26.Tan S, Calani L, Bresciani L, Dall’asta M, Faccini A, Augustin MA, Gras SL, Del Rio D. The degradation of curcuminoids in a human faecal fermentation model. International journal of food sciences and nutrition. 2015;66(7):790–6. doi: 10.3109/09637486.2015.1095865. [DOI] [PubMed] [Google Scholar]
- 27.Serafini MM, Catanzaro M, Rosini M, Racchi M, Lanni C. Curcumin in Alzheimer’s disease: Can we think to new strategies and perspectives for this molecule? Pharmacological research. 2017;124:146–155. doi: 10.1016/j.phrs.2017.08.004. [DOI] [PubMed] [Google Scholar]
Associated Data
This section collects any data citations, data availability statements, or supplementary materials included in this article.