

SUMMARY
Organoids derived from human pluripotent stem cells are a potentially powerful tool for high-throughput screening (HTS), but the complexity of organoid cultures poses a significant challenge for miniaturization and automation. Here we present a fully automated, HTS-compatible platform for enhanced differentiation and phenotyping of human kidney organoids. The entire 21-day protocol, from plating to differentiation to analysis, can be performed automatically by liquid handling robots, or alternatively by manual pipetting. High-content imaging analysis reveals both dose-dependent and threshold effects during organoid differentiation. Immunofluorescence and single-cell RNA sequencing identify previously-undetected parietal, interstitial, and partially-differentiated compartments within organoids, and define conditions that greatly expand the vascular endothelium. Chemical modulation of toxicity and disease phenotypes can be quantified for safety and efficacy prediction. Screening in gene-edited organoids in this system reveals an unexpected role for myosin in polycystic kidney disease. Organoids in HTS formats thus establish an attractive platform for multidimensional phenotypic screening.
eTOC
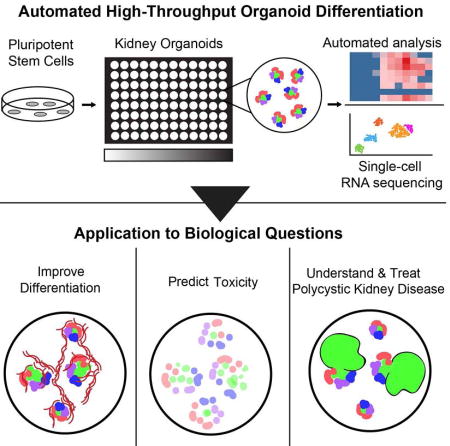
Organoids derived from human iPS cells have great potential for drug screening, but their complexity poses a challenge for miniaturization and automation. Freedman and colleagues establish a robotic pipeline to manufacture and analyze kidney organoids in microwell arrays. They apply this system to improve differentiation, measure toxicity, and comprehend disease.
INTRODUCTION
Organoids are collections of cells in vitro that resemble a bodily organ in structure and function. These next-generation cell culture systems remain highly accessible to experimental manipulation and analysis, but are also sufficiently complex to model tissue-scale development, injury, and disease (Freedman et al., 2015; McCracken et al., 2014). Human organoids have now been derived representing intestine, kidney, eye, and other organs (Freedman et al., 2015; Hayashi et al., 2016; McCracken et al., 2014; Morizane et al., 2015; Spence et al., 2011; Taguchi et al., 2014; Takasato et al., 2015). Many types of organoids can only be derived from human pluripotent stem cells (hPSCs), the cultured equivalents of the early embryonic epiblast, from which all somatic tissues differentiate (Thomson et al., 1998). As hPSC-derived organoids can be generated from any patient, they have great potential for immunocompatible tissue replacement therapies and prediction of individualized outcomes in human clinical populations (Dekkers et al., 2013; Huang et al., 2015; Takahashi et al., 2007).
An attractive potential application is to utilize organoids for automated, high-throughput screening (HTS) of hundreds of thousands of chemical compounds or genes simultaneously, at a scale that could not be accomplished in mammalian model organisms (Major et al., 2008). In contrast to the simple cell cultures typically used for HTS, organoids are capable of reconstituting features of complex disease, such as polycystic kidney disease (PKD) and brain microcephaly (Cruz et al., 2017; Freedman et al., 2015; Lancaster et al., 2013). Organoids derived from highly regenerative somatic stem cells, such as intestinal crypt cells or mammary cancers, have previously been generated in HTS-compatible formats, to enhance these cultures and identify modifiers of disease (Gracz et al., 2015; Sachs et al., 2017). However, organoids representing many organs can only be derived from hPSCs, involving three-dimensional growth conditions, lengthy stepwise differentiation steps, and special processing for immunofluorescence, all of which pose significant challenges to automation and miniaturization (Freedman et al., 2015; Hayashi et al., 2016; McCracken et al., 2014; Morizane et al., 2015; Spence et al., 2011; Taguchi et al., 2014; Takasato et al., 2015). For this reason, HTS involving hPSC derivatives has been limited to simpler cultures, such as cell monolayers, which are restricted in their capacity to model complex tissue phenotypes (Chen et al., 2009; Doulatov et al., 2017; Pagliuca et al., 2014; Sharma et al., 2017; Yang et al., 2013). Here, we describe protocols for the miniaturization and automation of human organoid differentiation from hPSCs, using the kidney as a representative organ lineage. We further demonstrate the feasibility of using this system to enhance organoid differentiation and model disease.
RESULTS
Differentiation of hPSCs into organoids in HTS formats
To generate organoids compatible with HTS, hPSCs were plated in 96-well and 384-well formats and differentiated into the kidney lineage for three weeks (Figure 1A). Kidney organoids are highly complex and of great biomedical interest for their potential to model disease, toxicity, and regeneration (Freedman et al., 2015; Morizane et al., 2015; Taguchi et al., 2014; Takasato et al., 2015). To establish protocols accessible to a broad range of laboratories, we prepared plates either manually, using multi-channel pipettes, or automatically, using liquid handling robots to perform all steps of plating, differentiation, fixation, and phenotyping (Figure 1A). Following differentiation, each well contained numerous kidney organoids, as detected by Lotus tetragonolobus lectin (LTL) binding of the proximal tubular segments (Figure 1B). In addition to proximal tubular cells, each organoid included distal tubule (ECAD+) and podocyte (NPHS1+) cell populations in distal-to-proximal arrangements (Figure 1C and Movie 1).
Figure 1. Generation of organoid plates in automated HTS formats.

(A) Schematic of organoid plate production.
(B) Representative wells of 96-well and 384-well kidney organoid plates at identical magnification, showing phase contrast image with proximal tubule (LTL) overlay in green. Zoom of boxed region (arrowhead) is shown below.
(C) Representative wells of a 384-well organoid plate labeled with nephron segment markers of proximal tubule (LTL), distal tubule (ECAD), and podocytes (NPHS1), showing progressive zoom of yellow boxed regions.
Scale bars, 100 µm. See also related Figure S1.
To simplify automation, these experiments adapted for HTS a differentiation protocol that involves only a single induction step with the kinase inhibitor CHIR99021 (Freedman et al., 2015). In side-by-side experiments, the nephron-like structures within the organoids derived using this protocol closely resembled those observed in organoids derived using protocols from other groups (Figure S1A–B) (Takasato et al., 2015). To accommodate high-throughput applications, differentiation was performed on standard tissue culture plates as previously described in larger wells (Freedman et al., 2015), rather than transwell plates or suspension cultures. This resulted in the formation of numerous kidney organoids per well, each organoid containing ~ 5 nephron-like structures and growing to a natural size of ~ 200 µm in diameter (Figure 1C and Movie 1), similar to intestinal organoids (Dekkers et al., 2013; Spence et al., 2011).
As these cultures were spread out in two-dimensions, the kidney organoids formed discrete nests of tubules that could be clearly discerned from surrounding, non-kidney cells with standard microscopes. This contrasts with other differentiation protocols in which the entire culture, including both kidney and non-kidney cells, is dissociated and re-aggregated into a three-dimensional pellet of arbitrary size, also called a kidney organoid (Morizane et al., 2015; Taguchi et al., 2014; Takasato et al., 2015). We found that such dissociation and replating steps were unnecessary for kidney organoid generation, and instead resulted in dramatically fewer and smaller tubular structures (Figure S1C–D). In addition, we previously established genetic models of polycystic kidney disease (PKD) and nephrotic syndrome in our adherent organoid cultures, making these organoids the natural starting point for HTS experiments focusing on disease (Cruz et al., 2017; Freedman et al., 2015; Kim et al., 2017).
Optimization of organoid differentiation with microwell plates
We used HTS organoid plates to quantitatively assess differentiation conditions and optimize their own production. As CHIR99021 has been applied at concentrations ranging from 5 to 12 µM in various kidney organoid differentiation protocols (Freedman et al., 2015; Lam et al., 2014; Mae et al., 2013; Morizane et al., 2015; Taguchi et al., 2014; Takasato et al., 2015), its dose dependence for organoid differentiation remains unclear. For the initial optimization, linear titrations of cell number were plated in 384-well kidney organoid plates and treated with three different concentrations of CHIR99021. On day 21 of differentiation, each well was fixed and stained for LTL and fully imaged using a high-content imager (15 min. per plate). We then trained a computer to automatically identify and analyze individual organoids based on the presence of proximal tubules (Figure S2A). Differentiation was robustly achieved at all three CHIR99021 concentrations and cell numbers, with 3,000 cells/well and 14 µM CHIR99021 producing the optimal number of organoids per well (Figure S2B).
We further utilized our organoid HTS platform to quantify the effect of CHIR99021 on organoid differentiation and substructure over a broader range of concentrations, ranging from 0 to 20 µM. For these experiments, the software for our IN Cell Analyzer (GE Healthcare) was adapted to recognize organoids as structures containing proximal tubules, distal tubules, and podocytes in close proximity, enabling analysis of these individual subcompartments within each organoid (Figure 2A and Figure S2C). Differentiation was quantified in three different subclones of WA09 hPSCs (Figure 2B). Each differentiated well of a 384-well plate typically contained ~ 10 organoids, representing ~ 50 nephron-like structures (Figure 2A–B and Figure S2C–D). These experiments revealed an ideal range of CHIR99021 concentrations capable of generating organoids (Figure 2B).
Figure 2. Utilization of organoid HTS plates to optimize differentiation.

(A) Representative well of a 384-well organoid plate (top row) robotically plated, differentiated, fixed, stained, imaged for proximal tubule (LTL), distal tubule (ECAD), and podocyte (NPHS1) segments. Magenta overlay (bottom row) shows automatically-identified structures over actual staining. Scale bar, 1 mm.
(B) Quantification of organoids/well in automated 384-well plates with increasing CHIR concentrations. Each box represents a single well. White boxes represent wells lost to fungal contamination. Z’ factors for organoid differentiation in the three lines were calculated to be 0.596 (Line 1), 0.034 (Line 2), and 0.285 (Line 3).
(C) Quantification of proximal tubules (green), distal tubules (yellow), and podocytes (red) at these different CHIR concentrations. Each condition shows the average of 32 wells (2 columns), and 14 µM shows the average of 64 wells. Conditions in which organoids did not differentiate efficiently (< 5 organoids total) were not included in the analysis and appear blank.
See also related Figure S2.
Surprisingly, the optimal CHIR99021 concentration varied significantly for each individual subclone, despite the fact that these were all derived from the same original hPSC line (Figure 2B). Z’ factor calculation indicated that line 1 was excellent for HTS and line 3 was acceptable (Figure 2B) (Zhang et al., 1999). The overall differentiation tendencies of the three individual subclones were found to be reproducible in multiple experiments, demonstrating that this was an inherent property of the subclones (Figure S2D). The optimal number of cells for the initial plating varied from ~ 1,000 to ~ 3,000, depending on the experiment, likely owing to stochastic differences between the cells from passage to passage (Figure S2D). When implanted into immunodeficient animals, each of these subclones formed large teratoma growths containing tissues from the three embryonic germ layers, demonstrating that they remained fully pluripotent (Figure S2E).
By performing quantitative image analysis with the IN Cell Analyzer, we further examined the proportion of each organoid that contained proximal tubules, distal tubules, or podocytes. These experiments revealed a tight correlation between the proportions of these three nephron segments throughout the active range of CHIR99021 concentrations (Figure 2C). A slight increase in the number of podocytes was observed in middle and high CHIR99021 concentrations, relative to the lowest doses (Figure 2C). Even at concentrations of CHIR99021 that produced very few organoids, the organoids that did form had similar proportions of the three nephron segments (Figure 2C). These experiments established a framework for using organoid plates to optimize and investigate differentiation conditions, revealing both dose-dependent and threshold effects.
Marker analysis reveals organoid segments in vitro
Characterization of organoids using specific markers is important to determine which cell types are present and how they compare to tissues in vivo. In contrast to many organoid culture systems that require special processing, our organoid microwell plates are adherent cultures that can be grown on glass, processed using standard techniques, and examined by confocal microscopy. We previously identified a variety of cell types within these cultures, including podocytes, proximal and distal tubules, endothelial cells, stromal myofibroblasts, and neurons (Cruz et al., 2017; Freedman et al., 2015; Kim et al., 2017). Using this approach, we further analyzed a panel of important markers whose localization patterns in kidney organoids remain poorly characterized, compared to human kidney tissues undergoing active nephrogenesis.
In both organoids and kidney tissues, proximal tubules exhibited strong LTL binding and weak ECAD expression, whereas distal tubules exhibited weak LTL binding and strong ECAD expression (Figure 3A–B and S3A–C). In contrast to LTL, which was expressed in both proximal and distal tubules, expression of cubilin (CUBN), a receptor important for nutrient and protein reabsorption, was sharply restricted to proximal tubules, localizing strongly to the apical membrane (Figure 3A–B and S3A–B). The cystic fibrosis transmembrane conductance regulator (CFTR) was detected in apical foci in both proximal and distal tubules, while the organic anion transporter (OAT1) localized to the basolateral membrane, similar to human kidney tissues in vivo (Figure 3A–B).
Figure 3. Microwell plates reveal detailed patterning of oranoids similar to tissues in vivo.

(A) Representative images of kidney organoids in microwell plates subjected to immunofluorescence analysis for segment-specific markers. Top row shows wide-field immunofluorescence image taken with a 4X objective. Middle row shows confocal image of the organoid highlighted above in the boxed region, taken with a 40X objective. Bottom row shows zoom of boxed region from middle row. ZO-1 (column 2) and CLDN1 (column 3) were labeled in the far red and red channels, respectively, in the same sample. Each of these is pseudocolored red and displayed separately to show co-localization with NPHS1 in the green.
(B) 40X images (top) with zoom (bottom) of the same marker combinations in developing kidneys. Arrowheads (CFTR and CLDN1) indicate specific patterns in organoids and tissues.
(C–D) Confocal images of organoids with progressive zooms, showing PEC-like marker expression in capsules surrounding podocytes, compared to human kidney tissue (right).
(E) Confocal images of collecting duct markers, counterstained with LTL, in organoids and tissues.
Scale bars, 100 µm. See also related Figure S3.
In the glomerular compartment, podocytes formed tightly clustered cell aggregates expressing NPHS1, synaptopodin, and WT1 (Figure 3A–B). We further investigated this compartment for parietal epithelial cells (PEC), an important cell type for kidney disease and regeneration (Shankland et al., 2017), which have not previously been identified in kidney organoids derived from hPSCs. In our multiwell organoids, we detected a population of cells adjacent to podocytes expressing CLDN1 and PAX8, markers that were absent in podocytes and were expressed by PEC in vivo (Figure 3A–B). In a subpopulation of organoid structures, these CLDN1+PAX8+ cells surrounded the podocyte clusters in a lining one single-cell layer thick (Figure 3C). These cells were positioned between the proximal tubular cells (LTL+) and the podocytes (podocalyxin+), but did not bind LTL (Figure 3C–D). These structures and marker expression patterns were reminiscent of the PEC layer of Bowman’s capsule in vivo (Figure 3C–D).
In contrast to these proximal nephron segments, collecting ducts were not detected in organoids with two distinct segment-specific markers, Dolichus bifloris agglutinin (DBA), and aquaporin-2 (AQP2) (Figure 3E). These markers successfully distinguished ducts from tubules in developing kidney tissues (Figure 3E). These careful analyses of organoids versus tissues revealed more nuanced expression of nephron compartment markers than previously appreciated.
Enhancement of endothelial differentiation in HTS organoids
The vasculature is a critical component of all somatic organs, with essential functions in physiology and disease. Organoid cultures derived from hPSCs lack mature vascular networks, but can contain subpopulations of endothelial cells (EC), which form linear chains of cells in contact with the organoids (Freedman et al., 2015; Takasato et al., 2015). As EC are typically a minor component in these cultures, we used kidney organoid microwells to optimize the differentiation protocol to increase EC (Figure 4A). We discovered that addition of vascular endothelial growth factor (VEGF) during the differentiation process resulted in an approximately ten-fold increase in EC expressing CD31 and VE-cadherin, without compromising the formation of the organoids (Figure 4B–E). These EC resembled those obtained in an EC directed differentiation protocol (Figure 4E) (Palpant et al., 2017). Despite their increased numbers, EC did not invade the podocytes to establish a bona fide glomerular basement membrane (Figure 4F). Thus, increase in EC alone was insufficient to induce glomerulus formation in vitro, suggesting a requirement for additional cues such as specific extracellular matrix isoforms (Abrahamson et al., 2013), or a more specific EC population.
Figure 4. Optimization of vascularization in organoids.

(A) Schematic of differentiation protocol used for vascular optimization.
(B) One well of a 96-well organoid plate treated with 100 ng/ml VEGF, showing podocytes (SYNPO), proximal tubules (LTL), and EC (CD31) by wide-field immunofluorescence.
(C) Wide-field images of VE-cadherin immunofluorescence in organoid cultures ± VEGF (left) or EC-directed cultures (right).
(D) Percentage of the total culture area occupied by cells expressing VE-cadherin, averaged from four representative experiments, or (E) expressing CD31, averaged from two additional representative experiments (± stderr).
(F) Confocal optical sections showing EC (CD31+) in optimized organoids, compared to human kidney sections.
Scale bars, 200 µm.
Single cell RNA sequencing reveals spectrum of organoid maturation states
We further performed and analyzed single cell RNA sequencing (scRNA-seq) to reveal gene expression signatures of individual cell types within our inherently heterogeneous organoids. Unsupervised clustering analysis of transcriptomes from 10,535 cells revealed a total of sixteen cell clusters, as visualized in t-distributed stochastic neighbor embedding (t-SNE) plots (Figure 5A and S4A–D). Six of these clusters were identified as kidney or EC lineages, based on comparison to gene lists of scRNA-seq clusters generated from developing human kidneys or newborn mouse kidneys (Figure 5A–B) (Adam et al., 2017; Menon et al., 2018). These included (1) proximal tubules, (2) podocytes, (3) ‘early tubules’ expressing signatures of both proximal and distal tubules and collecting ducts, (4) ‘early podocytes’ expressing signatures of both podocytes and PEC, (5) EC and (6) stromal cells (Figure 5A–B). Collectively, these six clusters comprised ~ 60 % of all cells analyzed by Drop-seq. The remaining ten clusters included neural, muscle, reproductive/endocrine, epithelial, undifferentiated, and proliferating cells, whereas a distinct population of collecting ducts was not identified (Figure S4A–D). Similarly, specific markers of collecting duct principal and intercalated cells were not detected in bulk RNA-seq analysis (Figure S4E).
Figure 5. Single cell RNA sequencing reveals that enhanced organoids contain epithelial and endothelial cell types analagous to developing human kidneys.

(A) t-SNE plot showing cell populations in kidney organoids, identified by clustering similar single cell transcriptomes.
(B) Top differentially expressed genes (DEG) within cells of these clusters compared to other cell clusters. All genes are present in corresponding developing human kidney (DHK) cell clusters, and bold if also in P1 mouse kidney cell clusters of same lineage.
(C) Correlation matrix comparing average gene expression of kidney organoid and DHK cell clusters.
(D) Violin plots of genes-of-interest within these cell clusters.
(E) Overlay t-SNE plots from 4 individual datasets ± VEGF differentiation. Inset highlights mature endothelial cell cluster. Data representative of 3 experimental replicates.
(F) t-SNE plot and (G) top differentially expressed genes of cells in subclusters of Stromal cluster from (A). Dotted line around subcluster S4 (F, H, I) highlights cells only detected with VEGF treatment.
(H) Overlay t-SNE plots of Stromal subclusters (F) for 4 individual datasets ± VEGF differentiation, colored as in (E).
(I) Feature (t-SNE) plots highlighting MCAM expression in Stromal subclusters (F, H) relative to VEGF treatment.
(J) Representative wide-field immunofluorescent images of MCAM and CD31 in cells in organoid cultures ± VEGF. Scale bar, 500 µm.
Gene names not italicized for ease of viewing (B, D, G). See also related Figure S4.
Average gene expression within each of the six kidney-relevant organoid clusters correlated well with its corresponding kidney compartment in vivo (Figure 5C), based on comparison to scRNA-seq analysis of developing human kidneys (Menon et al., 2018). Notably, the EC cluster had a gene expression signature characteristic of EC including PECAM1 (CD31), CD34 and KDR, and the overall gene expression of the cluster was clearly different from the stromal cell clusters (Figure 5A–D). Relative to other cell clusters, an enhanced quantity of cells in the stromal cell cluster showed gene expression patterns characteristic of kidney interstitial myofibroblasts, pericytes, and mesangial cells (ACTA2, COL1A1, and TAGLN) (Brunskill et al., 2011; Daniel et al., 2012; Lin et al., 2008) (Figure 5D). While there was no distinct cell cluster for parietal cells, co-expression of CLDN1, PAX8, and NPHS1 within the early podocyte cell cluster suggested that it may contain developing PEC (Figure 5D).
As organoids included in this analysis were generated by treatment both with and without VEGF, we explored the contribution of cells to each cluster by each of the datasets (Figure 5E). Cells from each dataset were well dispersed within each cell cluster, confirming that organoids treated with VEGF generated a robust fraction of epithelial and stromal cells on par with organoids without VEGF treatment (Figure 5E). Although VEGF clearly increased the number of EC by immunofluorescence, relatively few EC were captured by scRNA-seq and only a modest increase in EC was observed (Figure 5E). In contrast, bulk RNA-seq analysis from replicate wells detected marked (4- to 12-fold) upregulation of EC markers including PECAM1, CD34, CDH5, and FLT1 after VEGF treatment, validating the immunofluorescence analyses (Figure S4F). The low abundance of EC detected by scRNA-seq suggested that either a spectrum of maturation states was present in the cultures, or that a substantial number of EC were lost or destroyed during the processing steps prior to sequencing of Drop-seq isolates. The first possibility was supported by detection of EMCN and ENG expression in cells in the stromal cluster (Figure S4G), both recently shown to be involved in angiogenesis (Jin et al., 2017; Park-Windhol et al., 2017; Sugden et al., 2017).
Subclustering of stromal cells further revealed a unique subpopulation, expressing the VEGF receptor FLT1, that arose specifically in VEGF-treated cultures, but was entirely absent in untreated controls (Figure 5F–I). MCAM, which was recently identified as a marker of EC progenitor cells within the developing kidneys (Halt et al., 2016), was strongly co-expressed within this subcluster (Figure 5F–I). In the presence of VEGF, MCAM+ cells accounted for ~9.5 % of cells within the six kidney clusters, or ~ 5 % of all cells (Figure 5G). In VEGF-treated cultures, MCAM protein was specifically expressed in CD31+ cells occupying large portions of the surface area, consistent with the identification of these cells as EC progenitors (Figure 5J). EC-specific growth receptors were detected at low levels by scRNA-seq, despite substantial expression of their ligands from neighboring cells (Figure S4H). Although FLT1 could be clearly detected by bulk RNA-seq, a method that involves less processing and increased sampling, it was difficult to detect by scRNA-seq (Figure S4F,H). Collectively, these findings suggest that while VEGF treatment greatly increases the number of EC progenitors in organoid cultures, only a small minority of these cells reaches a mature EC differentiation state similar to that found in vivo. Furthermore, a substantial number of EC may be lost during the scRNA-seq processing steps.
Organoid plates model kidney injury and disease
An important potential application for organoid-based microwell plates is to assess organ-specific toxicity and disease phenotypes using automated, HTS assays to predict safety and efficacy. In support of this approach, we first treated 384-well kidney organoid plates with increasing titrations of cis-diamineplatinum(II) dichloride (cisplatin), a chemotherapeutic with known nephrotoxic side effects (Freedman et al., 2015; Morizane et al., 2015; Pabla and Dong, 2008; Takasato et al., 2015). Using microscopy, we observed that cisplatin induced apoptosis and caused destruction to tubule organization in kidney organoids in a dose-dependent manner (Figure 6A and Movie 2). This loss in cell viability could also be detected using a sensitive, luminescence-based assay appropriate for microwell formats (Figure 6B). To extend this analysis to specific biomarkers, which are more sensitive than toxicity, we measured kidney injury molecule-1 (KIM-1) expression using an ELISA-based approach and succeeded in detecting high levels of expression at sub-lethal doses (Figure 6C). Expression of KIM-1 specifically in the injured organoids was furthermore confirmed by immunofluorescence (Figure 6D).
Figure 6. Organoid HTS plates model toxicity and disease phenotypes.

(A) Individual organoids treated with increasing cisplatin doses showing phase-contrast effects on tubular integrity, (B) quantification of cell survival, (C) KIM-1 expression detected by ELISA, and (D) KIM-1 immunofluorescence.
(E) Immunofluorescence images of a cyst formed in a 384-well plate from a kidney organoid with mutations disrupting the PKD2 gene.
(F) Phase-contrast images of organoids tubules with or without forskolin treatment.
(G) Quantification of cystogenesis induced by forskolin at increasing concentrations.
(H) Schematic of multi-dimensional data in HTS organoids. Each position represents a different treatment condition. A positive hit showing normal differentiation, low toxicity, and high efficacy (phenotypic rescue) is highlighted with an asterisk in the efficacy dataset.
Scale bars, 100 µm. Error bars, s.d. *, p < 0.05 (n = 3 or more experiments).
We further investigated the potential of organoids in HTS formats to model genetic disease. Cyst formation is a common endpoint in many different kidney diseases, including the most common genetic cause of kidney failure, polycystic kidney disease (PKD). Gene-edited kidney organoids with mutations in polycystin-1 or polycystin-2, loss of which causes PKD, produced cysts from kidney tubules in automated, 384-well cultures (Figure 6E), similar to our findings in larger format wells (Freedman et al., 2015). To test the ability of organoids to respond physiologically to chemical stimuli, we treated them with forskolin, which induces swelling by activating chloride channels such as CFTR. Forskolin treatment resulted in cystic swelling of HTS kidney organoid tubules in a dose-dependent manner (Figure 6F–G) (Cruz et al., 2017). These assays established a technological framework for assessing the effect of chemical or genetic treatments on organoids, to distinguish true therapeutic efficacy from differentiation- or toxicity-induced false positives or false negatives in HTS experiments (Figure 6H).
Screening reveals an unexpected role for myosin in organoid PKD
To test whether our HTS organoid platform could provide insights into disease, we performed a small-scale screen to identify modifiers of PKD. We focused on eight candidate factors that might modulate interaction of cells with their surrounding microenvironment, which we have recently discovered to be important in organoid PKD (Cruz et al., 2017). HTS organoids derived from gene-edited hPSCs with mutations in polycystin-1 were treated on the 21st day of differentiation, a time point at which cysts had not yet formed, and maintained in the presence of each compound for seven days. In most of the treatment conditions, cyst formation generally ranged from ~ 5 % to 20 % of organoids, with no compound showing a dose-dependent decrease in cystogenesis. Interestingly, however, blebbistatin, a specific inhibitor of non-muscle myosin II, or NMII (Straight et al., 2003), induced a significant increase in cyst formation at the highest concentration, 12.5 µM (Figure 7A). This was unexpected, as the myosin pathway is not known to be involved in PKD.
Figure 7. Screening reveals blebbistatin increases PKD organoid cystogenesis.

(A) Cyst formation (% of cyst/organoid) from PKD organoids cultured in 96-well and treated with different compounds. Gradient triangles represent the increasing doses used for each compound. BSP, bone sialoprotein; Vitr., Vitronectin.
(B) Representative images of untreated and blebbistatin-treated PKD organoids in suspension. Arrowheads indicate cysts.
(C) Cyst quantification 3 days after blebbistatin treatment in suspension culture (n = 4 separate experiments, ≥ 15 organoids, ± s.e.m., p=0.0002). The difference between blebbistatin treated and untreated is shown ( Δ cyst / organoid).
(D) Cyst diameters after 7 days of blebbistatin treatment in suspension culture from 4 separate experiments pooled together. Each square represents a cyst (control +blebb., n=10; PKD -blebb., n=24; PKD +blebb., n= 118; ± s.e.m., p<0.0001).
(E) Representative images and quantification of PKD cyst area after removal of blebbistatin (n=8 from 2 separate experiments, ± s.e.m.; d0 versus d3, p=0.0015). Drug was removed (d0) after 7 days of treatment. A representative organoid before and after washout is shown.
(F) Confocal immunofluorescence showing nephron segment markers in PKD organoid cysts (cy) induced with blebbistatin. LTL was used for labelling proximal tubules, ECAD for distal tubules, NPHS1 for podocytes and DAPI for DNA.
(G) Representative confocal images showing NMIIB expression in PKD organoids. Proximal, LTL; DNA, DAPI. Arrowhead, non-cystic tubules.
Scale bars, 200 µm. See also related Figure S5.
To validate this finding, we added blebbistatin to organoids in low-throughput suspension cultures, a condition that promotes robust cystogenesis from PKD organoids over the course of ~ 14 days (Cruz et al., 2017). In blebbistatin-treated suspension cultures, PKD organoids formed cysts after only 24 hours, which continued to increase dramatically in diameter over the next week (Figure 7B). In contrast to nephrotoxic compounds such as cisplatin, we observed no damage to organoids with blebbistatin treatment at this concentration and time frame (Figure 7B). The rapid growth and expansion of blebbistatin-induced cysts suggested that they remained proliferative (Figure 7B), similar to PKD cysts without blebbistatin (Cruz et al., 2017). Blebbistatin increased the rate of cystogenesis ~ 40 % in PKD organoids, but only ~ 10 % in control organoids of identical genetic background that lacked PKD mutations (Figure 7C). Both the diameter and number of cysts were increased in blebbistatin-treated PKD organoids, compared to other conditions (Figure 7D). When blebbistatin was removed from these cultures, cyst size declined, indicating that blebbistatin’s effects were partially reversible and dependent upon sustained treatment with the drug (Figure 7E). Immunofluorescence analysis indicated that blebbistatin-induced cysts arose from proximal and distal tubular epithelial cells, but not from podocytes (Figures 7F and S5A). Non-muscle myosin IIB (NMIIB) was expressed much more strongly within these cyst-lining epithelial cells than in non-cystic LTL+ tubular structures located inside the same organoids (Figure 7G and S5B). Collectively, these findings suggested that inhibition of NMII promoted cystogenesis in PKD organoids.
DISCUSSION
Organoid cultures have significant advantages for HTS, including human species-specificity, regenerative applications, and the ability to model complex phenotypes, but have been limited to lineages with robust, self-renewing stem cells, such as intestinal crypt cells or mammary tumors (Gracz et al., 2015; Sachs et al., 2017). To our knowledge, hPSC-derived organoids have not previously been generated in automated, HTS-compatible formats. Although our work has focused on mini-kidney organoid differentiation as a representative lineage, it is likely that the same general techniques could be adapted to produce other types of organoids from hPSCs, such as mini-guts and mini-brains (Hayashi et al., 2016; McCracken et al., 2014; Spence et al., 2011). Importantly, all steps of differentiation, processing, imaging, and analysis can be performed automatically, using conventional cell culture robots or by hand.
Using this system, we have shown that hPSC-derived organoids in HTS formats can be experimentally manipulated to enhance and optimize their own differentiation. A threshold concentration of CHIR99021 is required to induce kidney lineage differentiation, above which organoids form with similar subcompartment composition. Surprisingly, this induction threshold varies significantly between individual hPSC lines of identical genetic background. These organoids can be processed in multiplex fashion using low liquid volumes to identify previously-unidentified cell types or subcompartments, such as parietal epithelial cells (PEC). scRNA-seq provides an unbiased mechanism to further assess our differentiation protocol, allowing us to confirm our immunostaining results and show that many of the cell types generated in our hPSC-derived organoids are indeed similar to those found in human kidneys during development.
One limitation of this work is that current organoid protocols produce fetal nephrons in which the tubules and vasculature are not fully mature (Freedman et al., 2015; Morizane et al., 2015; Taguchi et al., 2014; Takasato et al., 2015). This is most evident from our scRNA-seq analysis, which reveals significant clusters of ‘early’ tubular cells and ‘early’ podocytes, which are distinct from the more mature examples of these cell types. We demonstrate that the number of EC can be greatly increased in organoids by VEGF supplementation, a step towards vascularization that may be generalizable to other types of organoids derived from hPSCs. Many of these EC are not yet fully mature, similar to the epithelial cells within these organoid cultures. Future HTS screening, complemented with unbiased scRNA-seq, may identify additional factors that push these cells to mature into podocytes, proximal tubules, and EC, to promote more sophisticated architectures such as glomerular basement membranes. Notably, vascularization alone is insufficient to produce fully functioning kidneys from developing metanephroi transplanted in vivo, underscoring the need for HTS optimization of maturation state and purity to produce functional, engraftable stem cell populations (Dekel et al., 2003; Harari-Steinberg et al., 2013).
The combination of hPSCs and HTS has great potential for reducing costs and increasing success rates of clinical drug development (Grskovic et al., 2011). Our work builds upon previous platforms in vitro using primary or hPSC-derived epithelial cells types for toxicity or disease modeling (Astashkina et al., 2012; Huang et al., 2015; Kandasamy et al., 2015; Ramm et al., 2016; Rinkevich et al., 2014). Our system is unique, however, in that it combines automated, HTS-compatible formats with complex, hPSC-derived organoids, which are self-organizing, highly complex, and include cell types that are challenging to cultivate from primary cultures (Freedman et al., 2015; Morizane et al., 2015; Taguchi et al., 2014; Takasato et al., 2015). hPSC-derived organoids in HTS formats efficiently model tissue-specific toxicity and disease phenotypes, such as KIM-1 expression and cyst formation. In combination with careful analysis of differentiation on a well-to-well basis, these techniques will enable proper interpretation of library-scale drug discovery experiments and ‘clinical trials in a dish’ in large cohorts representing diverse patient populations (Doulatov et al., 2017; Huang et al., 2015; Sachs et al., 2017; Yang et al., 2013).
Despite many years of research, the molecular functions of the polycystin proteins remain enigmatic, which has hampered the development of targeted therapies for PKD. Applying our HTS platform, we have identified blebbistatin, an inhibitor of NMII ATPase activity, as a specific activator of PKD cystogenesis in organoids. This suggests that the polycystins may normally function to positively regulate actomyosin activation within the tubular epithelium, strengthening and tightening the tubule and preventing it from deforming into a cyst. Actomyosin is known to play important roles in epithelial cell-cell adhesion at adherens junctions, tight junctions, and focal adhesions, including the formation of purse-string-like contractile rings (Conti et al., 2004; Vicente-Manzanares et al., 2009). During normal kidney development, myosin similarly promotes the proper elongation of nephron tubules (Lienkamp et al., 2012). In addition to epithelial cells, stromal myofibroblasts could also be affected by blebbistatin, as these constitute a significant subpopulation within organoids by scRNA-seq, and can be associated with PKD cysts (Cruz et al., 2017). Interestingly, recent work has identified a possible myosin heavy chain-like, calmodulin-binding domain at the carboxyl terminus of polycystin-1, which could potentially regulate myosin (Doerr et al., 2016). The precise mechanism whereby myosin and PKD pathways interact is an interesting area for future investigation, which may provide directions for therapy development. HTS organoids thus provide a screening tool to catalyze discoveries, which can be further evaluated in lower-throughput systems in vivo such as mouse models and human clinical trials.
In conclusion, we have produced organoid plates from hPSCs in microwell formats capable of modeling complex human differentiation and disease states. These organoid plates bridge the gap between HTS-compatible experimental models, such as 2D cell lines and recombinant proteins, and low-throughput models, such as rodents. This balance of complexity and high-throughput, coupled with their inherent species-specificity, provides an attractive starting point for screening approaches focusing on therapeutic discovery, toxicology, and regenerative medicine.
STAR METHODS
CONTACT FOR REAGENT AND RESOURCE SHARING
Further information and requests for resources and reagents should be directed to and will be fulfilled by the Lead Contact, Benjamin Freedman (benof@uw.edu).
EXPERIMENTAL MODEL AND SUBJECT DETAILS
Human studies were performed with informed consent under the auspices of the University of Washington IRB. Studies with human pluripotent stem cells were performed with approval by the University of Washington ESCRO. WA09 (H9) female embryonic stem cells (WiCell) or WTC11 iPSCs derived from a Japanese male donor (gift of Dr. Bruce Conklin, Gladstone Institute) were maintained in 6-well tissue-culture treated dishes (Falcon) at 37 degrees using feeder-free on 3 % Reduced Growth Factor GelTrex (Life Technologies) in 2mL mTeSR1 (Stem Cell Technologies). Experiments in mice were performed in compliance with the strict ethical requirements and regulations of the UW IACUC under a pre-approved animal protocol. A colony of NOD.CB17-Prkdcscid/J mice (NOD-scid, Jackson Laboratory) was maintained under specific pathogen free conditions. Littermate animals of equally mixed genders and 6 weeks of age were used for all experiments.
METHOD DETAILS
Kidney differentiation in microwell plates
hPSCs were dissociated with Accutase (Stem Cell Technologies) and plated onto microwell plates pre-coated with GelTrex in mTeSR1 supplemented with 10 µM Rho-kinase inhibitor Y27632 (StemGent). The media was replaced with mTeSR1 + 1.5 % GelTrex at 16 hours, 12 µM CHIR99021 in Advanced RPMI + Glutamax (Life Technologies) at 60 hours, and RB (Advanced RPMI + Glutamax + B27 Supplement, from Life Technologies) at 96 hours. Volumes used are as follows: 500 uL for 24-well plates, 100 uL for 96-well plates, and 50 uL for 384-well plates. RB was changed two days later and every three days thereafter. For experiments involving modulation of ECs media was supplemented with VEGF165 (Peprotech, 12.5 to 200 ng/ml). Alternatively (Protocol B, Figure S1A), the protocol described by Takasato et al. was adapted for adherent culture: undifferentiated hPSCs were plated overnight and treated the following morning with 8 µM CHIR99021 in APEL media (StemCell Technologies) for 48–72 hr, 30 ng/ml FGF9 (Peprotech) + 1µg/ml heparin (StemCellTechnologies) in APEL for 96 hr, and cultured thereafter in APEL, replaced every three days. Alternatively, to generate endothelial cells without kidney organoids, 100,000 hPSCs/cm2 were plated in mTeSR1 + 10 µM Y27632 + 1 µM CHIR99021, replaced with RPMI + B27 minus insulin + 1.5% Geltrex + 50 ng/mL Activin A (R&D) at 24h, RPMI + B27 minus insulin + 40 ng/mL BMP4 (Peprotech) + 1 µL CHIR99021 at 61 h, and StemPro 34 (Thermo Fisher Scientific) + 2 mM Glutamax + 50 µg/mL ascorbic acid (Sigma) + 10 ng/mL BMP4 + 5 ng/mL bFGF (Peprotech) + 300 ng/mL VEGF165 at 85 h for a 72-hour incubation. Robotic instrumentation consisted of a BioMek el406 plate washer with microplate stacker from Beckman-Coulter Matrix Technologies, WellMate Dispenser and Stacker and a CyBio CyBi-Well Vario Workstation which allows dispensing of small amounts of reagents, cells, and compounds. Manual instrumentation consisted of Integra Voyager and Viaflo II electronic multichannel pipets.
Teratoma formation
Dissociated hPSCs (400,000/well) were plated in three wells of a 6-well plate and grown to confluence in mTeSR1 for six days. Cells were dissociated, pelleted, resuspended in 500 µl of an ice-cold 1:1 mixture of DMEM/F12 (Fisher) and Matrigel (Corning). The cells were immediately injected beneath the neck scruff of immunodeficient, NOD-scid mice using a 22-gauge syringe needle. Growths were harvested 15 weeks after injection, photographed, fixed in methacarn (60 % methanol, 30 % chloroform, 10 % acetic acid, all from Sigma), embedded in paraffin, sectioned, and stained with hematoxylin and eosin for histological analysis.
Immunohistochemistry
For confocal microscopy, kidney organoids were differentiated on 96-well No, 1.5 coverslip glass-bottom plates (Mat-Tek). To fix, an equal volume of 8 % paraformaldehyde (Electron Microscopy Sciences) was added to the culture media (4 % final concentration) for 15 minutes at room temperature. After fixing, samples were washed in PBS, blocked in 5 % donkey serum (Millipore)/0.3 % Triton-X-100/PBS, incubated overnight in 3 % bovine serum albumin/PBS with primary antibodies, washed, incubated overnight with Alexa-Fluor secondary antibodies and DAPI (Invitrogen), and washed in PBS. Primary antibodies included ZO-1 (339100; Invitrogen), PAX8 (10336-1-AP, Proteintech), NPHS1 (AF4269, R&D), OAT1 (PA6-26244, Thermo Fisher), CLDN-1 (ab15098, Abcam), SYNPO (sc-21537; Santa Cruz), E-CAD (ab11512, Abcam), WT1 (sc-192; Santa Cruz), CFTR (570 antibody; University of North Carolina), Myosin IIB (3404S, Cell Signaling), CUBN (gift of Dr. Dennis Brown, Massachusetts General Hospital), AQP2 (HPA046834, Sigma), CD144/VE-cadherin (2500T, Cell Signaling), CD146/MCAM (ab75769, Abcam), and CD31/PECAM (555444; BD). LTL (FL-1321, Vector Laboratories) and DBA (B-1035, Vector Laboratories) were similarly applied. Fluorescence images were captured using an inverted Nikon epifluorescence Eclipse Ti or A1R confocal microscope. Automated imaging was performed using a GE INCELL 2000 Analyzer.
Automated organoid optimization and analysis
Organoids were produced in a fully-automated manner and developed to an age of 25 days, then fixed and stained with NPHS1, LTL, and ECAD to mark podocytes, proximal tubules, and distal tubules respectively. Each well was imaged at a standardized exposure using an In Cell Analyzer 2000 (GE Healthcare). Representative images were collected using the GE INCELL investigator suite. An algorithm was then generated using the INCELL developer suite to accurately identify each population of cells while simultaneously excluding background fluorescence. We used this algorithm to count and measure the cell populations in each well, as well as across dosages of CHIR99021. These results were displayed using the Spotfire software (TIBCO) with the definition of an organoid as being a discrete group of cells that contains overlapping staining for podocytes, proximal tubule and distal tubule. To assess nephrotoxicity, organoids were purified manually and subjected to a dose titration of cisplatin (Sigma) for 24 hours in 96-well plates. Organoids were imaged and then fixed for immunofluorescence, or alternatively lysed and a KIM-1 ELISA (MesoScale Discovery) was performed. Organoid viability was assessed with CellTiter-Glo (Promega) and quantified using a PerkinElmer Envision plate reader.
Cyst generation
PKD1−/− and PKD2−/− hPSCs or isogenic controls (all generated previously by our lab) were differentiated in microwell plates in adherent cultures. Forskolin (Sigma) was added to microwell plates during automated liquid handling on the 21st day after differentiation. Large swellings rapidly developed and grew to full size over 72 hours. Cysts were identified by comparing images with captured with high-content imaging prior to forskolin treatment, and after 72 hours. Screening of PKD cystogenesis was performed in duplicate in 96-well plates to provide sufficient space and numbers of organoids per well. Factors were plated at four different concentrations for seven days, and the organoids were scanned visually on a phase-contrast microscope for increased or decreased cyst formation. Factors included blebbistatin (Cayman Chemicals, used at 0.1 µM, 0.5 µM, 2.5 µM, 12.5 µM), gelatin (StemCell Technologies, used at 0.1 µM, 0.µM, 2.5 µM, 12.5 µM), collagenase type IV (StemCell Technologies, used at 0.1 µM, 0.µM, 2.5 µM, 12.5 µM), GM 6001 (Cayman Chemicals, used at 0.1 µM, 0.5 µM, 2.5 µM, 12.5 µM), synthetic peptide derived from Vitronectin (kindly provided by Cole DeForest at UW Chemical Engineering, used at 10 µM, 50 µM, 250 µM, 1.25 mM), synthetic peptide derived from bone sialoprotein (kindly provided by Cole DeForest at UW Chemical Engineering, used at 10 µM, 50 µM, 250 µM, 1.25 mM), synthetic RGD peptide (kindly provided by Cole DeForest at UW Chemical Engineering, used at 10 µM, 50 µM, 250 µM, 1.25 mM), rMMP8, human (kindly provided by Cole DeForest at UW Chemical Engineering, used at 30 µg/ml, 6 µg/ml, 1.2 µg/ml, 0.24 µg/ml). To test cystogenesis in suspension, adherent organoids were microdissected with a 23-gauge syringe needle from 24-well plates on an inverted phase-contrast microscope, and transferred into a low-adhesion 6-well plate (Corning) containing 2 mL RB or 2mL RB with 12.5 µM blebbistatin. Organoids were imaged daily on a Nikon Ti Inverted Widefield microscope for a period of 7 days. Cyst diameters were measured using NIS Elements imaging software (Nikon).
scRNA-seq and cell clustering analysis
Organoids were collected by scraping cells from whole wells into ice-cold DPBS, dissociated with cold activate protease, and Drop-seq was performed as on an Illumina HiSeq 2500 in rapid run mode. Sequences were aligned to NCBI human genome assembly GRCh38, with 70–80% overall alignment. Organoid differentiation was performed from WA09 hPSCs (WiCell, Madison WI) in 24-well plates to provide sufficient cells for analysis. Unsupervised cell clustering, principal components analysis and data presentation were performed with the following modifications/specifics: datasets from Drop-seq analyses of individual wells were combined and batch corrected. Unsupervised subclustering was performed following supervised selection of stromal cells from the initial clustering analysis. Cells were excluded if genes expressed were < 500 or ≥ 4000 (to exclude cell doublets) or if mitochondrial gene expression was > 25% all genes (to exclude non-healthy cells). Publicly available data were used for cell type identification and gene expression comparison: GUDMAP (www.gudmap.org), GenePaint (www.genepaint.org), ESBK's Kidney Systems Biology Project's transcriptomic data (https://hpcwebapps.cit.nih.gov/ESBL/Database/), Gene Expression Omnibus accession number GSE94333, and KeyGenes (www.keygenes.nl). A correlation matrix comparing average gene expression in organoid and human kidney clusters was generated using Stats R-package, based on GSE94333. Unless otherwise noted, “top differentially expressed genes” were chosen from top 20 for each organoid cell cluster, based on their appearance in scRNA-seq data from human developing kidney (corresponding clusters) and mouse P1 kidney (clusters of same lineage). Genes were listed in order of statistical significance with highest p-value for last gene generated based on the number of cells in the cluster. scRNA-seq samples were deposited in the Gene Expression Omnibus (NCBI) under accession number GSE109718.
Bulk RNA sequencing
Cells from organoid cultures grown in parallel for scRNA-seq (+ and - VEGF treatment) were lysed with TRIzol Reagent (Invitrogen). Total RNA was isolated using Direct-zol mini prep RNA columns (Zymo Research) with on-column DNase treatment. RNA quality was assessed by Bioanalyzer 2100platform (Agilent) using a Eukaryote Total RNA Nano array (Agilent), with RIN values of 9.7 and 9.5 for VEGF + and - samples, respectively. cDNA was generated from 10 ng RNA using the SMART-Seq Low Input RNA kit for sequencing (Takara) applying 8 PCR cycles. Amplified cDNA was purified by Agencourt AMPure XP DNA purification kit (Beckman Coulter) and analyzed on the Bioanalyzer platform using a High Sensitivity DNA array (Agilent). Next-generation sequencing libraries were generated and barcoded using the Nextera XT DNA Library Preparation Kit (Illumina) starting with 100 pg cDNA. cDNA libraries were pooled and sequenced on one lane of a HiSeq500 platform with Illumina TruSeq v4 chemistry (paired-end 2×75 cycles) at the University of Michigan DNA Sequencing Core. Resulting sequences were aligned to human genome (Ensembl GRCh38) using STAR (version 2.5.2) with default parameters. Relative read counts at gene level were estimated using HTSeq (version 2.20.2 and normalized using quantile normalization function in edgeR R statistical package. A total number of 52 and 76 million reads were obtained with alignment rates of 91% and 88 % from VEGF + and – samples, respectively.
QUANTIFICATION AND STATISTICAL ANALYSIS
Data summaries shown in the figures are representative of three or more separate experiments (biological replicates). Statistical significance was calculated with Graphpad Prism software. For comparisons between two groups, a two-tailed student’s t test for samples with unequal variance (heteroscedastic) was utilized. For comparisons between multiple groups, the analysis of variance (ANOVA) method was used. Z’ factor was calculated based on standard deviation as described (Zhang et al., 1999) to assess high throughput assay quality. The Z’ factor calculation provides a quantitative measure of the separation between our control (no CHIR99021) condition and the optimal differentiation condition for each line. A Z’ factor >0.5 indicates an excellent assay (Zhang et al., 1999).
DATA AND SOFTWARE AVAILABILITY
scRNA-seq samples were deposited in the Gene Expression Omnibus (NCBI) under accession number GSE109718. CHIR99021 titration data is provided in Mendeley Data, doi:10.17632/988tyf4fh8.1.
Supplementary Material
Progressive zoom-in showing multiple wells of a 384-well plate, each containing numerous organoids labeled for proximal tubules (LTL, green), distal tubules (ECAD, yellow), and podocytes (NPHS1, red). The plate shown is distinct from the one shown in Figure 1D.
Time-lapse imaging of kidney organoids in adherent cultures starting 16 hours after initial treatment with 50 µM cisplatin. During the subsequent 24 hours, the organoid tubules (center and upper left) disintegrate and disappear from view.
KEY RESOURCES TABLE
| REAGENT or RESOURCE | SOURCE | IDENTIFIER |
|---|---|---|
| Antibodies | ||
| Fluorescein Lotus tetragonolobus Lectin | Vector Labs | FL-1321; RRID:AB_2336559 |
| Rat Anti-Human E-Cadherin antibody [DECMA-1] | Abcam | Ab11512; RRID:AB_298118 |
| Sheep Anti-Human Nephrin (NPHS1) | R&D Systems | AF4269; RRID:AB_2154851 |
| Mouse Anti-Human ZO-1 antibody | Invitrogen | 339100; RRID:AB_2533147 |
| Mouse Anti-Human CD31 | BD BIosciences | 555444; RRID:AB_395837 |
| Bacterial and Virus Strains | ||
| Biological Samples | ||
| Developing kidney tissue (days 60–130) | Laboratory of Developmental Biology (University of Washington) | 26805, 26846, 26847, 26848 |
| Chemicals, Peptides, and Recombinant Proteins | ||
| GSK-3β inhibitor CHIR99021 | StemGent | 04-0004-10; CAS 252917-06-9 |
| Rho-kinase inhibitor Y27632 | StemGent | 04-0012; CAS 146986-50-7 |
| Cisplatin | Sigma | 1134357; CAS 15663-21-1 |
| Forskolin | LC Laboratories | FF-9929; CAS 66575-29-9 |
| Recombinant human VEGF165 | Peprotech | 100–20 |
| Critical Commercial Assays | ||
| CellTiter-Glo | Promega | G75070 |
| Kidney Injury Panel 3 Human Kit | Meso Scale Diagnostics | K15189D-1 |
| Deposited Data | ||
| scRNA-seq samples | This paper | GEO: GSE109718 |
| Human Developing Kidney scRNA-seq | Menon et al., 2018 | GEO: GSE109205 |
| CHIR99021 titration in 384-well plates of human pluripotent stem cells – analysis of nephron segment differentiation | This paper | Mendeley Data, doi:10.17632/988tyf4fh8.1 |
| Experimental Models: Cell Lines | ||
| WA09 (H9) human ES cells | WiCell | WAe009-A |
| WTC11 human iPS cells | Laboratory of Bruce Conklin, MD | GM25256; RRID:CVCL_Y803 |
| CRISPR-mutant PKD hPSC and isogenic controls | Freedman et al., 2015 Cruz et al., 2017 | PKD1−/− A3, F1, C6 PKD2−/− G4, 12 control 07, B4, B5, H1, H7 |
| Experimental Models: Organisms/Strains | ||
| NOD-scid mice (NOD.CB17-Prkdcscid/J) | Jackson Laboratory | RRID:IMSR_JAX:001303 |
| Oligonucleotides | ||
| Recombinant DNA | ||
| Software and Algorithms | ||
| GE INCELL Investigator/Developer | GE | http://gelifesciences.com |
| GraphPad Prism | GraphPad | http://graphpad.com |
| NIS Elements | Nikon | http://nikoninstruments.com |
| ImageJ | NIH | http://imagej.nih.gov |
| Other | ||
Highlights.
Liquid handling robots generate and analyze kidney organoids in microwell arrays
Single cell RNA-seq reveals organoid cell types recapitulate human kidney complexity
Growth factor addition greatly increases vascular endothelial cells in organoids
A phenotypic drug screen discovers a role for myosin in polycystic kidney disease
Acknowledgments
We thank Cristina Cebrián Ligero (UM) for sharing her analysis of human kidney gene expression; Cole DeForest and Chris Arakawa (UW) for samples of synthetic hydrogels; Noel Wys (UM), Ivan Gomez, Yuguo Wang, Ankita Roy, and Anna Lindsay (UW) for technical assistance; and Charles Murry, Tony Blau, Vincenzo Cirulli, Jessica E. Young, Ed Kelly, and David Beier (UW) for helpful discussions. Support was provided to: BSF by an American Society of Nephrology Carl W. Gottschalk Research Scholar Award, a PKD Foundation Research Award, a National Kidney Foundation Young Investigator Grant, and NIH K01DK102826; RTM as an investigator of the Howard Hughes Medical Institute; JH by NIH UH3TR000504, UG3TR002158, and an unrestricted gift from the Northwest Kidney Centers to the Kidney Research Institute; SJS by NIH R01DK097598, NAP by R00DK094873, MK by NIH U54DK083912, JLH by NIH K08DK089119, and HF by NIH K25HL135432. Experiments were performed utilizing the Quellos High-Throughput Screening Core, Ellison Stem Cell Core, Garvey Imaging Core (UW ISCRM), and DNA Sequencing Core (UM).
Footnotes
Publisher's Disclaimer: This is a PDF file of an unedited manuscript that has been accepted for publication. As a service to our customers we are providing this early version of the manuscript. The manuscript will undergo copyediting, typesetting, and review of the resulting proof before it is published in its final citable form. Please note that during the production process errors may be discovered which could affect the content, and all legal disclaimers that apply to the journal pertain.
AUTHOR CONTRIBUTIONS
SMC, NMC, JLH, RM, JA, EAO, REG, LVI, YKK, LMT, JWP, HF, NAP, and BSF performed experiments and analysis of human organoids and kidneys. SMC, NMC, JLH, RM, TJM, JWP, HF, MK, SJS, JH, RTM, NAP, and BSF designed the experiments. BSF wrote and JLH contributed to the draft of the manuscript. All authors revised the manuscript.
DECLARATION OF INTERESTS
The authors have no competing interests. BSF is an inventor on patent applications describing the differentiation and application of kidney organoids.
References
- Abrahamson DR, St John PL, Stroganova L, Zelenchuk A, Steenhard BM. Laminin and type IV collagen isoform substitutions occur in temporally and spatially distinct patterns in developing kidney glomerular basement membranes. J Histochem Cytochem. 2013;61:706–718. doi: 10.1369/0022155413501677. [DOI] [PMC free article] [PubMed] [Google Scholar]
- Adam M, Potter AS, Potter SS. Psychrophilic proteases dramatically reduce single-cell RNA-seq artifacts: a molecular atlas of kidney development. Development. 2017;144:3625–3632. doi: 10.1242/dev.151142. [DOI] [PMC free article] [PubMed] [Google Scholar]
- Astashkina AI, Mann BK, Prestwich GD, Grainger DW. A 3-D organoid kidney culture model engineered for high-throughput nephrotoxicity assays. Biomaterials. 2012;33:4700–4711. doi: 10.1016/j.biomaterials.2012.02.063. [DOI] [PubMed] [Google Scholar]
- Brunskill EW, Sequeira-Lopez ML, Pentz ES, Lin E, Yu J, Aronow BJ, Potter SS, Gomez RA. Genes that confer the identity of the renin cell. Journal of the American Society of Nephrology. 2011;22:2213–2225. doi: 10.1681/ASN.2011040401. [DOI] [PMC free article] [PubMed] [Google Scholar]
- Chen S, Borowiak M, Fox JL, Maehr R, Osafune K, Davidow L, Lam K, Peng LF, Schreiber SL, Rubin LL, et al. A small molecule that directs differentiation of human ESCs into the pancreatic lineage. Nature Chemical Biology. 2009;5:258–265. doi: 10.1038/nchembio.154. [DOI] [PubMed] [Google Scholar]
- Conti MA, Even-Ram S, Liu C, Yamada KM, Adelstein RS. Defects in cell adhesion and the visceral endoderm following ablation of nonmuscle myosin heavy chain II-A in mice. J Biol Chem. 2004;279:41263–41266. doi: 10.1074/jbc.C400352200. [DOI] [PubMed] [Google Scholar]
- Cruz NM, Song X, Czerniecki SM, Gulieva RE, Churchill AJ, Kim YK, Winston K, Tran LM, Diaz MA, Fu H, et al. Organoid cystogenesis reveals a critical role of microenvironment in human polycystic kidney disease. Nat Mat. 2017;16:1112–1119. doi: 10.1038/nmat4994. [DOI] [PMC free article] [PubMed] [Google Scholar]
- Daniel C, Ludke A, Wagner A, Todorov VT, Hohenstein B, Hugo C. Transgelin is a marker of repopulating mesangial cells after injury and promotes their proliferation and migration. Lab Invest. 2012;92:812–826. doi: 10.1038/labinvest.2012.63. [DOI] [PubMed] [Google Scholar]
- Dekel B, Burakova T, Arditti FD, Reich-Zeliger S, Milstein O, Aviel-Ronen S, Rechavi G, Friedman N, Kaminski N, Passwell JH, et al. Human and porcine early kidney precursors as a new source for transplantation. Nat Med. 2003;9:53–60. doi: 10.1038/nm812. [DOI] [PubMed] [Google Scholar]
- Dekkers JF, Wiegerinck CL, de Jonge HR, Bronsveld I, Janssens HM, de Winter-de Groot KM, Brandsma AM, de Jong NW, Bijvelds MJ, Scholte BJ, et al. A functional CFTR assay using primary cystic fibrosis intestinal organoids. Nat Med. 2013;19:939–945. doi: 10.1038/nm.3201. [DOI] [PubMed] [Google Scholar]
- Doerr N, Wang Y, Kipp KR, Liu G, Benza JJ, Pletnev V, Pavlov TS, Staruschenko A, Mohieldin AM, Takahashi M, et al. Regulation of Polycystin-1 Function by Calmodulin Binding. PLoS One. 2016;11:e0161525. doi: 10.1371/journal.pone.0161525. [DOI] [PMC free article] [PubMed] [Google Scholar]
- Doulatov S, Vo LT, Macari ER, Wahlster L, Kinney MA, Taylor AM, Barragan J, Gupta M, McGrath K, Lee HY, et al. Drug discovery for Diamond-Blackfan anemia using reprogrammed hematopoietic progenitors. Sci Transl Med. 2017;9 doi: 10.1126/scitranslmed.aah5645. [DOI] [PMC free article] [PubMed] [Google Scholar]
- Freedman BS, Brooks CR, Lam AQ, Fu H, Morizane R, Agrawal V, Saad AF, Li MK, Hughes MR, Werff RV, et al. Modelling kidney disease with CRISPR-mutant kidney organoids derived from human pluripotent epiblast spheroids. Nat Commun. 2015;6:8715. doi: 10.1038/ncomms9715. [DOI] [PMC free article] [PubMed] [Google Scholar]
- Gracz AD, Williamson IA, Roche KC, Johnston MJ, Wang F, Wang Y, Attayek PJ, Balowski J, Liu XF, Laurenza RJ, et al. A high-throughput platform for stem cell niche co-cultures and downstream gene expression analysis. Nat Cell Biol. 2015;17:340–349. doi: 10.1038/ncb3104. [DOI] [PMC free article] [PubMed] [Google Scholar]
- Grskovic M, Javaherian A, Strulovici B, Daley GQ. Induced pluripotent stem cells--opportunities for disease modelling and drug discovery. Nat Rev Drug Discov. 2011;10:915–929. doi: 10.1038/nrd3577. [DOI] [PubMed] [Google Scholar]
- Halt KJ, Parssinen HE, Junttila SM, Saarela U, Sims-Lucas S, Koivunen P, Myllyharju J, Quaggin S, Skovorodkin IN, Vainio SJ. CD146(+) cells are essential for kidney vasculature development. Kidney Int. 2016;90:311–324. doi: 10.1016/j.kint.2016.02.021. [DOI] [PubMed] [Google Scholar]
- Harari-Steinberg O, Metsuyanim S, Omer D, Gnatek Y, Gershon R, Pri-Chen S, Ozdemir DD, Lerenthal Y, Noiman T, Ben-Hur H, et al. Identification of human nephron progenitors capable of generation of kidney structures and functional repair of chronic renal disease. EMBO Mol Med. 2013;5:1556–1568. doi: 10.1002/emmm.201201584. [DOI] [PMC free article] [PubMed] [Google Scholar]
- Hayashi R, Ishikawa Y, Sasamoto Y, Katori R, Nomura N, Ichikawa T, Araki S, Soma T, Kawasaki S, Sekiguchi K, et al. Co-ordinated ocular development from human iPS cells and recovery of corneal function. Nature. 2016;531:376–380. doi: 10.1038/nature17000. [DOI] [PubMed] [Google Scholar]
- Huang L, Holtzinger A, Jagan I, BeGora M, Lohse I, Ngai N, Nostro C, Wang R, Muthuswamy LB, Crawford HC, et al. Ductal pancreatic cancer modeling and drug screening using human pluripotent stem cell- and patient-derived tumor organoids. Nat Med. 2015;21:1364–1371. doi: 10.1038/nm.3973. [DOI] [PMC free article] [PubMed] [Google Scholar]
- Jin Y, Muhl L, Burmakin M, Wang Y, Duchez AC, Betsholtz C, Arthur HM, Jakobsson L. Endoglin prevents vascular malformation by regulating flow-induced cell migration and specification through VEGFR2 signalling. Nat Cell Biol. 2017;19:639–652. doi: 10.1038/ncb3534. [DOI] [PMC free article] [PubMed] [Google Scholar]
- Kandasamy K, Chuah JK, Su R, Huang P, Eng KG, Xiong S, Li Y, Chia CS, Loo LH, Zink D. Prediction of drug-induced nephrotoxicity and injury mechanisms with human induced pluripotent stem cell-derived cells and machine learning methods. Sci Rep. 2015;5:12337. doi: 10.1038/srep12337. [DOI] [PMC free article] [PubMed] [Google Scholar]
- Kim YK, Refaeli I, Brooks CR, Jing P, Gulieva RE, Hughes MR, Cruz NM, Liu Y, Churchill AJ, Wang Y, et al. Gene-Edited Human Kidney Organoids Reveal Mechanisms of Disease in Podocyte Development. Stem Cells. 2017;35:2366–2378. doi: 10.1002/stem.2707. [DOI] [PMC free article] [PubMed] [Google Scholar]
- Lam AQ, Freedman BS, Morizane R, Lerou PH, Valerius MT, Bonventre JV. Rapid and efficient differentiation of human pluripotent stem cells into intermediate mesoderm that forms tubules expressing kidney proximal tubular markers. J Am Soc Nephrol. 2014;25:1211–1225. doi: 10.1681/ASN.2013080831. [DOI] [PMC free article] [PubMed] [Google Scholar]
- Lancaster MA, Renner M, Martin CA, Wenzel D, Bicknell LS, Hurles ME, Homfray T, Penninger JM, Jackson AP, Knoblich JA. Cerebral organoids model human brain development and microcephaly. Nature. 2013;501:373–379. doi: 10.1038/nature12517. [DOI] [PMC free article] [PubMed] [Google Scholar]
- Lienkamp SS, Liu K, Karner CM, Carroll TJ, Ronneberger O, Wallingford JB, Walz G. Vertebrate kidney tubules elongate using a planar cell polarity-dependent, rosette-based mechanism of convergent extension. Nat Genet. 2012;44:1382–1387. doi: 10.1038/ng.2452. [DOI] [PMC free article] [PubMed] [Google Scholar]
- Lin SL, Kisseleva T, Brenner DA, Duffield JS. Pericytes and perivascular fibroblasts are the primary source of collagen-producing cells in obstructive fibrosis of the kidney. Am J Pathol. 2008;173:1617–1627. doi: 10.2353/ajpath.2008.080433. [DOI] [PMC free article] [PubMed] [Google Scholar]
- Mae S, Shono A, Shiota F, Yasuno T, Kajiwara M, Gotoda-Nishimura N, Arai S, Sato-Otubo A, Toyoda T, Takahashi K, et al. Monitoring and robust induction of nephrogenic intermediate mesoderm from human pluripotent stem cells. Nat Commun. 2013;4:1367. doi: 10.1038/ncomms2378. [DOI] [PMC free article] [PubMed] [Google Scholar]
- Major MB, Roberts BS, Berndt JD, Marine S, Anastas J, Chung N, Ferrer M, Yi X, Stoick-Cooper CL, von Haller PD, et al. New regulators of Wnt/beta-catenin signaling revealed by integrative molecular screening. Sci Signal. 2008;1:ra12. doi: 10.1126/scisignal.2000037. [DOI] [PubMed] [Google Scholar]
- McCracken KW, Cata EM, Crawford CM, Sinagoga KL, Schumacher M, Rockich BE, Tsai YH, Mayhew CN, Spence JR, Zavros Y, et al. Modelling human development and disease in pluripotent stem-cell-derived gastric organoids. Nature. 2014;516:400–404. doi: 10.1038/nature13863. [DOI] [PMC free article] [PubMed] [Google Scholar]
- Menon R, Otto EA, Kokoruda A, Zhou J, Zhang Z, Yoon E, Chen Y-C, Troyanscaya O, Spence J, Kretzler M, et al. Single-cell analysis of progenitor cell dynamics and lineage specification of the human fetal kidney. bioRxiv. 2018 doi: 10.1242/dev.164038. [DOI] [PMC free article] [PubMed] [Google Scholar]
- Morizane R, Lam AQ, Freedman BS, Kishi S, Valerius MT, Bonventre JV. Nephron organoids derived from human pluripotent stem cells model kidney development and injury. Nat Biotechnol. 2015;33:1193–1200. doi: 10.1038/nbt.3392. [DOI] [PMC free article] [PubMed] [Google Scholar]
- Pabla N, Dong Z. Cisplatin nephrotoxicity: mechanisms and renoprotective strategies. Kidney Int. 2008;73:994–1007. doi: 10.1038/sj.ki.5002786. [DOI] [PubMed] [Google Scholar]
- Pagliuca FW, Millman JR, Gurtler M, Segel M, Van Dervort A, Ryu JH, Peterson QP, Greiner D, Melton DA. Generation of functional human pancreatic beta cells in vitro. Cell. 2014;159:428–439. doi: 10.1016/j.cell.2014.09.040. [DOI] [PMC free article] [PubMed] [Google Scholar]
- Palpant NJ, Pabon L, Friedman CE, Roberts M, Hadland B, Zaunbrecher RJ, Bernstein I, Zheng Y, Murry CE. Generating high-purity cardiac and endothelial derivatives from patterned mesoderm using human pluripotent stem cells. Nat Protoc. 2017;12:15–31. doi: 10.1038/nprot.2016.153. [DOI] [PMC free article] [PubMed] [Google Scholar]
- Park-Windhol C, Ng YS, Yang J, Primo V, Saint-Geniez M, D'Amore PA. Endomucin inhibits VEGF-induced endothelial cell migration, growth, and morphogenesis by modulating VEGFR2 signaling. Sci Rep. 2017;7:17138. doi: 10.1038/s41598-017-16852-x. [DOI] [PMC free article] [PubMed] [Google Scholar]
- Ramm S, Adler M, Vaidya VS. A High-Throughput Screening Assay to Identify Kidney Toxic Compounds. Current protocols in toxicology. 2016;69 doi: 10.1002/cptx.12. 9 10 11-19 10 26. [DOI] [PMC free article] [PubMed] [Google Scholar]
- Rinkevich Y, Montoro DT, Contreras-Trujillo H, Harari-Steinberg O, Newman AM, Tsai JM, Lim X, Van-Amerongen R, Bowman A, Januszyk M, et al. In vivo clonal analysis reveals lineage-restricted progenitor characteristics in mammalian kidney development, maintenance, and regeneration. Cell Rep. 2014;7:1270–1283. doi: 10.1016/j.celrep.2014.04.018. [DOI] [PMC free article] [PubMed] [Google Scholar]
- Sachs N, de Ligt J, Kopper O, Gogola E, Bounova G, Weeber F, Balgobind AV, Wind K, Gracanin A, Begthel H, et al. A Living Biobank of Breast Cancer Organoids Captures Disease Heterogeneity. Cell. 2017;172:373–386. doi: 10.1016/j.cell.2017.11.010. [DOI] [PubMed] [Google Scholar]
- Shankland SJ, Freedman BS, Pippin JW. Can podocytes be regenerated in adults? Curr Opin Nephrol Hypertens. 2017;26:154–164. doi: 10.1097/MNH.0000000000000311. [DOI] [PMC free article] [PubMed] [Google Scholar]
- Sharma A, Burridge PW, McKeithan WL, Serrano R, Shukla P, Sayed N, Churko JM, Kitani T, Wu H, Holmstrom A, et al. High-throughput screening of tyrosine kinase inhibitor cardiotoxicity with human induced pluripotent stem cells. Sci Transl Med. 2017;9 doi: 10.1126/scitranslmed.aaf2584. [DOI] [PMC free article] [PubMed] [Google Scholar]
- Spence JR, Mayhew CN, Rankin SA, Kuhar MF, Vallance JE, Tolle K, Hoskins EE, Kalinichenko VV, Wells SI, Zorn AM, et al. Directed differentiation of human pluripotent stem cells into intestinal tissue in vitro. Nature. 2011;470:105–109. doi: 10.1038/nature09691. [DOI] [PMC free article] [PubMed] [Google Scholar]
- Straight AF, Cheung A, Limouze J, Chen I, Westwood NJ, Sellers JR, Mitchison TJ. Dissecting temporal and spatial control of cytokinesis with a myosin II Inhibitor. Science. 2003;299:1743–1747. doi: 10.1126/science.1081412. [DOI] [PubMed] [Google Scholar]
- Sugden WW, Meissner R, Aegerter-Wilmsen T, Tsaryk R, Leonard EV, Bussmann J, Hamm MJ, Herzog W, Jin Y, Jakobsson L, et al. Endoglin controls blood vessel diameter through endothelial cell shape changes in response to haemodynamic cues. Nat Cell Biol. 2017;19:653–665. doi: 10.1038/ncb3528. [DOI] [PMC free article] [PubMed] [Google Scholar]
- Taguchi A, Kaku Y, Ohmori T, Sharmin S, Ogawa M, Sasaki H, Nishinakamura R. Redefining the in vivo origin of metanephric nephron progenitors enables generation of complex kidney structures from pluripotent stem cells. Cell Stem Cell. 2014;14:53–67. doi: 10.1016/j.stem.2013.11.010. [DOI] [PubMed] [Google Scholar]
- Takahashi K, Tanabe K, Ohnuki M, Narita M, Ichisaka T, Tomoda K, Yamanaka S. Induction of pluripotent stem cells from adult human fibroblasts by defined factors. Cell. 2007;131:861–872. doi: 10.1016/j.cell.2007.11.019. [DOI] [PubMed] [Google Scholar]
- Takasato M, Er PX, Chiu HS, Maier B, Baillie GJ, Ferguson C, Parton RG, Wolvetang EJ, Roost MS, Chuva de Sousa Lopes SM, et al. Kidney organoids from human iPS cells contain multiple lineages and model human nephrogenesis. Nature. 2015;526:564–568. doi: 10.1038/nature15695. [DOI] [PubMed] [Google Scholar]
- Thomson JA, Itskovitz-Eldor J, Shapiro SS, Waknitz MA, Swiergiel JJ, Marshall VS, Jones JM. Embryonic stem cell lines derived from human blastocysts. Science. 1998;282:1145–1147. doi: 10.1126/science.282.5391.1145. [DOI] [PubMed] [Google Scholar]
- Vicente-Manzanares M, Ma X, Adelstein RS, Horwitz AR. Non-muscle myosin II takes centre stage in cell adhesion and migration. Nat Rev Mol Cell Biol. 2009;10:778–790. doi: 10.1038/nrm2786. [DOI] [PMC free article] [PubMed] [Google Scholar]
- Yang YM, Gupta SK, Kim KJ, Powers BE, Cerqueira A, Wainger BJ, Ngo HD, Rosowski KA, Schein PA, Ackeifi CA, et al. A small molecule screen in stem-cell-derived motor neurons identifies a kinase inhibitor as a candidate therapeutic for ALS. Cell Stem Cell. 2013;12:713–726. doi: 10.1016/j.stem.2013.04.003. [DOI] [PMC free article] [PubMed] [Google Scholar]
- Zhang JH, Chung TD, Oldenburg KR. A Simple Statistical Parameter for Use in Evaluation and Validation of High Throughput Screening Assays. J Biomol Screen. 1999;4:67–73. doi: 10.1177/108705719900400206. [DOI] [PubMed] [Google Scholar]
Associated Data
This section collects any data citations, data availability statements, or supplementary materials included in this article.
Supplementary Materials
Progressive zoom-in showing multiple wells of a 384-well plate, each containing numerous organoids labeled for proximal tubules (LTL, green), distal tubules (ECAD, yellow), and podocytes (NPHS1, red). The plate shown is distinct from the one shown in Figure 1D.
Time-lapse imaging of kidney organoids in adherent cultures starting 16 hours after initial treatment with 50 µM cisplatin. During the subsequent 24 hours, the organoid tubules (center and upper left) disintegrate and disappear from view.