

Abstract
Background
Achilles tendons are the most common sites of tendon xanthomas that are commonly caused by disturbance of lipid metabolism. Achilles tendon thickening is the early characteristic of Achilles tendon xanthomas. The relationship between Achilles tendon thickness (ATT) and LDL-C levels, and risk factors of ATT in patients with hypercholesterolemia, have thus far been poorly documented.
Methods
A total of 205 individuals, aged 18-75 years, were enrolled from March 2014 to March 2015. According to the LDL-C levels and the “Chinese Guidelines on Prevention and Treatment of Dyslipidemia in Adults”, all subjects were divided into 3 groups: normal group (LDL-C < 3.37 mmol/L, n = 51); borderline LDL-C group (3.37 mmol/L ≤ LDL-C ≤ 4.12 mmol/L, n = 50); and hypercholesterolemia group (LDL ≥ 4.14 mmol/L, n = 104). ATT was measured using a standardized digital radiography method and the results were compared among the 3 groups. The correlation between ATT and serum LDL-C levels was analyzed by Pearson’s correlation, and the risk factors of ATT were determined by the logistic regression model.
Results
ATT in borderline LDL-C group was 8.24 ± 1.73 mm, markedly higher than 6.05 ± 0.28 mm of normal group (P < 0.05). ATT in hypercholesterolemia group was 9.42 ± 3.63 mm which was significantly higher than that of normal group (P < 0.005) and that of borderline LDL-C group (P < 0.05). There was a positive correlation between the serum LDL-C levels and ATT (r = 0.346, P < 0.001). The serum LDL-C level was a risk factor (OR = 1.871, 95% CI: 1.067-3.280) while the levels of HDL-C (OR = 0.099, 95% CI: 0.017-0.573) and Apo AI (OR = 0.035, 95% CI: 0.003-0.412) were protective factors of ATT.
Conclusions
ATT might serve as a valuable auxiliary diagnostic index for hypercholesterolemia and used for the assessment and management of cardiovascular disease.
Keywords: Low density lipoprotein cholesterol, Hypercholesterolemia, Achilles tendon xanthoma, Achilles tendon thickness, Cardiovascular disease, Digital radiography
Background
Tendinous xanthomas, consisting mainly of lipids and monocyte-derived foam cells, are commonly caused by lipoprotein metabolism disorders such as familial hypercholesterolemia (FH) [1]. Tendon xanthomas are independently associated with the presence and burden of coronary atherosclerosis [2–5]. The Achilles tendon, the strongest and thickest tendon in the body, is the most common site of tendonous xanthomas [6]. An early sign of Achilles tendon xanthomas is Achilles tendon thickening, which can be quantitatively measured by standardized digital radiography (DR) [7, 8]. It has been shown that Achilles tendon thickness (ATT) is a risk factor of cardiovascular disease (CVD) in patients with FH [9]. However, the relationship between ATT and the degree of hypercholesterolemia particularly that of low density lipoprotein cholesterol (LDL-C), and factors associated with ATT in patients with hypercholesterolemia have thus far been poorly documented.
In this study, we used a standardized digital radiography method to measure ATT in patients with hypercholesterolemia and in subjects with normal and borderline LDL-C, and compared the results. The relationship between ATT and LDL-C levels, and positive and negative predictors for ATT are described.
Methods
Study subjects
A total of 205 individuals, aged 18-75 years, were enrolled between March 2014 and March 2015. Based on LDL-C levels, subjects were assigned to one of three tertiles described by the Joint Committee for Developing Chinese guidelines on Prevention and Treatment of Dyslipidemia in Adults [10]: normal LDL-C (LDL-C < 3.37 mmol/L, n = 51); borderline LDL-C (3.37 mmol/L ≤ LDL-C ≤ 4.12 mmol/L, n = 50); and high LDL-C (LDL ≥ 4.14 mmol/L, n = 104). A pilot study of 8 participants in each tertile was first performed to determine sample size, which showed that the ATT mean value in normal group, borderline LDL-C group and high LDL-C group was 5.88 mm, 7.50 mm and 8.89, respectively, with the highest standard deviation of 1.25 seen in the high LDL-C group. Using these preliminary data, the sample size required to detect a significant difference in ATT was calculated with an online program (http://powerandsamplesize.com/Calculators/Compare-k-Means/1-Way-ANOVA-Pairwise), and the results showed that 15 subjects in each group are needed, ensuring that the power of the test is 80% with type I error of 0.05. All patients with hypercholesterolemia (high LDL-C group) were newly diagnosed, and had not received any lipid-lowering therapy prior to participating in this study. None of the subjects in the normal or borderline LDL-C groups were taking lipid-lowering therapy. Patients with conditions that could affect Achilles tendon thickness such as tendinitis, tenosynovitis, bursitis, tuberculum arthriticum, rheumatoid arthritis, Achilles tendon injury or prior Achilles tendon surgery were excluded from enrollment. All enrolled subjects provided written informed consent, and the study was approved by the Institutional Review Committee of The Third People′s Hospital of Hainan Province.
Clinical examination
The age, gender, height, weight, body mass index (BMI), fasting glucose levels and blood pressure of all subjects were recorded. Two milliliters of venous blood was collected after overnight fasting and centrifuged within an hour for the measurement of serum LDL-C which was completed using a standard method at the Department of Laboratory Medicine of The Third People′s Hospital of Hainan Province.
ATT was measured by standardized digital radiography with the following imaging parameters: 50 kV, 5 mAs, 0.05 mSv/image, and the distance from the X-ray source to the Achilles tendon was 120 cm [8]. Subjects were positioned with the leg and the foot forming a 90 degree angle. The thickest part of Achilles tendon, between the heel and 8 cm above the heel, was measured (Fig. 1).
Fig. 1.

Measurement of ATT by digital radiography. Panel (a) shows the measuring platform and ruler. For ATT measurement, the subject was side-lying with the leg and the foot forming a 90 degree angle (panel b) and the thickest part of Achilles tendon between the heel and 8 cm above the heel was measured (panel c)
Statistical methods
Statistical analyses were carried out using the SPSS statistical package (19.0). Continuous variables were presented as mean values ± standard deviation (SD), and categorical variables are expressed as percentages and analyzed by the Chi-square test. A one-way analysis of variance followed by the Least Significant Difference (LSD) t test was performed to compare continuous variables. Pearson’s correlation was used to analyze the correlation between the level of LDL-C and ATT. Univariate and multivariable logistic regression models were used to analyze the risk factors of ATT. P < 0.05 was considered statistically significant.
Results
Study subjects
The demographic information and clinical characteristics of all 3 groups are shown in Table 1. There were no significant differences in gender ratio, age, height, weight, BMI and blood pressure (systolic and diastolic blood pressure) among the three groups. Four individuals had systolic hypertension (systolic blood pressure average > 140 mmHg on repeated measurements) in the normal LDL-C group, 15 in the borderline LDL-C group and 22 in high LDL-C group. There were 0, 8, and 9 cases of diabetes in normal LDL-C, borderline LDL-C, and high LDL-C groups respectively. Patients in the high LDL-C group had the highest ATT, followed by those in the borderline LDL-C group. ATT was lowest in the normal LDL-C group. Statistical analysis showed that ATT in the borderline LDL-C group was markedly higher than that of the normal group, and ATT in the high LDL-C group was significantly higher than in the other 2 groups (Table 1). Representative images of ATT measurement in individuals from each group are shown in Figs. 2, 3, and 4.
Table 1.
Demographics and clinical characteristics of all groups
| Normal | Borderline LDL-C | hypercholesterolemia | |
|---|---|---|---|
| Number (M/F) | n = 51 (26/25) | n = 50 (28/22) | n = 104 (54/50) |
| Age (years) | 56.90 ± 7.46 | 51.52 ± 9.57 | 53.13 ± 10.86 |
| Height (cm) | 161.80 ± 6.02 | 160.61 ± 6.54 | 161.78 ± 7.27 |
| Weight (kg) | 56.55 ± 5.34 | 59.00 ± 11.28 | 60.55 ± 10.21 |
| BMI (kg/m2) | 21.56 ± 1.01 | 22.75 ± 3.34 | 23.07 ± 3.00 |
| SBP (mmHg) | 139.50 ± 19.78 | 128.16 ± 12.95 | 132.65 ± 14.78 |
| DBP (mmHg) | 86.00 ± 11.59 | 80.89 ± 10.34 | 85.33 ± 10.03 |
| ATT (mm) | 6.05 ± 0.28 | 8.24 ± 1.73* | 9.42 ± 3.63∆# |
| Comorbidities | |||
| Hypertension | n = 4 | n = 15 | n = 22 |
| Diabetes | n = 0 | n = 8 | n = 9 |
Continuous data were expressed as mean ± standard deviation
M male, F female, BMI body mass index, SBP systolic blood pressure, DBP diastolic blood pressure, and ATT Achilles tendon thickness
* P < 0.05 compared with normal group; ∆ P < 0.05 compared with borderline LDL-C group; and # P < 0.005 compared with normal group
Fig. 2.

Representative images of ATT measurement in a subject with normal LDL-C. A male who was 66-year-old had an ATT of 7.5 mm (his serum LDL-C was 2.97 mmol/L)
Fig. 3.

Representative images of ATT measurement in a subject with borderline LDL-C. A female who was 58-year-old had an ATT of 7.0 mm (her serum LDL-C was 3.85 mmol/L)
Fig. 4.

Representative images of ATT measurement in a patient with hypercholesterolemia. A male who was 67-year-old had an ATT of 13.5 mm (his serum LDL-C was 5.46 mmol/L)
Correlation between ATT and LDL-C levels
Analysis of correlation between ATT and LDL-C levels showed a correlation coefficient of 0.346 (P < 0.001), and there was a positive correlation as shown in Fig. 5.
Fig. 5.
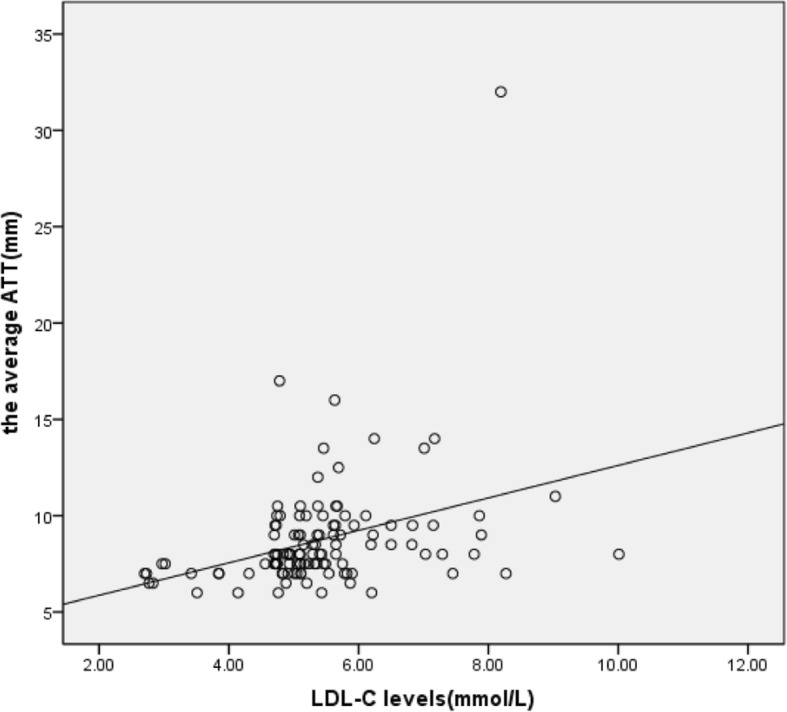
Analysis of correlation between ATT and LDL-C levels. The correlation coefficient was 0.346 between Achilles tendon thickness and serum LDL-C levels (P < 0.001)
Results of univariate logistic regression analysis
As shown in Table 2, univariate logistic regression analysis using ATT as the dependent variable, and gender, age, height, weight, BMI, systolic blood pressure, diastolic blood pressure, the fasting glucose level, levels of total cholesterol (TC), high density lipoprotein cholesterol (HDL-C), LDL-C, ApoA1, ApoB and lipoprotein(a) (Lp(a)) as independent variables revealed that height, BMI, TC, HDL-C, LDL-C and ApoA1 were associated with ATT (P < 0.05).
Table 2.
The results of univariate logistic regression analysis
| Variable | β | S.E | Wald | P value | OR | 95% CI |
|---|---|---|---|---|---|---|
| Gender | −0.602 | 0.408 | 2.183 | 0.120 | 0.548 | 0.246-1.217 |
| Ages | 0.010 | 0.020 | 0.229 | 0.632 | 1.010 | 0.971-1.050 |
| Height | 0.062 | 0.030 | 4.160 | 0.041 | 1.064 | 1.002-1.129 |
| Weight | 0.006 | 0.011 | 0.371 | 0.542 | 1.007 | 0.986-1.028 |
| BMI | 0.196 | 0.068 | 8.271 | 0.004 | 1.271 | 1.064-1.390 |
| TC | 0.277 | 0.134 | 4.243 | 0.039 | 1.139 | 1.014-1.715 |
| LDL-C | 0.869 | 0.239 | 13.274 | 0.000 | 2.385 | 1.494-3.807 |
| HDL-C | −3.573 | 0.720 | 24.628 | 0.000 | 0.028 | 0.007-0.115 |
| Apo AI | −5.084 | 1.027 | 24.484 | 0.000 | 0.006 | 0.001-0.046 |
| Apo B | −0.209 | 0.533 | 0.153 | 0.695 | 0.812 | 0.285-2.238 |
| Lp (a) | 0.001 | 0.001 | 0.983 | 0.321 | 1.001 | 0.999-1.003 |
| SBP | 0.008 | 0.014 | 0.295 | 0.587 | 1.008 | 0.980-1.036 |
| DBP | 0.005 | 0.019 | 0.078 | 0.779 | 1.005 | 0.968-1.044 |
| FGL | 0.036 | 0.071 | 0.259 | 0.611 | 1.037 | 0.902-1.191 |
BMI body mass index, TC total cholesterol, LDL-C low density lipoprotein cholesterol, HDL-C high density lipoprotein cholesterol, SBP systolic blood pressure, DBP diastolic blood pressure, FGL fasting glucose level
Results of multivariable regression analysis
Multivariable regression analysis was performed using indexes which were demonstrated to be related to ATT in univariate analysis. The results showed that only the level of LDL-C remained a risk factor for ATT, while levels of HDL-C and ApoA1 were protective factors of ATT (Table 3).
Table 3.
The results of multivariable logistic regression analysis
| Variable | β | S.E | Wald | P value | OR | 95% CI |
|---|---|---|---|---|---|---|
| Height | 0.071 | 0.047 | 2.269 | 0.132 | 1.073 | 0.979-1.177 |
| LDL-C | 0.626 | 0.287 | 4.779 | 0.029 | 1.871 | 1.067-3.280 |
| HDL-C | −2.310 | 0.894 | 6.668 | 0.010 | 0.099 | 0.017-0.573 |
| Apo A1 | −3.363 | 1.263 | 7.085 | 0.008 | 0.035 | 0.003-0.412 |
LDL-C low density lipoprotein cholesterol, HDL-C high density lipoprotein cholesterol
Discussion
Hypercholesterolemia, diagnosed based on blood lipoprotein profiles with TC ≥ 6.22 mmol/L or LDL-C ≥ 4.14 mmol/L [10], can result in deposition and accumulation of cholesterol-rich materials on tendons forming tendon xanthomas. As the Achilles tendon is a common site of lipid deposition, its thickness can provide an early indicator of xanthoma formation [7]. Although ultrasonography has been used for the measurement of ATT [11–15], the methodology has not been standardized [8]. As there is no neighboring tissue to serve as a reliable reference, the subjective nature of ultrasonography for the evaluation of diffuse changes in tendon echogenicity is an additional limitation [10]. Therefore, in this study we adopted a standardized digital radiography method to measure ATT and found that; 1) ATT was significantly higher in patients with hypercholesterolemia than in the other 2 groups, 2) ATT was positively correlated with serum LDL-C levels and, 3) the serum LDL-C level was an independent risk factor, while the HDL-C and ApoA1 levels were protective factors of ATT.
The presence of tendon xanthomas has been recognized as a diagnostic marker for FH [5, 11–17]. However, few studies have explored the association between ATT and LDL-C levels. Ebeling et al. reported that patients with heterozygous familial hypercholesterolemia had higher ATT compared with healthy controls, and ATT was positively related to total cholesterol levels [16]. Junyent et al. observed that, compared with other dyslipidemic or normolipidemic controls, patients with FH had higher ATT which was positively correlated with LDL-C levels [17]. These data align well with our findings, suggesting increased LDL-C levels might be responsible for Achilles tendon thickening. We have also shown that those with borderline LDL-C levels had significantly higher ATT compared with the normal LDL-C group.
It has been shown that ATT is a clinical marker to identify patients at high risk for CVD [9]. We found that the serum LDL-C level was an independent risk factor, while HDL-C and Apo AI levels were protective factors, for ATT. Therefore, LDL-C reduction would be important for the reduction of ATT and the risk of CVD. Indeed, the HMG CoA reductase inhibitor atorvastatin has been shown to reduce ATT in patients with hypercholesterolemia [18] while treatment with simvastatin has been shown to result in regression of Achilles tendon xanthomas [19]. While effective in reducing low-density lipoprotein cholesterol levels and decreasing cardiovascular events, the use of HMG CoA reductase inhibitors can be limited due to patient intolerance from side effects. In that respect, nutraceuticals and functional food ingredients have been recommended as suitable and amiable alternatives for control of dyslipidemia [20]. For those patients with borderline LDL-C and those who simply do not prefer medications, nutraceuticals and functional food ingredients might be the preferred treatment choice.
Limitations of this study include 1) the sample size is small, limiting the generalizability of the results; and 2) the study was carried out in a single center. Multi-centered studies in large series are therefore needed to validate these findings.
Conclusions
ATT might serve as a valuable auxiliary diagnostic index for hypercholesterolemia and used for the assessment and management of CVD.
Acknowledgements
The authors thank all subjects for participating in this study.
Funding
This study was supported partly by the Hainan Provincial Medical and Health Research Projects (1421320.24A1005).
Availability of data and materials
The authors declare that the data supporting the findings of this study are available within the article.
Abbreviations
- ATT
Achilles tendon thickness
- BMI
Body mass index
- CVD
Cardiovascular disease
- DBP
Diastolic blood pressure
- DR
Digital radiography
- FH
Familial hypercholesterolemia
- HDL-C
high density lipoprotein cholesterol
- LDL-C
low density lipoprotein cholesterol
- SBP
Systolic blood pressure
- TC
Total cholesterol
Authors’ contributions
BW prepared the figures and drafted the manuscript. LL designed the study and helped to draft the manuscript. LLP carried out the most of experimental studies. CYH participated in the figures preparation and analysis of data. ZXH participated in the preparation of the figures and carried out the experimental studies. XXW and CBZ participated in the measurement of ATT by the standardized method of digital radiography. ZAZ and MCF participated in the biochemical analysis. QZ and MJK analyzed the data and critically revised the manuscript. All authors read and approved the final manuscript.
Ethics approval and consent to participate
This study was approved by the Ethical Committee, the Third People′s Hospital of Hainan Province. All participants provided written informed consent.
Consent for publication
Participants were informed of data sharing with their name and identity hidden per consent.
Competing interests
The authors declare that they have no competing interests.
Publisher’s Note
Springer Nature remains neutral with regard to jurisdictional claims in published maps and institutional affiliations.
References
- 1.Kruth HS. Lipid deposition in human tendon xanthomas. Am J Pathol. 1985;121:311–315. [PMC free article] [PubMed] [Google Scholar]
- 2.Hirobe K, Matsuzawa Y, Ishikawa K, Tarui S, Yamamoto A, Nambu S, et al. Coronary artery disease in heterozygous familial hypercholesterolemia. Atherosclerosis. 1982;44:201–210. doi: 10.1016/0021-9150(82)90114-9. [DOI] [PubMed] [Google Scholar]
- 3.Ferrieres J, Lambert J, Lussier-Cacan S, Davignon J. Coronary artery disease in heterozygous familial hypercholesterolemia patients with the same LDL receptor gene mutation. Circulation. 1995;92:290–295. doi: 10.1161/01.CIR.92.3.290. [DOI] [PubMed] [Google Scholar]
- 4.Civeira F, Castillo S, Alonso R, Meriño-Ibarra E, Cenarro A, Artied M, et al. Spanish familial hypercholesterolemia group. Tendon xanthomas in familial hypercholesterolemia are associated with cardiovascular risk independently of the low-density lipoprotein receptor gene mutation. Arterioscler Thromb Vasc Biol. 2005;25:1960–1965. doi: 10.1161/01.ATV.0000177811.14176.2b. [DOI] [PubMed] [Google Scholar]
- 5.Oosterveer DM, Versmissen J, Yazdanpanah M, Hamza TH, Sijbrands EJ. Differences in characteristics and risk of cardiovascular disease in familial hypercholesterolemia patients with and without tendon xanthomas: a systematic review and meta-analysis. Atherosclerosis. 2009;207:311–317. doi: 10.1016/j.atherosclerosis.2009.04.009. [DOI] [PubMed] [Google Scholar]
- 6.Tsouli SG, Kiortsis DN, Argyropoulou MI, Mikhailidis DP, Elisaf MS. Pathogenesis, detection and treatment of Achilles tendon xanthomas. Eur J Clin Investig. 2005;35:236–244. doi: 10.1111/j.1365-2362.2005.01484.x. [DOI] [PubMed] [Google Scholar]
- 7.Soslowsky LJ, Fryhofer GW. Tendon homeostasis in hypercholesterolemia. Adv Exp Med Biol. 2016;920:151–165. doi: 10.1007/978-3-319-33943-6_14. [DOI] [PubMed] [Google Scholar]
- 8.Harada-Shiba M, Arai H, Oikawa S, Ohta T, Okada T, Okamura T, et al. Guidelines for the management of familial hypercholesterolemia. J Atheroscler Thromb. 2012;19:1043–1060. doi: 10.5551/jat.14621. [DOI] [PubMed] [Google Scholar]
- 9.Sugisawa T, Okamura T, Makino H, Watanabe M, Kishimoto I, Miyamoto Y, et al. Defining patients at extremely high risk for coronary artery disease in heterozygous familial hypercholesterolemia. J Atheroscler Thromb. 2012;19:369–375. doi: 10.5551/jat.11536. [DOI] [PubMed] [Google Scholar]
- 10.Joint committee for developing Chinese guidelines on prevention and treatment of dyslipidemia in adults Chinese guidelines on prevention and treatment of dyslipidemia in adults. Chin J Cardiol. 2007;35:390–419. [PubMed] [Google Scholar]
- 11.Descamps OS, Leysen X, Van Leuven F, Heller FR. The use of Achilles tendon ultrasonography for the diagnosis of familial hypercholesterolemia. Atherosclerosis. 2001;157:514–518. doi: 10.1016/S0021-9150(01)00533-0. [DOI] [PubMed] [Google Scholar]
- 12.Scheel AK, Schettler V, Koziolek M, Koelling S, Werner C, Müller GA, et al. Impact of chronic LDL-apheresis treatment on Achilles tendon affection in patients with severe familial hypercholesterolemia: a clinical and ultrasonographic 3-year follow-up study. Atherosclerosis. 2004;174:133–139. doi: 10.1016/j.atherosclerosis.2004.01.014. [DOI] [PubMed] [Google Scholar]
- 13.Koivunen-Niemelä T, Alanen A, Viikari J. Sonography of the Achilles tendon in hypercholesterolaemia. J Intern Med. 1993;234:401–405. doi: 10.1111/j.1365-2796.1993.tb00762.x. [DOI] [PubMed] [Google Scholar]
- 14.Yuzawa K, Yamakawa K, Tohno E, Seki M, Akisada M, Yanagi H, et al. An ultrasonographic method for detection of Achilles tendon xanthomas in familial hypercholesterolemia. Atherosclerosis. 1989;75:211–218. doi: 10.1016/0021-9150(89)90178-0. [DOI] [PubMed] [Google Scholar]
- 15.Michikura M, Ogura M, Yamamoto M, Sekimoto M, Fuke C, Hori M, et al. Achilles tendon ultrasonography for diagnosis of familial hypercholesterolemia among Japanese subjects. Circ J. 2017;81:1879–1885. doi: 10.1253/circj.CJ-17-0041. [DOI] [PubMed] [Google Scholar]
- 16.Ebeling T, Farin P, Pyörälä K. Ultrasonography in the detection of Achilles tendon xanthomata in heterozygous familial hypercholesterolemia. Atherosclerosis. 1992;97:217–228. doi: 10.1016/0021-9150(92)90134-3. [DOI] [PubMed] [Google Scholar]
- 17.Junyent M, Gilabert R, Zambón D, Núñez I, Vela M, Civeira F, et al. The use of Achilles tendon sonography to distinguish familial hypercholesterolemia from other genetic dyslipidemias. Arterioscler Thromb Vasc Biol. 2005;25:2203–2208. doi: 10.1161/01.ATV.0000183888.48105.d1. [DOI] [PubMed] [Google Scholar]
- 18.Tsouli SG, Xydis V, Argyropoulou MI, Tselepis AD, Elisaf M, Kiortsis DN. Regression of Achilles tendon thickness after statin treatment in patients with familial hypercholesterolemia: an ultrasonographic study. Atherosclerosis. 2009;205:151–155. doi: 10.1016/j.atherosclerosis.2008.10.032. [DOI] [PubMed] [Google Scholar]
- 19.Kolovou G, Daskalova D, Mastorakou I, Anagnostopoulou K, Cokkinos DV. Regression of Achilles tendon xanthomas evaluated by CT scan after hypolipidemic treatment with simvastatin. A case report. Angiology. 2004;55:335–339. doi: 10.1177/000331970405500314. [DOI] [PubMed] [Google Scholar]
- 20.Scicchitano P, Cameli M, Maiello M, Modesti PA, Muiesan ML, Novo S, et al. Nutraceuticals and dyslipidaemia: beyond the common therapeutics. J Funct Foods. 2014;6:11–32. doi: 10.1016/j.jff.2013.12.006. [DOI] [Google Scholar]
Associated Data
This section collects any data citations, data availability statements, or supplementary materials included in this article.
Data Availability Statement
The authors declare that the data supporting the findings of this study are available within the article.