

Abstract
Age, sex and chromosome effects on weight, height, sitting height, three head dimensions, and five hand and three foot measurements were analyzed from 57 patients (35 males and 22 females) with the Prader-Willi syndrome (PWS). No significant differences were observed in anthropometric data between PWS patients with the 15q chromosome deletion and those with normal chromosomes. Preschool children were found to have dolichocephaly, while hand and foot measurements, stature and sitting height were within normal range, although foot size was smaller than hand size in females when compared with PWS males. However, anthropometric measurements, excluding weight, head length and ankle breadth, were less than − 2 SD in adult patients. Abnormal growth patterns apparently exist with significant negative correlations with age, particularly in PWS males, for height, sitting height, head circumference, and hand and foot measurements, but a significant positive correlation for weight was found in patients below 10 years of age.
Keywords: acromicria, anthropometric, correlations, 15q chromosome deletion
The Prader-Willi syndrome (PWS), sporadic in occurrence, is characterized by infantile hypotonia, early childhood obesity, mental deficiency, short stature, small hands and feet, hypogonadism and mild dysmorphism. The incidence of PWS has been estimated at 1 in 25 000 live-births and is the most common form of genetic or syndromic obesity (Hall & Smith 1972, Zellweger & Soper 1979, Bray et al. 1983, Butler 1990). The cause of this syndrome is not clear, although a chromosome 15q 11–13 deletion has been found in about one-half of PWS individuals (Ledbetter et al. 1982, Mattei et al. 1984, Cassidy et al. 1984, Butler et al. 1986, Wenger et al. 1987, Butler 1990). In the vast majority of PWS patients, the chromosome deletion is paternal in origin although parental chromosomes are normal (Butler & Palmer 1983, Butler 1990). Recently, in two PWS patients without a recognizable chromosome 15q deletion, maternal disomy of chromosome 15 was identified with the use of informative DNA markers from the proximal 15q chromosome region (Nicholls et al. 1989).
It is known that several physical parameters in PWS patients are not normal. For example, in a recent literature review of 538 patients, short stature and small hands and feet (both major features of this syndrome) were reported in 76% and 83% of the patients, respectively (Butler 1990). Only a few studies have been reported on the linear growth patterns in PWS individuals (Nugent & Holm 1981, Butler & Meaney 1987, Butler et al. 1988) and no published reports on the characterization and onset of the abnormal hand and foot measurements and their relationships with other physical parameters.
Here, we report a systemic, anthropometric study of several physical parameters in 57 PWS patients including weight, height, sitting height, three head dimensions, and five hand and three foot measurements and their comparison with age as well as the identification of differences between sex, chromosome subgroups, or age.
Material and Methods
The 57 subjects (24 patients less than 10 years old; 19 patients between 10 and 18 years; 14 patients greater than 18 years) included in this study were diagnosed as having PWS on the basis of infantile hypotonia, hypogonadism, delayed psychomotor development and/or mental deficiency, early childhood obesity, small hands and feet, and short stature. The sample included 35 males and 22 females ranging in age from 0.05 to 38.6 years with a mean age of 12.7 years.
The anthropometric measurements were made by two of the authors (F.J.M. or M.G.B.) according to standard techniques as presented by Weiner & Lourie (1969). Longitudinal data were collected on several individuals over a period of 5 years.
The measurements consisted of the following: weight, length, sitting height, total hand length, middle finger length, palm length, hand breadth, wrist breadth, total foot length, foot breadth, ankle breadth, head circumference, head breadth, and head length. Up to the age of 2 years, length was measured in the supine position using a horizontal calibrated board, and thereafter height measurements were taken. Head circumference was measured to the nearest millimeter with a steel tape. Weight and height were taken with a balanced-beam scale and anthropometer, respectively. Hand and foot measurements and head breadth and head length were obtained with sliding or spreading calipers, respectively.
Z scores were computed using normative measurements to control for age and sex effects. Z scores were calculated from the following formula: Z = (X − X̄)/SD, where SD is the standard deviation of the normal control; X̄ is the mean of the normal control; and X is the measurement of the subject. Normative values were obtained from published sources (Feingold & Bossert 1974, Snyder et al. 1977, Roche & Malina 1983).
Pearson product moment correlations were calculated for age for the various anthropometric parameters. Student’s t-tests were also calculated to identify significant differences in anthropometric variables for sex, age, or chromosome status.
High resolution chromosome analysis was performed on the 57 PWS individuals. Twenty-two PWS individuals were identified with an apparent deletion of the proximal long arm of chromosome 15. Normal chromosome findings were observed in 29 individuals, while in the remaining six individuals the chromosome status was unknown.
Results
Table 1 includes Z score and age correlation data for the anthropometric variables from the 57 PWS patients and comparison with three separate age groups (e.g., < 10 years; 10–18 years; > 18 years). Table 2 includes Z score and correlation data for males and females with PWS, while Table 3 includes summary anthropometric data. Fig. 1–5 show Z score data plotted against age for each anthropometric variable.
Table 1.
Z score and correlation data for selected age groups in 57 patients with the Prader-Willi syndrome
| Variable | All patients (N = 57)
|
Patients < 10 y (N = 24)
|
Patients 10–18 y (N = 19)
|
Patients > 18 y (N = 14)
|
||||
|---|---|---|---|---|---|---|---|---|
| Z Score Mean ± SD | Correlation with age r | Z Score Mean ± SD | Correlation with age r | Z Score Mean ± SD | Correlation with age r | Z Score Mean ± SD | Correlation with age r | |
| Weight | 1.47 ± 2.75 | 0.12 | 1.30 ± 3.08 | 0.55b | 1.87 ± 2.55 | 0.44 | 1.21 ± 2.55 | − 0.04 |
| Height | − 1.95 ± 1.37 | −0.50c | − 1.21 ± 1.32 | − 0.06 | − 2.34 ± 1.15 | − 0.44 | − 2.71 ± 1.16 | − 0.31 |
| Sitting height | − 1.37 ± 1.33 | −0.31a | − 1.14 ± 1.23 | − 0.21 | − 1.19 ± 1.17 | − 0.17 | − 2.05 ± 1.58 | − 0.27 |
| Head circumference | − 1.22 ± 1.16 | −0.39b | − 0.80 ± 1.13 | 0.25 | − 1.05 ± 0.98 | 0.01 | − 2.16 ± 0.96 | − 0.23 |
| Head length | − 0.91 ± 1.19 | −0.25 | − 0.78 ± 1.43 | − 0.04 | − 0.68 ± 0.92 | 0.09 | − 1.45 ± 1.02 | − 0.49 |
| Head breadth | − 1.97 ± 1.47 | −0.13 | − 1.56 ± 2.02 | − 0.28 | − 2.39 ± 0.89 | − 0.14 | − 2.01 ± 0.89 | 0.54 |
| Total hand length | − 1.73 ± 1.30 | −0.41b | − 1.14 ± 1.35 | 0.11 | − 1.79 ± 0.99 | − 0.26 | − 2.69 ± 1.04 | 0.09 |
| Middle finger length | − 1.96 ± 1.31 | −0.49c | − 1.24 ± 1.18 | 0.05 | −2.13 ± 1.21 | − 0.20 | − 2.98 ± 0.88 | − 0.09 |
| Palm length | − 1.16 ± 0.96 | −0.37a | − 0.93 ± 0.88 | − 0.17 | − 1.56 ± 1.00 | − 0.35 | NA | |
| Hand breadth | − 2.06 ± 1.70 | −0.38b | − 1.20 ± 1.51 | 0.01 | − 2.46 ± 1.57 | − 0.08 | − 2.87 ± 1.65 | − 0.04 |
| Wrist breadth | − 1.87 ± 1.52 | −0.15 | NA | − 1.65 ± 1.29 | 0.50 | −2.17 ± 1.82 | − 0.22 | |
| Foot length | − 2.37 ± 1.29 | −0.34a | − 1.69 ± 1.33 | 0.11 | −2.87 ± 1.18 | − 0.11 | − 2.81 ± 0.86 | −0.02 |
| Foot breadth | − 2.47 ± 2.00 | −0.31a | − 1.81 ± 1.91 | − 0.14 | − 2.63 ± 1.83 | 0.12 | − 3.32 ± 2.14 | − 0.18 |
| Ankle breadth | − 0.34 ± 1.25 | 0.10 | NA | − 0.35 ± 1.58 | 0.68b | − 0.33 ± 0.60 | − 0.32 | |
p < 0.05;
p < 0.01;
p < 0.001.
NA = normative standards are not available for calculations of Z scores.
Table 2.
Z score and correlation data for PWS males and females
| Variable | All patients (N = 57)
|
Males (N = 35)
|
Females (N = 22)
|
|||
|---|---|---|---|---|---|---|
| Z Score Mean ± SD | Correlation with age r | Z Score Mean ± SD | Correlation with age r | Z Score Mean ± SD | Correlation with age r | |
| Weight | 1.47 ± 2.75 | 0.12 | 1.62 ± 2.71 | − 0.06 | 1.22 ± 2.86 | 0.41 |
| Height | − 1.95 ± 1.37 | − 0.50c | − 1.84 ± 1.50 | − 0.59c | − 2.14 ± 1.15 | − 0.32 |
| Sitting height | − 1.37 ± 1.33 | − 0.31a | − 1.25 ± 1.31 | − 0.41a | − 1.55 ± 1.37 | − 0.15 |
| Head circumference | − 1.22 ± 1.16 | − 0.39b | − 1.03 ± 1.25 | − 0.46b | − 1.54 ± 0.94 | − 0.22 |
| Head length | − 0.91 ± 1.19 | − 0.25 | − 0.77 ± 1.13 | − 0.49b | − 1.12 ± 1.27 | 0.11 |
| Head breadth | − 1.97 ± 1.47 | − 0.13 | − 1.78 ± 1.35 | − 0.15 | − 2.27 ± 1.63 | − 0.07 |
| Total hand length | − 1.73 ± 1.30 | − 0.41b | − 1.67 ± 1.45 | − 0.61c | − 1.84 ± 1.04 | 0.02 |
| Middle finger length | − 1.96 ± 1.31 | − 0.49c | − 1.87 ± 1.42 | − 0.69c | − 2.09 ± 1.15 | − 0.12 |
| Palm length* | − 1.16 ± 0.96 | − 0.37a | − 0.90 ± 0.86 | − 0.31 | − 1.61 ± 0.99 | − 0.42 |
| Hand breadth | − 2.06 ± 1.70 | − 0.38b | − 1.94 ± 1.77 | − 0.66c | − 2.25 ± 1.60 | 0.13 |
| Wrist breadth | − 1.87 ± 1.52 | − 0.15 | − 2.31 ± 1.42 | − 0.49 | − 1.35 ± 1.53 | 0.33 |
| Foot length | − 2.37 ± 1.29 | − 0.34a | − 2.16 ± 1.34 | − 0.47b | − 2.69 ± 1.18 | − 0.11 |
| Foot breadth | − 2.47 ± 2.00 | − 0.31a | − 2.35 ± 2.03 | − 0.58c | − 2.67 ± 1.97 | 0.16 |
| Ankle breadth | − 0.34 ± 1.25 | 0.10 | − 0.39 ± 1.25 | 0.16 | − 0.29 ± 1.30 | 0.50 |
p < 0.05;
p < 0.01;
p < 0.001;
p < 0.05; t-test between males and females.
Table 3.
Summary of Prader-Willi syndrome anthropometric measurements
| Measurements | Males
|
Females
|
||
|---|---|---|---|---|
| Affected total | % | Affected total | % | |
| Weight | ||||
| < − 2SD | 1/35 | 3 | 4/22 | 18 |
| < − 1 SD | 4/35 | 11 | 5/22 | 23 |
| > 1 SD | 14/35 | 40 | 11/22 | 50 |
| > 2SD | 13/35 | 37 | 9/22 | 41 |
| Height | ||||
| < − 2SD | 14/35 | 40 | 12/22 | 54 |
| < − 1 SD | 23/35 | 66 | 18/22 | 82 |
| > 1 SD | 1/35 | 3 | 0/22 | 0 |
| Sitting height | ||||
| < − 2 SD | 4/29 | 14 | 6/21 | 28 |
| < − 1 SD | 16/29 | 55 | 14/21 | 67 |
| > 1 SD | 2/29 | 7 | 1/21 | 5 |
| Head circumference | ||||
| < − 2 SD | 7/35 | 20 | 8/21 | 38 |
| < − 1 SD | 18/35 | 51 | 14/21 | 67 |
| > 1 SD | 3/35 | 8 | 0/21 | 0 |
| Head length | ||||
| < − 2SD | 7/32 | 22 | 3/21 | 14 |
| < − 1 SD | 13/32 | 41 | 10/21 | 48 |
| > 1 SD | 2/32 | 6 | 0/21 | 0 |
| Head breadth | ||||
| < − 2SD | 17/32 | 53 | 13/21 | 62 |
| < − 1 SD | 26/32 | 81 | 20/21 | 95 |
| > 1 SD | 2/32 | 6 | 1/21 | 5 |
| > 2SD | 1/32 | 3 | 1/21 | 5 |
| Total hand length | ||||
| < − 2 SD | 14/35 | 40 | 7/22 | 32 |
| < − 1 SD | 21/35 | 60 | 19/22 | 86 |
| > 1 SD | 1/35 | 3 | 0/22 | 0 |
| Middle finger length | ||||
| < − 2 SD | 16/33 | 48 | 13/22 | 59 |
| < − 1 SD | 22/33 | 67 | 20/22 | 91 |
| Palm length | ||||
| < − 2 SD | 2/21 | 10 | 5/12 | 42 |
| < − 1 SD | 8/21 | 38 | 10/12 | 83 |
| Hand breadth | ||||
| < − 2 SD | 16/32 | 50 | 11/21 | 52 |
| < − 1 SD | 20/32 | 62 | 18/21 | 86 |
| > 1 SD | 2/32 | 6 | 0/21 | 0 |
| Wrist breadth | ||||
| < − 2SD | 8/13 | 62 | 3/11 | 27 |
| < − 1 SD | 10/13 | 77 | 7/11 | 64 |
| > 1 SD | 0/13 | 0 | 1/11 | 9 |
| Foot length | ||||
| < − 2SD | 18/32 | 56 | 18/22 | 82 |
| < − 1 SD | 26/32 | 81 | 21/22 | 95 |
| > 1 SD | 1/32 | 3 | 0/22 | 0 |
| Foot breadth | ||||
| < − 2 SD | 20/32 | 62 | 12/21 | 57 |
| < − 1 SD | 22/32 | 69 | 17/21 | 81 |
| > 1 SD | 1/32 | 3 | 1/21 | 5 |
| Ankle breadth | ||||
| < − 2 SD | 1/13 | 8 | 2/11 | 18 |
| < − 1 SD | 2/13 | 15 | 3/11 | 27 |
| >1 SD | 1/13 | 8 | 1/11 | 9 |
Fig. 1.

Z score data for weight, height and sitting height plotted against chronological age. Solid and dashed lines are linear regressions for PWS males and females, respectively. There were significant negative correlations (p < 0.05) with age for height (r=− 0.59) and sitting height (r= − 0.41) in males but not in females.
Fig. 5.
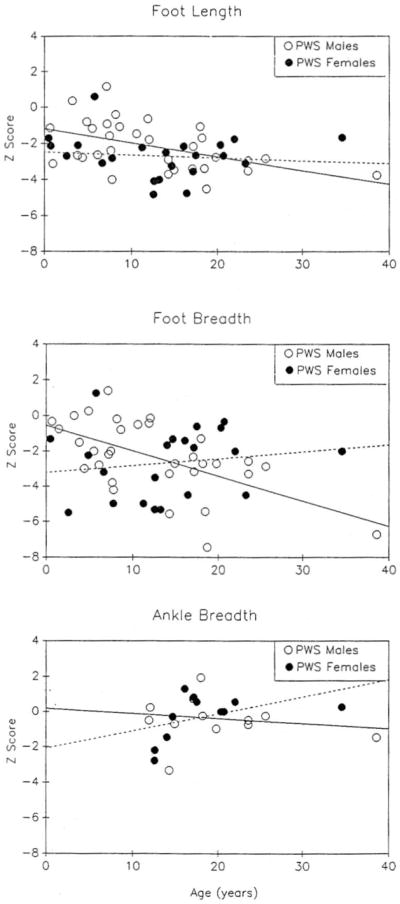
Z score data for foot length, foot breadth and ankle breadth plotted against chronological age. Solid and dashed lines are linear regressions for PWS males and females, respectively. There were significant negative correlations (p < 0.05) with age for foot length (r= − 0.47) and foot breadth (r= − 0.58) in males but not in females.
Significant negative correlations (p < 0.05) with age were observed for our combined patient group (N = 57) for height, sitting height, head circumference, total hand length, middle finger length, palm length, hand breadth, foot length, and foot breadth. Significant negative correlations (p < 0.05) with age were also observed for PWS males but not females for height, sitting height, head circumference, head length, total hand length, middle finger length, hand breadth, foot length and foot breadth.
No significant differences (p > 0.05; t-test) in the anthropometric Z score variables were found in PWS individuals with or without the chromosome deletion for any of the three age groups. There was also no significant difference in age between males and females. Only palm length was significantly different (p < 0.05; t-test) between sexes in the combined patient group (N = 57) with males having greater palm length. However, significant Z score differences (p < 0.05; t-test) were found between the adult (> 18 years) PWS males (N = 9) and females (N = 5). Greater weight, total hand length, middle finger length, hand breadth, wrist breadth and ankle breadth were observed in females. In our study the average height in adult males was 147.8 ± 23.8 cm and 151.6 ± 5.6 cm in females; average weight in adult males was 73.7 ± 16.3 kg and 92.9 ± 35.4 kg in females; average total hand length in adult males was 16.3 ± 0.7 cm and 15.9 ± 0.1 cm in females; and average foot length in adult males was 21.8 ± 1.2 cm and 21.0 ± 0.6 cm in females. Greater foot length (p < 0.05; t-test) was found in PWS males in the 10 to 18-year age group. No significant differences in anthropometric data were found between the sexes in individuals less than 10 years of age.
Significant positive correlations (p < 0.05) between Z score variables (e.g., height vs foot length) were observed for all variables, excluding head measurements, for patients less than 10 years of age while the majority of correlations between variables were not significant for the adult patients. Apparently, growth of specific parameters (e.g., height and hand length) may be at different rates in relationship to other variables and with advancing age. Therefore, growth patterns of different body segments (e.g., hand length) were not proportionate with height or possibly other variables, particularly in the adult patient with PWS.
Discussion
In the evaluation of growth patterns in PWS individuals at various ages, different patterns emerged. For example, foot length appeared to be proportionately smaller than hand length in all PWS individuals and this difference was more striking in females (see Table 3). 87% of ah PWS patients in our study had foot lengths < − 1 SD and 67% < − 2 SD, while 70% had hand lengths < − 1 SD and 39% were < − 2 SD. Interestingly, only 10% of hand lengths, 19% of foot lengths, and 25% of heights were < − 2 SD before 10 years of age, compared with 57% of hand lengths, 77% of foot lengths and 71% of heights < − 2 SD for adult patients.
Acromicria or small hand and foot size were found in our patients and supported by a significant negative correlation with age for these measurements. Our data also indicate a deceleration of linear growth (e.g., height, sitting height) with increasing age relative to normal individuals. The average Z score for total hand length was − 1.14 for individuals below 10 years of age and − 2.69 for adult patients, while foot length was − 1.69 for individuals below 10 years of age and − 2.81 for adult patients.
There are few studies on growth data for PWS patients before 1 year of age (Greenberg et al. 1987, Butler et al. 1988, Chitayat et al. 1989). However, measurements were obtained in five of our PWS patients before 1 year of age and these patients had normal birth weight, birth length and head circumferences as well as normal sitting height, and normal hand and foot measurements. Our findings of normal hand and foot size in PWS infants are in agreement with the literature (Greenberg et al. 1987, Chitayat et al. 1989) and indicate the difficulty of using the criterion of small hands and feet as useful diagnostic findings in infants suspected to have PWS. Our data also indicate that hand and foot size was generally normal before 10 years of age while abnormal measurements (< − 2 SD) were observed in the majority of patients after 12 years of age. Short stature (< − 2 SD) was also observed in the majority of PWS patients by 12 years of age, while weight was > 2 SD by 4 years of age. There was no apparent difference identified in onset of these abnormal measurements for either males or females and either deletion or nondeletion PWS patients.
Previous studies have shown that the onset of obesity may be as early as 6 months based on skinfold measurements, but skinfold thicknesses were generally greater in PWS males than females (Butler et al. 1988, Meaney & Butler 1989). Craniofacial analysis has also shown that head circumference and head length were negatively correlated with age and that dolichocephaly may be a useful diagnostic feature of PWS preschool children (Meaney & Butler 1987).
Early diagnosis of PWS is important for medical and dietary management of the patient and for genetic counseling of family members, although the average age of diagnosis ranges between 7 to 9 years of age for this syndrome (Hall & Smith 1972, Bray et al. 1983, Butler et al. 1986, Butler 1990). Interestingly, in our study abnormally small hands and feet and short stature for both sexes were not observed until about 10 to 12 years of age.
In summary, there are sex and age differences but no chromosome status differences in several anthropometric variables, with preschool children having dolichocephaly, while the majority of hand and foot measurements, stature and sitting height were within normal range. Foot size was also smaller than hand size in females when compared with PWS males. However, anthropometric measurements, excluding weight, head length, and ankle breadth, were less than − 2 SD in the adult patients. Abnormal growth patterns apparently exist as evidenced by significant negative correlations with age, particularly in PWS males, for height, sitting height, head circumference, and hand and foot measurements but a significant positive correlation was found for weight in patients below 10 years of age.
Fig. 2.
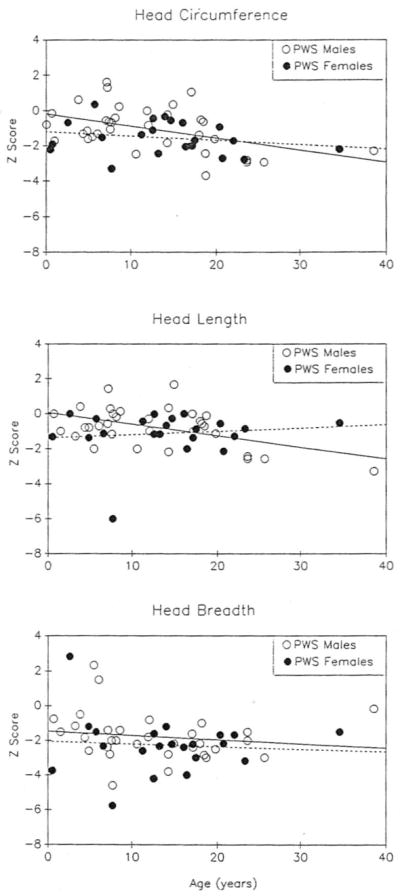
Z score data for head circumference, head length and head breadth plotted against chronological age. Solid and dashed lines are linear regressions for PWS males and females, respectively. There were significant negative correlations (p < 0.05) with age for head circumference (r= − 0.46) and head length (r = − 0.49) in males but not in females.
Fig. 3.

Z score data for total hand length, middle finger length and palm length plotted against chronological age. Solid and dashed lines are linear regressions for PWS males and females, respectively. There were significant negative correlations (p < 0.05) with age for total hand length and (r= − 0.61) and middle finger length (r= − 0.69) in males but not in females.
Fig. 4.

Z score data for hand breadth and wrist breadth against chronological age. Solid and dashed lines are linear regressions for PWS males and females, respectively. There was a significant negative correlation (p < 0.05) with age for hand breadth (r= − 0.66) in males but not in females.
References
- Bray GA, Dahms WT, Swerdloff RS, Fiser RH, Atkinson RL, Carrel RE. The Prader-Willi syndrome: a study of 40 patients and a review of the literature. Medicine. 1983;62:59–80. [PubMed] [Google Scholar]
- Butler MG. Prader-Willi syndrome: current understanding of cause and diagnosis. Am J Med Genet. 1990 doi: 10.1002/ajmg.1320350306. in press. [DOI] [PMC free article] [PubMed] [Google Scholar]
- Butler MG, Palmer CG. Parental origin of chromosome 15 deletion in Prader-Willi syndrome. Lancet. 1983;i:1285–1286. doi: 10.1016/s0140-6736(83)92745-9. [DOI] [PMC free article] [PubMed] [Google Scholar]
- Butler MG, Meaney FJ. An anthropometric study of 38 individuals with Prader-Willi syndrome. Am J Med Genet. 1987;26:445–55. doi: 10.1002/ajmg.1320260224. [DOI] [PMC free article] [PubMed] [Google Scholar]
- Butler MG, Meaney FJ, Palmer CG. Clinical and cytogenetic survey of 39 individuals with Prader-Willi syndrome. Am J Med Genet. 1986;23:793–809. doi: 10.1002/ajmg.1320230307. [DOI] [PMC free article] [PubMed] [Google Scholar]
- Butler MG, Butler RI, Meaney FJ. The use of skinfold measurements to judge obesity during the early phase of Prader-Labhart-Willi syndrome. Int J Obesity. 1988;12:417–22. [PMC free article] [PubMed] [Google Scholar]
- Cassidy SB, Thuline HC, Holm VJ. Deletion of chromosome 15 (q11-13) in a Prader-Labhart-Willi syndrome clinic population. Am J Med Genet. 1984;17:485–495. doi: 10.1002/ajmg.1320170211. [DOI] [PubMed] [Google Scholar]
- Chitayat D, Davis EB, McGillivray BC, Hayden MR, Hall JG. Perinatal and first year follow-up of patients with Prader-Willi syndrome: normal size of hands and feet. Clin Genet. 1989;35:161–166. doi: 10.1111/j.1399-0004.1989.tb02923.x. [DOI] [PubMed] [Google Scholar]
- Feingold M, Bossert WH. Normal values for selected physical parameters: an aid to syndrome delineation. BD:OAS X. 1974:1–16. [PubMed] [Google Scholar]
- Greenberg F, Elder FFB, Ledbetter DH. Neonatal diagnosis of Prader-Willi syndrome and its implications. Am J Med Genet. 1987;28:845–856. doi: 10.1002/ajmg.1320280409. [DOI] [PubMed] [Google Scholar]
- Hall BD, Smith DW. Prader-Willi syndrome. J Pediatr. 1972;81:286–293. doi: 10.1016/s0022-3476(72)80297-x. [DOI] [PubMed] [Google Scholar]
- Ledbetter DH, Mascarello JT, Riccardi VM, Harper VD, Airhart SD, Strobel RJ. Chromosome 15 abnormalities and the Prader-Willi syndrome: a follow-up report of 40 cases. Am J Hum Genet. 1982;34:278–285. [PMC free article] [PubMed] [Google Scholar]
- Mattei MG, Souiah N, Mattei JF. Chromosome 15 anomalies and the Prader-Willi syndrome: cytogenetic analysis. Hum Genet. 1984;66:313–334. doi: 10.1007/BF00287636. [DOI] [PubMed] [Google Scholar]
- Meaney FJ, Butler MG. Craniofacial variation and growth in the Prader-Willi syndrome. Am J Phys Anthropol. 1987;74:459–464. doi: 10.1002/ajpa.1330740405. [DOI] [PMC free article] [PubMed] [Google Scholar]
- Meaney FJ, Butler MG. Characterization of obesity in the Prader-Labhart-Willi syndrome: fatness patterning. Med Anthropol Q. 1989;3:294–305. doi: 10.1525/maq.1989.3.3.02a00080. [DOI] [PMC free article] [PubMed] [Google Scholar]
- Nicholls RD, Knoll JHM, Butler MG, Karam S, Lalande M. Genetic imprinting suggested by maternal heterodisomy in non-deletion Prader-Willi syndrome. Nature. 1989;342:281–285. doi: 10.1038/342281a0. [DOI] [PMC free article] [PubMed] [Google Scholar]
- Nugent JK, Holm VA. In: Prader-Willi Syndrome. Holm VA, Sulzbacher SJ, Pipes PL, editors. Baltimore: University Park Press; 1981. pp. 269–280. [Google Scholar]
- Roche AF, Malina RM. Manual of Physical Status and Performance in Childhood, Vol. 1B: Physical Status. New York: Plenum Press; 1983. p. 1047.p. 1102. [Google Scholar]
- Snyder RG, Schneider LW, Owings CL, Reynolds HM, Gollomb DH, Schork MA. Anthropometry of Infants, Children, and Youths to Age 18 for Product Safety Design SP-450. Warrendale, PA: Society of Automobile Engineers, Inc; 1977. [Google Scholar]
- Weiner JS, Lourie JA. International Biological Programme Handbook. Vol. 9. Oxford: Blackwell Scientific Publications; 1969. Human Biology: A Guide to Field Methods. [Google Scholar]
- Wenger SL, Hanchett JM, Steele MW, Maier BV, Golden WL. Clinical comparison of 59 Prader-Willi patients with and without the 15(q12) deletion. Am J Med Genet. 1987;28:881–887. doi: 10.1002/ajmg.1320280413. [DOI] [PubMed] [Google Scholar]
- Zellweger H, Soper RT. The Prader-Willi syndrome. Med Hygiene. 1979;37:3338–3345. [Google Scholar]