

Abstract
Niemann–Pick disease, type C1 (NPC1) is a neurodegenerative disorder with limited treatment options. NPC1 is associated with neuroinflammation; however, attempts to therapeutically target neuroinflammation in NPC1 have had mixed success. We show here that NPC1 neuroinflammation is characterized by an atypical microglia activation phenotype. Specifically, Npc1−/− microglia demonstrated altered morphology, reduced levels of lineage markers and a shift toward glycolytic metabolism. Treatment with 2-hydroxypropyl-β-cyclodextrin (HPβCD), a drug currently being studied in a phase 2b/3 clinical trial, reversed all microglia-associated defects in Npc1−/− animals. In addition, impairing microglia mediated neuroinflammation by genetic deletion of IRF8 led to decreased symptoms and increased lifespan. We identified CD22 as a marker of dysregulated microglia in Npc1 mutant mice and subsequently demonstrated that elevated cerebrospinal fluid levels of CD22 in NPC1 patients responds to HPβCD administration. Collectively, these data provide the first in-depth analysis of microglia function in NPC1 and suggest possible new therapeutic approaches.
Introduction
Niemann–Pick disease, type C1 (NPC1) is a rare, neurodegenerative disorder characterized by progressive cerebellar ataxia and dementia (1). Classically, NPC1 presents in childhood or early adolescence, but the phenotypic spectrum ranges from a severe neonatal form to an indolent adult-onset disorder (1,2). NPC is caused by mutations in either NPC1 or NPC2 (1). NPC1 functions to transport cholesterol out of the endolysosomal compartment and loss of NPC1 activity results in endolysosomal accumulation of unesterified cholesterol and lipids (3,4). Human NPC1 is recapitulated by the Npc1nih (Npc1−/−) mouse, which expresses an inactive form of NPC1 (5). Npc1−/− mice exhibit progressive movement impairment due to loss of cerebellar Purkinje neurons starting at ∼6 weeks of age and have a severely shortened lifespan of 9–11 weeks. Pathologically, a rostral to caudal loss of cerebellar Purkinje neurons is observed. Npc1−/− mice have increased storage of unesterified cholesterol and gangliosides (6) in the central nervous system (CNS) and liver, like NPC1 patients (3,5). Using the Npc1−/− mouse model, multiple groups have attempted to treat NPC1 neurodegeneration using both candidate drugs (6–9) and gene therapy (10,11). There are currently no FDA approved therapies for NPC1; however, miglustat (Zavesca) is approved for use in Europe and other countries (12). Intrathecal 2-hydroxypropyl-β-cyclodextrin (HPβCD, VTS-270) has been shown in a phase 1/2a study to decrease neurological progression (13) and is currently being evaluated in an international phase 2b/3 trial.
Chronic neuroinflammation and glial cell activation, as previously reported in NPC1 (14), is often accompanied by accumulation of peripheral immune cells into the CNS. This process occurs in several other neurodegenerative diseases including amyotrophic lateral sclerosis (ALS) and Alzheimer disease (AD) as well as other lysosomal storage diseases (LSDs) such as Sandhoff and Batten disease (15–18). These recruited inflammatory cells exacerbate neuronal death and tissue damage through effects of secreted pro-inflammatory cytokines such as IL-6, IL-1β and TNFα (15). Inflammatory markers are significantly upregulated in NPC1 patients relative to controls, most notably the complement protein C3 and chemokine CCL3 (19,20). These same markers are also upregulated in the Npc1nih mouse model (19,20). Targeting these inflammatory pathways, either through cell depletion or cytokine blocking, has been successfully used in several neurodegenerative disorders, including AD, ALS, NPC1 and Sandhoff disease (9,18,21–23).
The immunological hallmark of most neurodegenerative diseases is microgliosis (24). Chronic microglia activation is thought to contribute to the progression of common neurodegenerative diseases such ALS, AD and Parkinson disease (24,25). Microglial activation has been reported in several studies of NPC1 using both patient samples and murine models (14,19,26,27). Suzuki et al. (23) showed that heightened STAT1 activation in microglia contributed to neurotoxicity and crossing the Npc1nih allele onto an IL-6-deficient background significantly increased the lifespan of NPC1 mice. These findings suggest a pathogenic role of inflammation in the NPC1. In contrast, based on genetic deletion of a series of immune mediators Ccl3, C1qa, C3, Mmp12, Bcl2l11, Tlr7 and Unc93b1 that are highly expressed in Npc1 mutant mice, Lopez et al. (19,20) concluded that the inflammatory response in NPC1 is likely a secondary response rather than a primary component in the NPC1 pathological cascade. Cologna et al. (14) also observed that genetic deletion of Ccl3 did not ameliorate pathology in the Npc1−/− mouse. Smith et al. (22) reported decreased brain CD68 staining and increased lifespan in mice treated with ibuprofen alone or in combination with miglustat, suggesting a benefit of targeting neuroinflammation. Thus, it is currently unclear to what degree microglia contribute to NPC1 disease progression and to what degree suppression of microglial activation may impact NPC1 pathology. Therefore, we sought to characterize neuroinflammation in detail and investigate the potential therapeutic benefit by modulating microglial activation in the NPC1 mouse model.
Results
Peripheral immune cells do not accumulate in brain tissue of Npc1−/− mice
Since accumulation of inflammatory immune cells is characteristic of neurodegenerative disorders, we quantified recruitment of CD45hi myeloid and lymphoid cells in the brains of Npc1+/+ and Npc1−/− littermates by flow cytometry (Supplementary Material, Fig. S1). To test whether infiltration of peripheral immune cells is characteristic of LSDs, or specific to NPC1, we also analyzed two other LSDs. The mucolipidosis type IV (Mcoln1−/−) mouse model is similar to NPC1 with respect to neuroinflammation and Purkinje neuron loss (28), while the Fabry (Gla−/−) mouse model exhibits neither neuroinflammation nor neuronal loss (29). We found that Npc1−/− mice did not exhibit significant accumulation of T-cells, neutrophils or monocytes in brain tissue between birth and 9 weeks of age. We did observe a modest, but significant, increase in B-cells after 7 weeks of age in Npc1−/− brain (Supplementary Material, Fig. S1). The total number of non-microglia immune cells (CD45hi) cells in 7-week-old Npc1 mutant mice was similar to that observed in 4-month-old Gla−/− mice. In contrast, we observed a marked increase in B-cells and neutrophils in Mcoln1−/− mice. Consistent with a lack of infiltrating peripheral immune cells in Npc1−/− brain tissue, the blood–brain-barrier of these animals appears to be intact when assessed using Evans blue (Supplementary Material, Fig. S1). Thus, progression of disease in NPC1 mice is not associated with disruption of the blood–brain-barrier or widespread infiltration of inflammatory immune cells into the CNS.
NPC1 expression in peripheral immune cells does not contribute to NPC1 pathology
Microglia are derived from the fetal yolk sac, migrate to the CNS and are radioresistant (30). Thus, their contribution to disease pathology can be distinguished from that of radiosensitive peripheral monocytes/macrophages and other immune cells deriving from the bone marrow using bone marrow chimeric mice. To test whether radioresistant microglia or radiosensitive hematopoietic cells contribute to pathology in NPC1 mutant mice, we generated bone marrow chimeras and assessed disease progression (Supplementary Material, Fig. S2). We found that Npc1+/+ bone marrow does not rescue Npc1−/− recipient animals. Specifically, we did not observe any differences in Npc1+/+→Npc1−/− chimeric animals relative to Npc1−/−→Npc1−/− mice. We also observed no change in motor activity, weight loss or survival in Npc1−/−→Npc1+/+ chimeric animals relative to Npc1+/+→Npc1+/+ mice indicating that peripheral immune cells lacking NPC1 do not contribute to neuropathology. These data collectively show that peripheral inflammatory cells do not contribute to the morbidity and mortality in Npc1−/− mice. Therefore, therapies aimed at reducing neuroinflammation in NPC1 need to be targeted against CNS resident microglia.
Microglia morphology in Npc1−/− mice correlates with disease progression
Upon activation microglia undergo a characteristic change in morphology from a ramified state to a rounded appearance with a decreased number and length of cellular processes (31). We used flow cytometry (Fig. 1A and Supplementary Material, Fig. S3) and fluorescence microscopy (Fig. 1B–C) to analyze the morphology of microglia. Between 3 and 9 weeks of age we found changes in microglia morphology in Npc1−/− mice (Fig. 1A and B). With disease progression, the microglia became more rounded compared to the ramified morphology of Npc1+/+ mice consistent with a shift toward an activated and reactive state. Consistent with the observed morphological changes, microglia processes in Npc1−/− mice were shorter (Fig. 1C) and decreased in number (Fig. 1D).
Figure 1.

Altered microglial morphology in Npc1−/− mice. (A) Representative FACS profiles of microglia isolated from 7-week-old Npc1+/+and 3, 7 or 9-week-old Npc1−/− mice show a progressive shift toward a smaller less ramified (activated) morphology. Inserts show a representative thalamic microglial cell stained with IBA1. For comparison with the Npc1−/− microglia we looked at microglia from 4-month-old Fabry (Gla−/−) and Mucolipidosis IV (Mcoln1−/−) mice. These latter two mutant mice are on a C57BL6 background whereas the NPC1 mice are on a BALB/C background. FACS analysis shows no changes in size and granularity compared to C57BL6 controls for either Gla−/− or Mcoln1−/− microglia. (B) IBA1 staining (green) in the cerebellum, thalamus and frontal cortex for Npc1 control and mutant mice at 3, 7 and 9 weeks of age showing a transition to a less ramified amoeboid morphology. Gla−/− and Mcoln1−/− microglia at 4 months of age appear more ramified than the Npc1 mutant microglia. Scale bar: 20 µm. Quantification of microglial cell projection length (C) and number (D).
To test whether changes in microglia morphology were characteristic of LSDs in general, or specific to NPC1, we also analyzed microglia morphology in two other LSDs. Microglia from Mcoln1−/− mice exhibited less dramatic changes in morphology compared to Npc1−/− mice and, as anticipated, no significant morphological changes were observed in Gla−/− mice (Fig. 1A–D). These data suggest that a lysosomal storage defect alone is not sufficient to trigger a shift toward an amoeboid morphology in Npc1−/− mice.
Npc1 −/− microglia express decreased levels of microglia lineage markers
We next analyzed surface expression of activation and lineage markers of Npc1+/+ and Npc1−/− microglia over the course of disease progression. Npc1−/− microglia had significant reductions in the expression of the classical microglia markers CX3CR1 and CD11b first noted at 7 weeks of age (Fig. 2A and Supplementary Material, Fig. S1), a time point consistent with the appearance of NPC1 symptoms. Expression of microglia activation markers MHCII, F4/80 and CD86 remained unchanged (Fig. 2A). In contrast to NPC1, microglia from Mcoln1−/− mice had a minor decrease in CX3CR1 and increased CD86 and MHCII expression, while Gla−/− microglia were similar to littermate Gla+/+ microglia (Supplementary Material, Fig. S1). Western blot analysis confirmed the decrease in CX3CR1 expression (Fig. 3A).
Figure 2.

Surface marker and biochemical characterization of Npc1 microglial. (A) Microglia surface marker expression was characterized in Npc1+/+ (red) and Npc1−/− (dashed blue) microglia at birth, 3-, 7- and 9-weeks of age. Microglia steady state markers (CD11b, CD45, CX3CR1 and F4/80) and activation markers (CD86 and MHCII) were quantified. (B) GM1 and unesterified cholesterol storage as mean fluorescence intensity (MFI) at birth, 3-, 7- and 9-weeks of age in microglia isolated from Npc1+/+ (red) and Npc1−/− (dashed blue) mice. GM1 and unesterified cholesterol accumulation was quantified by staining isolated microglial cells with Alexa488-labeled cholera toxin and filipin, respectively, n≥3.
Figure 3.

HIF1α activation, glycolytic metabolism and oxidative stress in Npc1−/− microglia. (A) Western blot analysis confirmed lack of NPC1 and decreased expression of CX3CR1 in Npc1−/− microglia. Increased expression of HIF1α, a HIF1α target gene (IGF1) and activation of the MAP kinase pathway (P-SAPK/JNK, SAPK/JNK, P-ERK1/2 and ERK1/2) is consistent with activation of HIF1α signaling. Increased expression of GAPDH is consistent with a switch to a glycolytic metabolism, and increased iNOS expression is consistent with increased oxidative stress in Npc1−/− microglia. Results are representative of ≥6 experiments and β-tubulin is a representative loading control. (B) Immunofluorescence of IBA1 positive (green) microglia confirmed increased IGF1 expression (red) in thalamic tissue from 7-week old Npc1−/− mice. (C) Determination of the extracellular acidification rate (ECAR) confirmed a switch toward glycolytic metabolism in microglia isolated from 7-week old Npc1−/− (blue) mice compared to Npc1+/+ microglia (red). Result is representative of three experiments. Total (D) and mitochondrial ROS production (E) was assayed by DCFDA and MitoSOX staining, respectively. Treatment of control microglia with 1 µM H2O2 served as a positive control. Results are from three independent experiments performed in triplicate. Each sample included 10 000 cells. (F) Western blot and densitometric analysis of HIF1α, P-ERK1/2, ERK1/2 and IGF1 expression in human cerebellar tissue extracts from three NPC1 patients and three age appropriate control subjects. β-tubulin was used as a loading control.
Biochemically, NPC1 is characterized by endolysosomal accumulation of unesterified cholesterol and glycosphingolipids such as monosialotetrahexosylganglioside (GM1) (3,6). To evaluate whether microglia also have these defects, we used filipin and cholera toxin staining to assess accumulation of unesterified cholesterol and GM1, respectively. Although increased over control values, GM1 levels were only significantly increased in Npc1−/− microglia at 9 weeks of age, a time point after the observed microglial morphological and surface markers expression changes (Fig. 2B). Unesterified cholesterol levels were markedly increased in Npc1−/− mice at birth, prior to any detectable changes in microglia morphology or altered expression of surface makers (Fig. 2B). Microglia from Gla−/− and Mcoln1−/− animals did not exhibit any significant increases in GM1 or unesterified cholesterol (Supplementary Material, Fig. S1). The time course differences between unesterified cholesterol and GM1 storage and morphological changes consistent with Npc1−/− microglial activation suggest that activation is a secondary response to the microenvironment rather than a direct cell autonomous consequence of unesterified cholesterol storage since cholesterol storage occurs prior to microglial activation.
Transcriptome analysis of Npc1−/− microglia
Transcriptomic analysis of highly enriched FACS-sorted microglia isolated from Npc1+/+ and Npc1−/− brains was performed (Supplementary Material, Fig. S4 and Table S1). Purity of the isolated microglia was validated by Giemsa staining and IBA1 staining, and analysis of both non-microglia and microglia gene expression levels (Supplementary Material, Fig. S4). Minimal expression of oligodendrocyte (Sox10, Mog, S100), astrocyte (Aldh1I1, Gfap) or neuronal (Mnx1, Isl1, Isl2, Nefl) markers was detected in the microglial RNA preparation. Expression analysis identified 1080 and 738 transcripts with increased and decreased expression, respectively (Supplementary Material, Fig. S4 and Table S1). Consistent with flow cytometry data, we found that several microglia lineage markers (Cx3cr1, Tgfbr1, Tmem119, Olfml3, Itgam and Hexb) were significantly down-regulated in Npc1−/− microglia compared to Npc1+/+. Our data also revealed that Npc1−/− microglia had increased expression of several chemokines and their receptors (Ccl3, Ccl4, Ccl5, Ccl10, Cxcl11, Cxcl14, Cxcl16, Cxcr4), inflammatory mediators (C3, Il1b, Spp1, Tnf) and innate immune signaling receptors (Fcer1g, Fcgr2b, Fcgr4, Fcrl1, Il1r1, Il1rn). Reduced gene expression was noted for CC chemokine receptors (Ccr1, Ccr2, Ccr3, Ccr5, Ccr6), purinergic receptors (P2rx1, P2rx7, P2ry12, P2ry13, P2ry6) and anti-inflammatory cytokines (Tgfb1). Our transcriptome data also showed that several genes involved in innate immunity and phagocytosis (Cd14, Clec7a, Ifitm3, Cd14, Mertk, Vav1) were also significantly differentially expressed in Npc1−/− microglia, indicating that phagocytic function may be altered in Npc1−/− microglia. To determine if phagocytic function was impaired in Npc1−/−microglia, we used a bacterial phagocytosis assay. Although phagocytic activity was increased in Npc1−/− microglia, bactericidal activity was delayed (Supplementary Material, Fig. S5). These data are consistent with data showing that Npc1−/− monocytes also had increased phagocytosis but delayed bactericidal activity (32). The aforementioned data show that Npc1−/− microglia have a markedly altered activation and functional phenotype compared to Npc1+/+. In addition to the neurotoxic pro-inflammatory cytokines and mediators (Cybb, Il1b, Mmp12, Optn, Pde2a and Tnf), neuroprotective factors are also significantly upregulated (Igf1, Igf2, Igf2r, Igf2r, Igf2bp2, Tgfb2, Ttr and Vegfb) (Supplementary Material, Table S1). The high expression of both neurotoxic and neuroprotective genes suggests that microglia may have both detrimental and beneficial effects on NPC1 pathology. A mixed neurotoxic and neuroprotective expression profile was previously reported in ALS mouse models (15).
Npc1 −/− microglia demonstrate a shift toward glycolytic metabolism
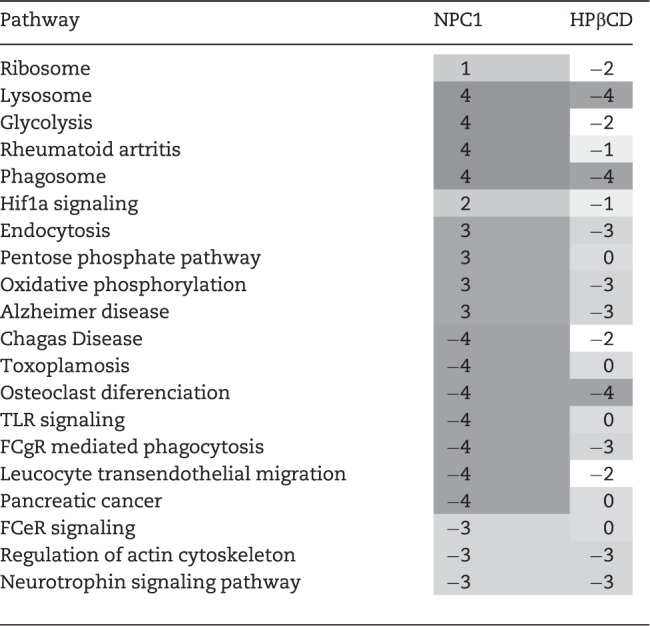
Pathway analysis of our transcriptome data identified upregulation of hypoxia-inducible factor 1-α (HIF1α) signaling and glycolysis in Npc1−/− microglia (Table 1; Supplementary Material, Table S1 and Fig. S6). HIF1α is a regulator of immune cell metabolism and activation, driving a shift toward glycolytic metabolism in activated immune cells (33). Increased HIF1α signaling was confirmed by western blot, which showed increased pERK1/2, pSAPK and IGF1 (a HIF1α target gene) in Npc1−/− microglia (Fig. 3A and B). Notably, we have shown that LGALS3, a HIF1α target gene, is overexpressed in the CNS (19,26) and can be used as a peripheral biomarker for NPC1 (34). Increased expression of genes involved in glycolysis was functionally reflected in increased expression of glyceraldehyde-3-phosphate dehydrogenase (GAPDH) protein (Fig. 3A) and an increase in glycolytic capacity in Npc1−/− microglia (Fig. 3C). Consistent with increased HIF1α signaling and a shift to glycolytic metabolism, we observed enhanced expression of oxidative stress related genes including peroxidases and antioxidants (Supplementary Material, Table S1). Additionally, western blot analysis showed increased expression of iNOS in Npc1−/− microglia (Fig. 3A), and we observed higher reactive oxygen species (ROS) and superoxide production in Npc1−/− microglia, evidenced by increased 2′,7′-dichlorofluorescin diacetate (DCFDA) and MitoSOX staining (Fig. 3D and E, respectively). Increased expression of genes involved in the pentose phosphate shunt pathway (Table 1) is consistent with a cellular response to increase nicotinamide adenine dinucleotide phosphate (NADPH) to counter oxidative stress.
Table 1.
Pathway analysis of differential gene expression in Npc1 mice with or without HPβCD treatment
 |
||
Pathways modified in Npc1 mutant mice and their modulation by HPβCD treatment. Scoring from 1 to 4 based on STRING, g: Profiler, WebGSALT and ConsensusPathDB pathway analysis of the transcriptomic data. Additive values of 1 for each analysis program indicating P<0.01 with respect to pathway enrichment.
To determine if our observations are relevant to patients, we measured pERK1/2, HIF1α and IGF1 protein expression in cerebellar extracts from NPC1 patients and compared them to control samples. Consistent with our mouse data, we found increased activation of the HIF1α signaling pathway in brain tissue from NPC1 patients (Fig. 3F).
To evaluate the role of HIF1α signaling in NPC1 pathology, we inhibited HIF1α with PX-478 and evaluated the effect on microglial activation (Supplementary Material, Fig. S7). PX-478 treatment of Npc1−/− mice reversed NPC1 microglia morphological changes. Npc1−/− microglia from PX-478 treated mice became more ramified with an increase in both process length and number. Surface expression of CX3CR1 expression also increased toward normal and glycolysis was decreased. As expected, in vivo PX-478 treatment decreased expression of HIF1α target genes, resulting in reduced microglial ROS. However, toxic in vivo effects of PX-478 precluded evaluating the effect of HIF1α inhibition on Npc1−/− mouse survival.
2-Hydroxypropyl-β-cyclodextrin treatment reverses microglia defects
HPβCD has been shown to decrease intracellular cholesterol and lipid accumulation, delay Purkinje neuron loss and increase lifespan in mouse (6,8) and cat (35) NPC1 models. It also has been shown to significantly decrease disease progression in a phase 1/2a trial (13). Consistent with prior publications, we observed a significant increase (P < 0.01) in survival of Npc1−/− mice treated with 4000 mg.kg−1 subcutaneous HPβCD starting at either 7 or 21 days of life (134 ± 33 or 91 ± 7 days, respectively), compared to mice treated with carrier alone (71 ± 6 days), and we also observed significant (P < 0.01) preservation of Purkinje neurons in lobules I–V (Supplementary Material, Fig. S8).
To determine if the efficacy of HPβCD could be partly attributed to amelioration of microglia activation, we analyzed microglia in 7-week-old animals treated for 6 weeks with HPβCD. Microglial morphology was restored to a ramified, resting appearance in HPβCD treated Npc1−/− mice (Fig. 4A and B;Supplementary Material, Fig. S8). We also observed a decrease in CD68 following HPβCD treatment (Fig. 4C), as previously reported (6). HPβCD treatment also restored expression of microglia surface markers CD11b and CX3CR1, and significantly decreased unesterified cholesterol storage (Fig. 4D and Supplementary Material, Fig. S8). There was a non-significant decrease in GM1 storage at this age. Furthermore, HPβCD reduced ROS in Npc1−/− microglia (Fig. 4E), and transcriptome analysis demonstrated that HPβCD treatment normalized the gene expression profile in Npc1−/− microglia (Fig. 4F). Pathway analysis demonstrated that neither HIF1α signaling nor glycolytic metabolism remained elevated in the HPβCD treated microglia (Table 1).
Figure 4.

Effect of HPβCD treatment on Npc1−/− microglia. (A) Representative FACS analysis of 7-week-old Npc1+/+ and Npc1−/− mice injected twice a week with either phosphate buffered saline (PBS) or HPβCD starting at day of life 7. Cell size (FSC-A) and granularity (SSC-A) returned toward normal in the HPβCD compared to PBS treated mutant mice. (B) IBA1 staining (green) in the cerebellum, thalamus and frontal cortex of 7-week-old Npc1+/+ and Npc1−/− mice treated with either PBS or HPβCD is consistent with a less activated morphology in the HPβCD treated mice. Scale bar: 20 µm. (C) IBA1 (green), CD68 (red) double staining in the thalamus tissue from 7-week-old Npc1+/+ and Npc1−/− mice treated with either PBS or HPβCD demonstrates decreased microglial activation in HPβCD treated Npc1−/− mice. Scale bar: 20 µm. (D) FACS analysis of CD11b, CX3CR1, unesterified cholesterol and GM1 levels in microglia from Npc1+/+ treated with PBS (red line) and from Npc1−/− treated with either PBS (light blue shading) or HPβCD (dark blue line). (E) Total ROS production, ascertained by DCFDA staining of isolated microglia from 7-week old control and mutant mice, confirms decreased ROS in HPβCD treated mutant mice. Results are from three independent experiments with ≥3 samples per experiment. Each sample consisted of 10 000 microglial cells. (F) Microglial gene expression changes comparing Npc1−/− mice treated with PBS (dark blue) or HPβCD (light blue) versus Npc1+/+ injected with PBS and HPβCD. The 207 genes with padj<0.01 in both comparisons, are shown.
NPC1 patients are typically diagnosed after manifestation of neurological problems. Thus, to model the clinical situation, we also explored the effect of initiating HPβCD therapy at 3 weeks of age, rather than at 1 week of age (Supplementary Material, Fig. S8). Initiating HPβCD at 3 weeks of age was less effective with respect to survival. However, survival was still significantly increased over the vehicle control [Npc1−/− phosphate buffered saline (PBS) versus Npc1−/− HPβCD (day 21) 70.7 ± 6.4 versus 91.1 ± 7.5 days, P < 0.01]. Initiation of HPβCD at 3 weeks of age also significantly decreased Purkinje neuron loss in lobules III and IV/V. However, delayed administration of HPβCD was not as effective in ameliorating the aberrant Npc1−/− microglial activation. CD11b surface expression remained similar to what was observed in untreated animals and the increase in CX3CR1 surface expression was less robust. In contrast to the marked reduction of unesterified cholesterol storage when treatment was initiated at 7 days, we only observed a 13% reduction in unesterified cholesterol (P = 0.09). These data indicate that earlier therapy with HPβCD treatment has a greater impact on microglial activation.
Inhibiting microglia activation slows disease progression
Microglia activation is driven by several key transcription factors, particularly IRF8 (36,37). Irf8 is a critical regulator of microglial activation and Irf8 is not expressed in either neurons or astrocytes (36). Irf8 mutant mice have a reduced number of microglia which do not transition from a resting state to a reactive phenotype secreting pro-inflammatory cytokines (36,37). Therefore, to further evaluate the role of microglia in NPC1 pathology, we compared Npc1−/−: Irf8+/+ mice to Npc1−/−: Irf8−/− mice. We observed that the microglia in the Npc1−/−: Irf8−/− mice had significantly increased expression of CD11b and CX3CR1 (Fig. 5A and B) and microglial morphology approaching normal (Fig. 5C–E). The Npc1−/−: Irf8−/− mice survived on average 74.7 ± 1.7 days, compared to 63.3 ± 1.3 days for Npc1−/−: Irf8+/+mice (Fig. 5F). This significant 15% increase in survival was associated with ∼2-week delay in the onset of neurological impairment, ascertained by rearing counts (Fig. 5G), as well as a small delay in weight loss (Fig. 5H). Pathological analysis at 7 weeks of age suggested delayed loss of Purkinje neurons in Npc1−/−: Irf8−/− mice compared to Npc1−/−: Irf8+/+mice (Fig. 5I). Collectively, these data show that targeting microglia activation can delay neuronal loss, slow disease progression and increase lifespan in NPC1 mice. Thus, targeting microglial activation may be an effective therapeutic modality for NPC1 patients.
Figure 5.

Characterization of Npc1−/−: Irf8−/− double mutant mice. Surface expression of CD11b (A), and CX3CR1 (B), increases toward normal in Npc1−/−: Irf8−/− mice. Data expressed as the MFI±SD, n>6/group. (C) Representative microglia morphology on IBA1 stained brain sections. Microglia from 7 week Npc1−/−: Irf8−/− mice have a more ramified (less activated) appearance than microglia from Npc1−/−: Irf8+/+mice. This was confirmed by quantification of projection number (D) and projection length (E). Data expressed from n≥6/group. (F) Kaplan–Meier survival analysis demonstrates significant increased survival of Npc1−/−: Irf8−/− (black circles, n =29) mice compared to Npc1−/−: Irf8+/+ (blue circles, n=32) mice. (G) Rearing counts per 5 min were obtained for Npc1+/+: Irf8+/+ (red), Npc1−/−: Irf8+/+ (blue), Npc1+/+: Irf8−/− (gray) and Npc1−/−: Irf8−/− (black) mice. Rearing counts were significantly different for Npc1−/−: Irf8−/− relative to Npc1−/−: Irf8+/+ after 7 weeks. n= 6 for all genotypes. (H) Weight gain and loss was similar for Npc1−/−: Irf8−/− (blue) and Npc1−/−: Irf8+/+ (black) mice. (I) Cerebellar Purkinje neuron counts at 7 weeks in lobules I/II, III, IV/V and VI. Data are from n=6 for all genotypes.
sCD22 is a novel biomarker related to microglial activation
Transcriptome analysis revealed a significant increase in the expression of Cd22 in Npc1−/− microglia (Fig. 6A). In the CNS, CD22 is expressed by neurons and modulates microglia activation (38). Increased expression of CD22 has been previously reported in aged microglia, indicating that CD22 can be found in microglia and may be a marker of microglia dysfunction (15). Alternatively, it could indicate the presence of residual phagocytized CD22+ neurons in the isolated microglia. Co-expression of CD22 in IBA1 positive microglia from Npc1−/− mice was confirmed (Fig. 6B and C), but CD22 was not observed in Npc1−/− microglia from HPβCD treated mice (Fig. 6B), in which significantly less Cd22 transcripts were found (Fig. 6C). These data suggested that CD22 might have utility as a biomarker to monitor microglial activation in patients. Indeed, we found that the mean concentration of soluble CD22 (sCD22) was significantly increased (P < 0.001) in cerebrospinal fluid (CSF) from NPC1 patients compared to sCD22 levels in CSF from age-matched controls (1.58 ± 0.26 versus 1.18 ± 0.04 ng.ml−1, respectively; Fig. 6D). The NPC1 patient CSF sCD22 levels did not correlate with total or age adjusted neurological severity scores (39); however, they decreased toward normal in response to administration of intrathecal VTS-270 (a specific formulation of HPβCD). Comparing CSF samples prior to VTS-270 therapy to samples obtained after 18 months of therapy, we found a significant decrease (P < 0.01) in post-treatment sCD22 levels (Fig. 6E). These data suggest that sCD22 may be a useful neuroinflammatory biomarker for monitoring therapeutic interventions.
Figure 6.

Characterization of CD22 expression as a biomarker for microglial activation in NPC1. (A) Volcano plot analysis of our transcriptome data. Y axis is the −Log10 transformation of the P adjusted value and the X axis is the Log2 fold change in expression in Npc1−/− relative to Npc1+/+ microglia. (B) CD22 (green) and IBA1 (red) double immunofluorescence staining of thalamic tissue from 7-week-old Npc1+/+ and Npc1−/− mice treated with either PBS or HPβCD. Scale bar is 50 µm. (C) Normalized mRNA expression read counts for Cd22 in 7-week-old microglia from Npc1+/+ and Npc1−/− mice treated with PBS (-) or HPβCD (+). Data are from n=5. (D) ELISA quantification of soluble CD22 (sCD22) in human cerebrospinal fluid (CSF) from NPC1 patients (1.58±0.26, n=18) and age similar control samples (1.18±0.01; n =10). (E) CSF sCD22 levels decrease toward normal in 11 NPC1 patients after 18 months of intrathecal VTS-270 (HPβCD) treatment. *P<0.01, Wilcoxon paired test.
Discussion
Neuroinflammation is a common feature of neurodegenerative diseases (15,16). However, the contribution of immune cells to NPC1 disease pathogenesis and progression is not clear (9,14,19,20,23,27,40,41). Previous studies have shown that Npc1−/− microglia express increased levels of neurotoxic molecules such as TNFα (14), whereas other studies reported no measurable neurotoxic effects of Npc1−/− microglia using co-culture experiments (40). Lopez et al. (19,20) found that genetic deletion of C3 and CCL3, two potentially neuroinflammatory mediators with increased expression in NPC1 brain tissue, had no effect on CNS disease progression. Cologna et al. (14) reported a similar result for CCL3. In contrast, deletion of inflammatory cytokine IL-6 modestly increased lifespan, but did not prevent loss of Purkinje neurons (23). To understand the role of microglia in NPC1 pathology we characterized Npc1−/− microglia during NPC1 disease progression and explored the potential of therapeutically targeting neuroinflammation.
In contrast to other lysosomal storage disorders such as Sandhoff (42), mucolipidosis type IV (17) or Batten disease (16) where recruited inflammatory cells play a significant role in disease progression, we did not observe CNS infiltration of monocytes, T-cells or neutrophils in NPC1. We did observe a negligible (∼2000 cells/brain) and highly variable increase in B-cells. Combined with our bone marrow transplant experiments, these data show that neuroinflammation in NPC1 is due to the microglia. The lack of a role for peripheral immune cells in NPC1 also explains why deletion of Mip1α has a significant impact on pathological progression in the Sandhoff mouse (42) but is ineffective in NPC1 (14,19).
Although the Npc1 mutant microglia demonstrate a classical activated cellular phenotype with progressive change from a ramified appearance to a rounded amoeboid morphology, the Npc1−/− microglia demonstrate a non-conventional polarization with decreased expression of lineage makers (CD11b and CX3CR1), unchanged expression of activation markers (MHCII, F4/80, CD86) and mixed expression of neurotoxic and neuroprotective genes. Morphological changes and altered expression of CD11b and CX3CR1 become apparent after 3 weeks of age. However, significant storage of unesterified cholesterol is present at birth, prior to microglial activation. These data suggest that accumulation of unesterified cholesterol is not sufficient to trigger microglial activation and suggest that other activating signals, such as neuronal cell death, are necessary to induce neuroinflammation. Consistent with this hypothesis, we and others have observed microglial activation at sites of neuronal cell death (8,43). The mixed expression of both neurotoxic and neuroprotective genes suggests that microglia may have both beneficial and detrimental roles in NPC1 pathology. This would be consistent with the concept that neuroinflammation may be a two-edged sword in neurodegenerative diseases (15,24) and conflicting contribution to pathology could potentially limit the efficacy of therapies designed to directly modulate microglial activation.
Performing transcriptome analysis on purified microglia allowed us to identify microglial functional defects in a more specific and comprehensive way than previous approaches using cultured microglia or complete brain tissue (19,26). We identified a shift toward glycolytic metabolism in Npc1−/− microglia mediated by HIF1α signaling. This glycolytic metabolic signature has also been reported in tissues from other neurodegenerative diseases and following in vitro activation of microglial cells (25,44), indicating that this glycolytic shift may be a general marker of microglia activation, as previously shown for other myeloid cells (33). We could confirm that HIF1α signaling plays a functional role in Npc1−/− microglial activation by inhibiting HIF1α with PX-478. Unfortunately, toxic effects of general HIF1α inhibition lead to significant weight loss (45) and blocking of pro-survival signals in neurons (46), preclude evaluating the potential benefit of HIF1α inhibition on neurological function and survival in the Npc1 mutant mouse model.
HPβCD has previously been shown to delay onset of neurological manifestations and death in NPC1 animals (6,8,35), and slow disease progression in a phase 1/2a trial (13). We thus explored the effect of HPβCD treatment on microglial activation in Npc1 mutant mice. HPβCD decreased microglia activation as evidenced by changes in morphology, normalization of immune marker expression, decreased ROS and normalization of gene expression. Consistent with prior studies, early treatment with HPβCD initiated on DOL 7 is more efficacious than therapy initiated after weaning. This is true with respect to survival and markers of microglial activation. These data suggest that therapies directed against neuroinflammation need to be initiated early and perhaps prior to neurological manifestations being apparent.
Although microglial cholesterol storage and activation are decreased by treatment with HPβCD, these experiments do not distinguish between a primary effect of HPβCD on Npc1−/− microglia and a secondary effect on microglial activation due to delayed neuronal loss. To gain insight into the direct contribution of microglia activation on NPC1 neuropathology, we studied Npc1−/−: Irf8−/− mice. Loss of IRF8 function in Irf8 mutant mice results in a significant decrease in number of microglia in the CNS and impaired activation of remaining microglia (36). We found that Npc1−/−: Irf8−/− double mutant mice had delayed loss of Purkinje neurons, delayed onset of neurological signs and prolonged lifespan compared to Npc1−/−: Irf8+/+ mice. Since Irf8 expression is limited to microglia in the CNS, this suggests a direct role of microglia in NPC1 disease progression that may be amendable to therapeutic intervention. Our current data do not exclude either a primary or secondary contribution of astrocytes to NPC1 neuroinfammatory pathology. Therapeutic interventions that broadly reduce inflammation in NPC1 have shown mixed results. Administration of minocycline (27) did not affect disease progression whereas ibuprofen (22) and necrostatin-1 (43) significantly increases the lifespan of Npc1−/− mice. These mixed results may be consistent with our transcriptome analysis indicated that Npc1−/− microglia are neither strongly pro-inflammatory (neurotoxic) or anti-inflammatory (neuroprotective). Additional work will be necessary to determine the pathways controlling microglial activation and polarization in NPC1 to specifically target the deleterious aspects of neuroinflammation. Recent advances in single cell RNA-seq have demonstrated the existence of a microglia subpopulation associated with neurodegenerative disease with a similar gene expression profile as observed in Npc1−/− microglia (47). Disease associated microglia markers Axl, Apoe, Cd9, Cst7, Ctsb, Ctsl, Clec7a, Csf1, Ctsd, Itgax, Ldl, Timp2, Trem2 and Tyrobp are decreased in VTS-270 treated animals, supporting the efficacy of the drug preventing the change in microglia properties and further application in neurodegenerative diseases. Single cell RNA-seq in vehicle and treated animals may provide supporting additional evidence of the treatment efficacy in vivo.
Biomarkers are tools which can provide pathological insight into potential therapies. We identified sCD22 as a biomarker that may be useful to monitor neuroinflammation in NPC1. Although there is some overlap with our control population, this biomarker is likely to be useful in the majority of cases. CD22 is normally expressed by neurons and functions to prevent microglial activation (38). Thus, increased CD22 mRNA in Npc1−/− microglia may be an indicator of increased phagocytosis of neurons. Consistent with our observations of increased activation and phagocytic capacity in Npc1−/− microglia, we observed significantly elevated sCD22 levels in CSF from NPC1 patients. Notably, we also found that CSF levels of sCD22 decreased significantly in NPC1 patients treated with intrathecal VTS-270. These data, combined with our prior data (13), suggest that intrathecal VTS-270 therapy reduces neuroinflammation in parallel with a reduction in CSF markers of neuronal damage and a decrease in the rate of neurological disease progression.
The data presented in this paper demonstrate a mixed pattern of microglial activation in NPC1, show that microglial activation contributes to neurological disease progression, and suggest that its modulation may have beneficial effects as part of a combined therapy to treat NPC1. Furthermore, we could translate this work to patients by identifying a novel biomarker, sCD22, that may provide useful in monitoring the response of neuroinflammation to therapeutic interventions.
Materials and Methods
Antibodies and reagents
Unless otherwise specified, antibodies and reagents were obtained from Thermo Fisher Scientific, Waltham, USA.
Mouse models and drug treatment
All mouse experiments were approved by the NICHD Animal Care and Use Committee. To account for potential variability due to mouse background, all experiments were conducted using control mice obtained from the same crosses used to obtain mutant mice. BALB/cNctr-Npc1m1N/J (Npcnih) mice were obtained from The Jackson Laboratory (Bar Harbor, ME). Mutant (Npc1−/−) and littermate control (Npc1+/+) mice were obtained by intercrossing heterozygous Npc1+/- mice. Fabry (Gla−/−) mice were provided by Dr. Ashok Kulkarni (29) and mucolipidosis type IV (Mcoln1−/−) were obtained from Dr. James Pickel (28). Both the Gla and Mcoln1 mutations were maintained as heterozygotes on a C57BL6 background and intercrossed to obtain mutant and control littermates. C57BL6 Irf8−/− mice (37) were crossed with BALB/C Npc1+/- mice to obtain Npc1+/-: Irf8+/- mice that were subsequently intercrossed to obtain Npc1−/−: Irf8+/+ and Npc1−/−: Irf8−/− mice. PX-478 (Selleckchem, Houston, USA) 60 mg.kg−1, was injected intraperitoneally every other day. HPβCD (parenteral grade Kleptose HPB: Roquette, Vacquemont, France) was administered by subcutaneous injection at a dose of 4000 mg.kg−1. The first HPβCD dose was administered either on day of life 7 or after weaning on day of life 21. Subsequent dosing was three times per week starting on DOL9 or DOL23. PBS injections were performed on the same group size of animal as vehicle control. Mice were euthanized in a CO2 chamber and then transcardially perfused with PBS for biochemical and molecular analysis or with 4% paraformaldehyde solution to fix the tissue prior to pathological analysis. For survival experiments, mice were euthanized at a humane end-point (weight loss >30% of peak weight, hunched posture and reluctance to move and inability to remain upright when moving forward). Loss of motor function was ascertained by rearing counts as previously described (9). Briefly, mice were acclimatized to a clean cage for 30 min and then observed for a period of 5 min. Spontaneous rearing, with or without support of the cage wall was recorded manually.
Human participants
NPC1 patients were enrolled in a longitudinal Natural History protocol (NCT00344331) or a phase 1/2a trial of intrathecal VTS-270 (NCT01747135) at the NIH Clinical Center. These clinical protocols were approved by the NICHD Institutional Review Board. Informed consent was obtained from guardians or participants. Assent was obtained when applicable. CSF was collected by lumbar puncture and stored at −80°C. Control CSF was obtained from 30 gender and age-matched patients who were undergoing cerebrospinal collection for another clinical indication. Four control patients were febrile (>38.5°C) at the time of CSF collection, but none had elevated white blood cell count or positive cultures. Age of control subjects ranged from 2 weeks to 20 years at the time of CSF collection. Human post-mortem tissue was obtained from the NICHD Blood and Tissue Bank (http://medschool.umaryland.edu/btbank/) and processed for western blot analysis as previously described (14).
Generation of bone marrow chimeras
Femurs and tibias from donor 6- to 8-week-old Npc1+/+ and Npc1−/− mice were removed aseptically and bone marrow flushed out using ice-cold PBS (Sigma Aldrich, St Louis, USA) supplemented with 2 mM ethylenediaminetetraacetic acid (EDTA) (Sigma). Bone marrow cells were counted using Trypan Blue exclusion, and 3–5×10⁶ cells injected intravenously into 3- to 4-week-old recipient Npc1+/+ and Npc1−/− mice. Recipient mice were first irradiated with two doses of 400 RAD, given 4 h apart. Bone marrow injections were performed 24 h following the second irradiation. Mice were given trimethoprim/sulfamethoxazole in the drinking water for the first 4 weeks of reconstitution and then switched to antibiotic-free water. Motor function and weight were assessed twice a week until sacrifice of the animal, 10 weeks post-irradiation or until they reach disease end-point and were sacrificed.
Microglia isolation, FACS sorting and analysis
Microglia were isolated and analyzed as previously describe with minor modifications (48). Mice were sacrificed using CO2, before cardiac perfusion with 25 ml of ice-cold PBS. Brain were removed without the spinal cord and suspended and triturated in ice-cold FACS buffer [PBS containing 0.5% BSA (Sigma)] using syringe plunger. Microglia were separated from neurons using a discontinuous Percoll gradient 30–70% (GE healthcare, Chicago, USA). Microglia at the 70% interphase were collected, washed twice in FACS buffer and stained with fixable LIVE/DEAD fluorescent or pacific blue dye (UV–blue L-23105 or Violet L-34955) for 10 min (1:500) in PBS at 4°C and then incubated with rat anti-mouse CD16/32 (2.4G2; BD Biosciences, San Jose, USA) for 10 min (1:100) in FACS buffer at 4°C to block Fc receptors. For staining of surface antigens, cells were incubated with fluorochrome-conjugated [FITC, PE, PE-Cy7, allophycocyanin (APC), APC-Cy7, APC-eFluor 780, Alexa Fluor 700, eFluor 450, eFluor 605 NC or PerCP-Cy5.5] antibodies against mouse CD45 [(Ly-5), Biolegend, San Diego, USA], CD45.1 (A20), CD45.2 (clone 104), Ly6C [(AL-21), Biolegend], Ly6G (1A8), F4/80 [(BM8), Biolegend], CD11b [(M1/70), Biolegend], MHCII (M5/114.15.2), CD3e [(145–2C11), Biolegend], CD19 [(1D3), Biolegend], CX3CR1 (FAB5825P, R&D System, Mineapolis, USA), CD22 [(OX-97), Biolegend]. Intracellular staining for GM1 and unesterified cholesterol were performed on LIVE/DEAD (violet), CX3CR1, CD45, CD11b fixed for 20 min using the cytofix/cytoperm buffer [Beckton Dickinson (BD), Franklin Lakes, USA] and washed two times with BD wash buffer. Filipin 0.1% (m/v) (Polyscience, Warrington, USA) and FITC-conjugated cholera toxin (1/300) were incubated for 2 h at 4°C before being washed twice with BD wash buffer. After three washes with FACS buffer, stained cells were fixed using 2% paraformaldehyde prior analysis. Stained sample were analyzed using a LSR Fortessa (BD) and the data analyzed using FlowJo software (TreeStar, Ashland, USA). Only single cells were analyzed, and cell numbers were quantified using PE-conjugated fluorescent counting beads (Spherotech, Lake Forest, USA). The FACS strategy is presented in Supplementary Material, Figure S3.
Quality of the cell isolation method was evaluated by Giemsa (Sigma) staining or IBA1 (Wako, Richmond, USA) staining on cells isolated and cytospin on gelatin coated slide (SouthernBiotech, Birmingham, USA). Between 92 and 97% of the sorted cells were IBA1 positive by manual counting of the cells after cytospin under epifluorescence microscope Zeiss Axioskope (Carl Zeiss, Oberkochen, Germany).
RNA extraction, RNA-seq and RT-PCR
Triple positive (CX3CR1, CD45 and CD11b) live cell was isolate using FACS Aria 3 (BD). Cells were collected in 200 μl of FACS buffer, spun at 1000 g for 10 min at 4°C, cell pellet was frozen in 700 μl TRIzol. Reagent were allowed to defrost at room temperature, 200 μl chloroform (Sigma) was added and mix for 15 s. Aqueous phase after 15min centrifugation at 12 000g at 4°C was mixed with anhydrous ethanol. Solution was loaded onto RNeasy micro plus column (Qiagen, Hilden, Germany) and then total RNA was purified according to manufacturer instruction. Elution product concentration and quality was evaluated using qubit and PicoChip Bioanalyzer. RNA-seq libraries were constructed using SMARTer Stranded Total RNA-Seq Kit—Pico Input Mammalian (Takara Bio USA, Inc. Mountain View, USA). In brief, 2 ng total RNA from each sample was fragmented, reverse-transcribed to cDNA, and then adapters for Illumina sequencing (Illumina, San Diego, USA) (with specific barcode) were added through polymerase chain reaction (PCR) using only a limited number of cycles. The PCR products are purified, and then ribosomal cDNA was depleted using probes specific to mammalian rRNA. The cDNA fragments were further amplified with primers universal to all libraries. These libraries were pooled together and sequenced using Illumina HiSeq 2500 to generate ∼40 million 2×100 paired-end reads for each sample. The raw data were demultiplexed and analyzed further. Sequence alignment was performed using RNA-STAR (49). Quantitation with subread featureCounts (50) and comparisons of expression with DESeq2 (51). RNAseq data are available from the NCBI, NIH Gene Expression Omnibus (GEO) database (GSE109083).
The following TaqMan assays were used to assess the relative expression level of: Lgals3 (Mm00802901_m1), Gapdh (Mm03302249_g1) Igf1 (Mm00439560_m1) Hprt (Mm03024075_m1) on cDNA as previously describe (34).
Measurement of reactive oxidative stress
DCFDA (Sigma-Aldrich, St. Louis, USA) or MitoSOX red staining was performed according to manufacturer instruction. In Brief, 10 000 cells were seeded per well just after isolation and allowed for 2 h to attach on the bottom of fluorescence 96-well plate wells (Sigma), cells were washed twice with 100 μl PBS and stained for 30 min with1 μl of 2 mM DCFDA or 0.5 μl of MitoSOX solution were added per well and 96-well plates were red on and automated plate reader (485 nm; 528 nm).
Measurement of energy metabolism
Real-time measurements extracellular acidification rates, a measure of lactate production, were performed on an XF96e Seahorse extracellular flux analyzer (Agilent Technology, Savage, USA) according to manufacturers’ instructions. Measurement were performed on 10 000 cells per wells.
Western blot and ELISA
Total proteins were extracted from isolated microglia, human cerebellar tissue and mouse tissues using radioimmunoprecipitation assay (RIPA) buffer (50 mM Tris–HCl, pH7.4, 1% NP-40, 0.5% sodium deoxycholate, 0.1% SDS, 150 mM NaCl, 2 nM EDTA, 40 mM NaF, 0.2 mM Na3VO4) with complete protease inhibitor cocktail (Roche, Basel, Switzerland). Protein amounts were determined using the DC assay (Bio-Rad Laboratories, Hercules, USA). Protein lysates (typically 5–20 μg) were loaded onto a 4–12% gradient NuPAGE Gel, and electrophoresis was carried out at a constant 120 V. Protein transfer was performed using the iBLOT2 dry transfer setup (25 V, 12 min). Following transfer, nitrocellulose membranes were incubated in a 2% BSA and PBS 0.1% Tween 20 blocking buffer for 1 h at room temperature, followed by incubation with the primary antibody at 4°C overnight. After the initial incubation, the membrane was rinsed and incubated with the appropriate secondary antibody for 1 h at room temperature. Membrane development was carried out using the Bio-Rad Chemiluminescence Detection Kit (Bio-Rad Laboratories). Primary antibodies used include: IGF1 (1/1000, Abcam, Cambridge, UK), ERK1/2 [1/1000, Cell Signaling Technology (CST), Denver, USA], Phospho-ERK1/2 (1/1000, CST), HIF1 (1/800, Sigma), CX3CR1 (1/1000, Biolegend), CD68 (1/1000, Sigma), iNOS (1/800, Sigma), GAPDH (1/2000, CST), β-tubulin (1/2000, Sigma), H3 (1/1000, Abcam), SAPK/JNK (1/1000, CST), P-SAPK/JNK (1/1000, CST), anti-mouse HRP, anti-goat HRP or anti-rabbit IgG HRP (1/20 000, Sigma). ELISA anti-sCD22 (Antigenix, Huntington Station, USA) was performed according to manufacturer instructions.
Immunofluorescence
Brain cerebellar tissue was processed as described. Mice were euthanized weeks by CO2 asphyxiation and transcardialy perfused with ice-cold 4% paraformaldehyde in PBS, pH 7.4. The brains were post-fixed in 4% paraformaldehyde solution for 24 h and then cryoprotected in 30% sucrose (Sigma). Cerebellar tissues were cryostat-sectioned parasagittally (20 μm) and floating sections were collected in PBS with 0.25% Triton X-100 (Sigma). Sections were incubated overnight at 4°C with mouse anti-calbindin (1/1000, Sigma), rabbit-anti IBA1 (1/200, Wako), rat anti-CD11b (1/100, Sigma), rat-anti CD68-PE (1/100, FA-11, Biolegend), Hoechst3342 (1/5000, and rat anti CD22 (1/500, OX97, Biolegend). Detected using Dy-Ligh-488 or Dy-Light-594 goat anti-mouse IgG (Vector, Burlingame, USA). Images were taken using a Zeiss Axio Observer Z1 microscope fitted with an automated scanning stage, Colibri II LED illumination and Zeiss ZEN2 software using a high-res AxioCam MRm camera and a 20 × objective. Each fluorophore channel was pseudo-colored in ZEN2, exported as JPEG, and analyzed using ImageJ (52). Purkinje cells were counted by measuring the number of calbindin positive Purkinje cell bodies with the recognizable dendritic tree or axonal projection still remaining within a given cerebellar lobule. The data were expressed as the number of Purkinje cells per 100 µm of Purkinje cell layer: granule cell layer interface. The entire lobule was counted per section, with 3 sections counted per brain.
Assessment of blood–brain-barrier integrity
A 2% solution of Evans Blue (Sigma) in normal saline (4 ml.kg−1 of body weight) was injected intraperitoneally. Sample where analyzed as detailed previously (53).
Phagocytosis
Bacterial uptake and intracellular survival and replication were tested with the non-pathogenic Escherichia coli DH10b. Bacteria were freshly grown in Luria broth media at 37°C and used at exponential growth phase. Total of 10 000 FACS-sorted live microglia in 96-well flat bottom plates were infected at a multiplicity of infection of 10 bacteria per cell. At 1 h post-infection, new complete medium supplemented with 100 µg/ml gentamicin was added. At 3, 7, 15 and 23 h post-infection the cells were washed and lysed in 1% Triton X-100 in deionized water to determine the number of colony-forming units (CFU) recovered from the lysed microglia on Luria broth agar plates.
Statistical analysis
Results are presented as mean ± SEM unless specified. Mann–Whitney U-test was used to compare between two groups. Differences were considered significant if the nominal P-value was *P < 0.05, **P < 0.01 and ***P < 0.001. Statistical calculations were performed using GraphPad Prism software (San Diego, USA). Heatmap and clustering were performed with Morpheus https://software.broadinstitute.org/morpheus/.
Pathway analysis
Pathway analysis were performed using: WebGSALT (54), g:Profiler (55), STRING (56) and ConsensusPathDB (57). Default settings were used for all four web resources. A significant enrichment for a pathway was set with P < 0.05.
Supplementary Material
Supplementary Material is available at HMG online.
Supplementary Material
Acknowledgements
We would like to thank both the NHLBI and NIAID flow cytometry cores for assistance with the microglia isolation and the NICHD Molecular Genomics Core for library preparation and sequencing. Additionally, we appreciate the contribution of both the NICHD and NIAID animal facilities for technical assistance and animal husbandry, and Bill Pavan’s critical review of the manuscript. We would also like to thank our clinical team and the dedicated individuals who contributed to both the Natural History and phase 1/2a study. Finally, we would like to express our appreciation to the guardians and patients who have participated in our clinical trials.
Conflict of Interest statement. None declared.
Funding
This work was supported by the intramural research programs of the Eunice Kennedy Shriver National Institute of Health and Human Development (AC, JRI, AS, HW, CAW, NXC, NYF, KO, FDP) and the National Institute of Allergy and Infectious Diseases (ARD, ALC, MSL). Intramural grant numbers HD000139 and AI001175, respectively. Support was also provided by the Ara Parseghian Medical Research Foundation (AC, FDP) and Dana's Angels Research Trust (HW).
References
- 1. Vanier M.T. (2010) Niemann-Pick disease type C. Orphanet J. Rare Dis., 5, 16. [DOI] [PMC free article] [PubMed] [Google Scholar]
- 2. Patterson M.C., Mengel E., Wijburg F.A., Muller A., Schwierin B., Drevon H., Vanier M.T., Pineda M. (2013) Disease and patient characteristics in NP-C patients: findings from an international disease registry. Orphanet J. Rare Dis., 8, 12. [DOI] [PMC free article] [PubMed] [Google Scholar]
- 3. Pentchev P.G., Gal A.E., Boothe A.D., Fouks J., Omodeo-Sale F., Brady R.O. (1980) A lysosomal storage disorder in mice characterized by the accumulation of several sphingolipids. Birth Defects Orig. Artic. Ser., 16, 225–230.7448355 [Google Scholar]
- 4. Walkley S.U., Vanier M.T. (2009) Secondary lipid accumulation in lysosomal disease. Biochim. Biophys. Acta, 1793, 726–736. [DOI] [PMC free article] [PubMed] [Google Scholar]
- 5. Loftus S.K., Morris J.A., Carstea E.D., Gu J.Z., Cummings C., Brown A., Ellison J., Ohno K., Rosenfeld M.A., Tagle D.A.. et al. (1997) Murine model of Niemann-Pick C disease: mutation in a cholesterol homeostasis gene. Science, 277, 232–235. [DOI] [PubMed] [Google Scholar]
- 6. Davidson C.D., Ali N.F., Micsenyi M.C., Stephney G., Renault S., Dobrenis K., Ory D.S., Vanier M.T., Walkley S.U. (2009) Chronic cyclodextrin treatment of murine Niemann-Pick C disease ameliorates neuronal cholesterol and glycosphingolipid storage and disease progression. PLoS One, 4, e6951. [DOI] [PMC free article] [PubMed] [Google Scholar]
- 7. Camargo F., Erickson R.P., Garver W.S., Hossain G.S., Carbone P.N., Heidenreich R.A., Blanchard J. (2001) Cyclodextrins in the treatment of a mouse model of Niemann-Pick C disease. Life Sci., 70, 131–142. [DOI] [PubMed] [Google Scholar]
- 8. Liu B., Turley S.D., Burns D.K., Miller A.M., Repa J.J., Dietschy J.M. (2009) Reversal of defective lysosomal transport in NPC disease ameliorates liver dysfunction and neurodegeneration in the npc1−/− mouse. Proc. Natl. Acad. Sci. U S A, 106, 2377–2382. [DOI] [PMC free article] [PubMed] [Google Scholar]
- 9. Williams I.M., Wallom K.L., Smith D.A., Al Eisa N., Smith C., Platt F.M. (2014) Improved neuroprotection using miglustat, curcumin and ibuprofen as a triple combination therapy in Niemann-Pick disease type C1 mice. Neurobiol. Dis., 67, 9–17. [DOI] [PubMed] [Google Scholar]
- 10. Chandler R.J., Williams I.M., Gibson A.L., Davidson C.D., Incao A.A., Hubbard B.T., Porter F.D., Pavan W.J., Venditti C.P. (2017) Systemic AAV9 gene therapy improves the lifespan of mice with Niemann-Pick disease, type C1. Hum. Mol. Genet., 26, 52–64. [DOI] [PMC free article] [PubMed] [Google Scholar]
- 11. Xie C., Gong X.M., Luo J., Li B.L., Song B.L. (2017) AAV9-NPC1 significantly ameliorates Purkinje cell death and behavioral abnormalities in mouse NPC disease. J. Lipid Res., 58, 512–518. [DOI] [PMC free article] [PubMed] [Google Scholar]
- 12. Patterson M.C., Vecchio D., Prady H., Abel L., Wraith J.E. (2007) Miglustat for treatment of Niemann-Pick C disease: a randomised controlled study. Lancet Neurol., 6, 765–772. [DOI] [PubMed] [Google Scholar]
- 13. Ory D.S., Ottinger E.A., Farhat N.Y., King K.A., Jiang X., Weissfeld L., Berry-Kravis E., Davidson C.D., Bianconi S., Keener L.A.. et al. (2017) Intrathecal 2-hydroxypropyl-beta-cyclodextrin decreases neurological disease progression in Niemann-Pick disease, type C1: a non-randomised, open-label, phase 1-2 trial. Lancet, 390, 1758–1768. [DOI] [PMC free article] [PubMed] [Google Scholar]
- 14. Cologna S.M., Cluzeau C.V., Yanjanin N.M., Blank P.S., Dail M.K., Siebel S., Toth C.L., Wassif C.A., Lieberman A.P., Porter F.D. (2014) Human and mouse neuroinflammation markers in Niemann-Pick disease, type C1. J. Inherit. Metab. Dis., 37, 83–92. [DOI] [PMC free article] [PubMed] [Google Scholar]
- 15. Chiu I.M., Morimoto E.T., Goodarzi H., Liao J.T., O’Keeffe S., Phatnani H.P., Muratet M., Carroll M.C., Levy S., Tavazoie S.. et al. (2013) A neurodegeneration- specific gene-expression signature of acutely isolated microglia from an amyotrophic lateral sclerosis mouse model. Cell Rep., 4, 385–401. [DOI] [PMC free article] [PubMed] [Google Scholar]
- 16. Lim M.J., Alexander N., Benedict J.W., Chattopadhyay S., Shemilt S.J., Guerin C.J., Cooper J.D., Pearce D.A. (2007) IgG entry and deposition are components of the neuroimmune response in Batten disease. Neurobiol. Dis., 25, 239–251. [DOI] [PubMed] [Google Scholar]
- 17. Walker M.T., Montell C. (2016) Suppression of the motor deficit in a mucolipidosis type IV mouse model by bone marrow transplantation. Hum. Mol. Genet., 25, 2752–2761. [DOI] [PMC free article] [PubMed] [Google Scholar]
- 18. Zenaro E., Pietronigro E., Della Bianca V., Piacentino G., Marongiu L., Budui S., Turano E., Rossi B., Angiari S., Dusi S.. et al. (2015) Neutrophils promote Alzheimer’s disease-like pathology and cognitive decline via LFA-1 integrin. Nat. Med., 21, 880–886. [DOI] [PubMed] [Google Scholar]
- 19. Lopez M.E., Klein A.D., Hong J., Dimbil U.J., Scott M.P. (2012) Neuronal and epithelial cell rescue resolves chronic systemic inflammation in the lipid storage disorder Niemann-Pick C. Hum. Mol. Genet., 21, 2946–2960. [DOI] [PMC free article] [PubMed] [Google Scholar]
- 20. Lopez M.E., Klein A.D., Scott M.P. (2012) Complement is dispensable for neurodegeneration in Niemann-Pick disease type C. J. Neuroinflammation, 9, 216.. [DOI] [PMC free article] [PubMed] [Google Scholar]
- 21. Lam L., Halder R.C., Montoya D.J., Rubbi L., Rinaldi A., Sagong B., Weitzman S., Rubattino R., Singh R.R., Pellegrini M.. et al. (2015) Anti-inflammatory therapies of amyotrophic lateral sclerosis guided by immune pathways. Am. J. Neurodegener. Dis., 4, 28–39. [PMC free article] [PubMed] [Google Scholar]
- 22. Smith D., Wallom K.L., Williams I.M., Jeyakumar M., Platt F.M. (2009) Beneficial effects of anti-inflammatory therapy in a mouse model of Niemann-Pick disease type C1. Neurobiol. Dis., 36, 242–251. [DOI] [PubMed] [Google Scholar]
- 23. Suzuki M., Sugimoto Y., Ohsaki Y., Ueno M., Kato S., Kitamura Y., Hosokawa H., Davies J.P., Ioannou Y.A., Vanier M.T.. et al. (2007) Endosomal accumulation of Toll- like receptor 4 causes constitutive secretion of cytokines and activation of signal transducers and activators of transcription in Niemann-Pick disease type C (NPC) fibroblasts: a potential basis for glial cell activation in the NPC brain. J. Neurosci., 27, 1879–1891. [DOI] [PMC free article] [PubMed] [Google Scholar]
- 24. Lull M.E., Block M.L. (2010) Microglial activation and chronic neurodegeneration. Neurotherapeutics, 7, 354–365. [DOI] [PMC free article] [PubMed] [Google Scholar]
- 25. Pena-Altamira E., Prati F., Massenzio F., Virgili M., Contestabile A., Bolognesi M.L., Monti B. (2016) Changing paradigm to target microglia in neurodegenerative diseases: from anti-inflammatory strategy to active immunomodulation. Expert Opin. Ther. Targets, 20, 627–640. [DOI] [PubMed] [Google Scholar]
- 26. Alam M.S., Getz M., Safeukui I., Yi S., Tamez P., Shin J., Velazquez P., Haldar K. (2012) Genomic expression analyses reveal lysosomal, innate immunity proteins, as disease correlates in murine models of a lysosomal storage disorder. PLoS One, 7, e48273. [DOI] [PMC free article] [PubMed] [Google Scholar]
- 27. Erickson R.P., Bernard O. (2002) Studies on neuronal death in the mouse model of Niemann-Pick C disease. J. Neurosci. Res., 68, 738–744. [DOI] [PubMed] [Google Scholar]
- 28. Micsenyi M.C., Dobrenis K., Stephney G., Pickel J., Vanier M.T., Slaugenhaupt S.A., Walkley S.U. (2009) Neuropathology of the Mcoln1(−/−) knockout mouse model of mucolipidosis type IV. J. Neuropathol. Exp. Neurol., 68, 125–135. [DOI] [PMC free article] [PubMed] [Google Scholar]
- 29. Ohshima T., Murray G.J., Swaim W.D., Longenecker G., Quirk J.M., Cardarelli C.O., Sugimoto Y., Pastan I., Gottesman M.M., Brady R.O.. et al. (1997) alpha-Galactosidase A deficient mice: a model of Fabry disease. Proc. Natl. Acad. Sci. U S A, 94, 2540–2544. [DOI] [PMC free article] [PubMed] [Google Scholar]
- 30. Gomez Perdiguero E., Klapproth K., Schulz C., Busch K., Azzoni E., Crozet L., Garner H., Trouillet C., de Bruijn M.F., Geissmann F.. et al. (2015) Tissue-resident macrophages originate from yolk-sac-derived erythro-myeloid progenitors. Nature, 518, 547–551. [DOI] [PMC free article] [PubMed] [Google Scholar]
- 31. Prinz M., Priller J. (2014) Microglia and brain macrophages in the molecular age: from origin to neuropsychiatric disease. Nat. Rev. Neurosci., 15, 300–312. [DOI] [PubMed] [Google Scholar]
- 32. Schwerd T., Pandey S., Yang H.T., Bagola K., Jameson E., Jung J., Lachmann R.H., Shah N., Patel S.Y., Booth C.. et al. (2017) Impaired antibacterial autophagy links granulomatous intestinal inflammation in Niemann-Pick disease type C1 and XIAP deficiency with NOD2 variants in Crohn’s disease. Gut, 66, 1060–1073. [DOI] [PMC free article] [PubMed] [Google Scholar]
- 33. O’Neill L.A., Kishton R.J., Rathmell J. (2016) A guide to immunometabolism for immunologists. Nat. Rev. Immunol., 16, 553–565. [DOI] [PMC free article] [PubMed] [Google Scholar]
- 34. Cluzeau C.V., Watkins-Chow D.E., Fu R., Borate B., Yanjanin N., Dail M.K., Davidson C.D., Walkley S.U., Ory D.S., Wassif C.A.. et al. (2012) Microarray expression analysis and identification of serum biomarkers for Niemann-Pick disease, type C1. Hum. Mol. Genet., 21, 3632–3646. [DOI] [PMC free article] [PubMed] [Google Scholar]
- 35. Vite C.H., Bagel J.H., Swain G.P., Prociuk M., Sikora T.U., Stein V.M., O’Donnell P., Ruane T., Ward S., Crooks A.. et al. (2015) Intracisternal cyclodextrin prevents cerebellar dysfunction and Purkinje cell death in feline Niemann-Pick type C1 disease. Sci. Transl. Med., 7, 276ra226. [DOI] [PMC free article] [PubMed] [Google Scholar]
- 36. Masuda T., Tsuda M., Yoshinaga R., Tozaki-Saitoh H., Ozato K., Tamura T., Inoue K. (2012) IRF8 is a critical transcription factor for transforming microglia into a reactive phenotype. Cell Rep., 1, 334–340. [DOI] [PMC free article] [PubMed] [Google Scholar]
- 37. Yoshida Y., Yoshimi R., Yoshii H., Kim D., Dey A., Xiong H., Munasinghe J., Yazawa I., O’Donovan M.J., Maximova O.A.. et al. (2014) The transcription factor IRF8 activates integrin-mediated TGF-beta signaling and promotes neuroinflammation. Immunity, 40, 187–198. [DOI] [PMC free article] [PubMed] [Google Scholar]
- 38. Mott R.T., Ait-Ghezala G., Town T., Mori T., Vendrame M., Zeng J., Ehrhart J., Mullan M., Tan J. (2004) Neuronal expression of CD22: novel mechanism for inhibiting microglial proinflammatory cytokine production. Glia, 46, 369–379. [DOI] [PubMed] [Google Scholar]
- 39. Yanjanin N.M., Velez J.I., Gropman A., King K., Bianconi S.E., Conley S.K., Brewer C.C., Solomon B., Pavan W.J., Arcos-Burgos M.. et al. (2010) Linear clinical progression, independent of age of onset, in Niemann-Pick disease, type C. Am. J. Med. Genet. B Neuropsychiatr. Genet., 153B, 132–140. [DOI] [PMC free article] [PubMed] [Google Scholar]
- 40. Peake K.B., Campenot R.B., Vance D.E., Vance J.E. (2011) Niemann-Pick Type C1 deficiency in microglia does not cause neuron death in vitro. Biochim. Biophys. Acta, 1812, 1121–1129. [DOI] [PubMed] [Google Scholar]
- 41. Rackova L. (2013) Cholesterol load of microglia: contribution of membrane architecture changes to neurotoxic power? Arch. Biochem. Biophys., 537, 91–103. [DOI] [PubMed] [Google Scholar]
- 42. Wu Y.P., Proia R.L. (2004) Deletion of macrophage-inflammatory protein 1 alpha retards neurodegeneration in Sandhoff disease mice. Proc. Natl. Acad. Sci. U S A, 101, 8425–8430. [DOI] [PMC free article] [PubMed] [Google Scholar]
- 43. Cougnoux A., Cluzeau C., Mitra S., Li R., Williams I., Burkert K., Xu X., Wassif C.A., Zheng W., Porter F.D. (2016) Necroptosis in Niemann-Pick disease, type C1: a potential therapeutic target. Cell Death Dis., 7, e2147.. [DOI] [PMC free article] [PubMed] [Google Scholar]
- 44. Orihuela R., McPherson C.A., Harry G.J. (2016) Microglial M1/M2 polarization and metabolic states. Br. J. Pharmacol., 173, 649–665. [DOI] [PMC free article] [PubMed] [Google Scholar]
- 45. Sun K., Halberg N., Khan M., Magalang U.J., Scherer P.E. (2013) Selective inhibition of hypoxia-inducible factor 1alpha ameliorates adipose tissue dysfunction. Mol. Cell Biol., 33, 904–917. [DOI] [PMC free article] [PubMed] [Google Scholar]
- 46. Zhang Z., Yan J., Chang Y., ShiDu Yan S., Shi H. (2011) Hypoxia inducible factor-1 as a target for neurodegenerative diseases. Curr. Med. Chem., 18, 4335–4343. [DOI] [PMC free article] [PubMed] [Google Scholar]
- 47. Keren-Shaul H., Spinrad A., Weiner A., Matcovitch-Natan O., Dvir-Szternfeld R., Ulland T.K., David E., Baruch K., Lara-Astaiso D., Toth B.. et al. (2017) A unique microglia type associated with restricting development of Alzheimer’s disease. Cell, 169, 1276–1290 e1217. [DOI] [PubMed] [Google Scholar]
- 48. Lionakis M.S., Lim J.K., Lee C.C., Murphy P.M. (2011) Organ-specific innate immune responses in a mouse model of invasive candidiasis. J. Innate Immun., 3, 180–199. [DOI] [PMC free article] [PubMed] [Google Scholar]
- 49. Dobin A., Davis C.A., Schlesinger F., Drenkow J., Zaleski C., Jha S., Batut P., Chaisson M., Gingeras T.R. (2013) STAR: ultrafast universal RNA-seq aligner. Bioinformatics, 29, 15–21. [DOI] [PMC free article] [PubMed] [Google Scholar]
- 50. Liao Y., Smyth G.K., Shi W. (2014) featureCounts: an efficient general purpose program for assigning sequence reads to genomic features. Bioinformatics, 30, 923–930. [DOI] [PubMed] [Google Scholar]
- 51. Love M.I., Huber W., Anders S. (2014) Moderated estimation of fold change and dispersion for RNA-seq data with DESeq2. Genome Biol., 15, 550.. [DOI] [PMC free article] [PubMed] [Google Scholar]
- 52. Schindelin J., Arganda-Carreras I., Frise E., Kaynig V., Longair M., Pietzsch T., Preibisch S., Rueden C., Saalfeld S., Schmid B.. et al. (2012) Fiji: an open-source platform for biological-image analysis. Nat. Methods, 9, 676–682. [DOI] [PMC free article] [PubMed] [Google Scholar]
- 53. Manaenko A., Chen H., Kammer J., Zhang J.H., Tang J. (2011) Comparison Evans Blue injection routes: intravenous versus intraperitoneal, for measurement of blood-brain barrier in a mice hemorrhage model. J. Neurosci. Methods, 195, 206–210. [DOI] [PMC free article] [PubMed] [Google Scholar]
- 54. Zhang B., Kirov S., Snoddy J. (2005) WebGestalt: an integrated system for exploring gene sets in various biological contexts. Nucleic Acids Res., 33, W741–W748. [DOI] [PMC free article] [PubMed] [Google Scholar]
- 55. Reimand J., Kull M., Peterson H., Hansen J., Vilo J. (2007) g:Profiler–a web-based toolset for functional profiling of gene lists from large-scale experiments. Nucleic Acids Res., 35, W193–W200. [DOI] [PMC free article] [PubMed] [Google Scholar]
- 56. Szklarczyk D., Franceschini A., Wyder S., Forslund K., Heller D., Huerta-Cepas J., Simonovic M., Roth A., Santos A., Tsafou K.P.. et al. (2015) STRING v10: protein- protein interaction networks, integrated over the tree of life. Nucleic Acids Res., 43, D447–D452. [DOI] [PMC free article] [PubMed] [Google Scholar]
- 57. Kamburov A., Stelzl U., Lehrach H., Herwig R. (2013) The ConsensusPathDB interaction database: 2013 update. Nucleic Acids Res., 41, D793–D800. [DOI] [PMC free article] [PubMed] [Google Scholar]
Associated Data
This section collects any data citations, data availability statements, or supplementary materials included in this article.