

Abstract
Nanodiagnostics as a field makes use of fundamental advances in nanobiotechnology to diagnose, characterize and manage disease at the molecular scale. As these strategies move closer to routine clinical use, a proper understanding of different imaging modalities, relevant biological systems and physical properties governing nanoscale interactions is necessary to rationally engineer next-generation bionanomaterials. In this Review, we analyse the background physics of several clinically relevant imaging modalities and their associated sensitivity and specificity, provide an overview of the materials currently used for in vivo nanodiagnostics, and assess the progress made towards clinical translation. This work provides a framework for understanding both the impressive progress made thus far in the nanodiagnostics field as well as presenting challenges that must be overcome to obtain widespread clinical adoption.
Subject terms: Physical sciences / Nanoscience and technology / Nanomedicine [URI /639/925/352], Physical sciences / Materials science / Nanoscale materials [URI /639/301/357], Physical sciences / Nanoscience and technology / Nanoscale materials [URI /639/925/357], Physical sciences / Engineering / Biomedical engineering [URI /639/166/985]
ETOC BLURB
Nanodiagnostics is a rapidly emerging field that leverages advances in nanobiotechnology to better visualize and diagnose disease. In this Review, we provide an overview of several clinically relevant imaging modalities and discuss how nanodiagnostics are enhancing their use.
General George S. Patton’s Second World War quote, “A good battle plan that you act on today can be better than a perfect one tomorrow,” has become a common theme in medicine, especially in cancer therapy, where it is crucial to detect disease at its earliest possible malignant form or even in a pre-malignant form1. The advantages of early detection are not limited to cancer, and many disorders such as Alzheimer disease are presumed to cause disruptive changes well before clinical manifestations become obvious2. Recent advances in conventional diagnostic strategies provide reasonable tools to identify certain diseases at earlier stages. However, we still encounter difficulties, as highlighted for cancer by the marginal reduction in cancer death rates from 1950 to the present day.
Ideally, diagnostic tools would be sufficiently sensitive to detect minuscule adverse changes at the molecular level and have high specificity to elucidate disease states. Modern diagnostic modalities must both address the urgency of early detection and have high sensitivity and specificity to enable individually tailored treatments in a cost-effective manner. Although the technical aspects and hardware of various imaging modalities have already been developed, much work remains in developing adequate imaging probes and contrast agents to enhance their clinical use (FIG. 1). In this regard, nanotechnology provides an unprecedented opportunity to build better detection strategies and tools, and places the rapidly evolving field of ‘nanodiagnostics’ at the front line in the war on diseases.
Figure 1. Timeline of the development of bioimaging modalities and imaging agents towards nanodiagnostics.
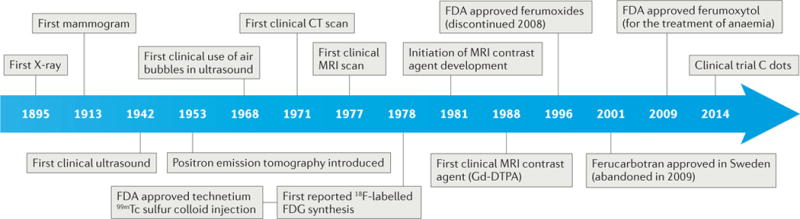
The development of imaging instrumentation was mainly accomplished by the middle of the 1980s, and nanoagents have been continuously developed since then. C dots, Cornell dots; CT, computed tomography; FDG, fluorodeoxyglucose; Gd-DTPA, gadopentetic acid; MRI, magnetic resonance imaging; PET, positron emission tomography; 99mTc, metastable technetium.
Nanodiagnostics apply nanoscale tools and materials to processes that can operate on the same scale as biological and physiological systems. These capabilities are advancing disease detection, characterization and management. In nanodiagnostics, the choice of nanomaterial has a key role because nanomaterials provide un paralleled accessibility to their biological counterparts3, have multi modal capabilities through functionalization4, can be used as ultrasensitive sensing substrates5 and can combine treatment with diagnostic capabilities (that is, ‘thera nostics’, a portmanteau of ‘therapy’ and ‘diagnostics’)6.
Nanobiotechnology is now used routinely for in vitro diagnostics in the clinic7. For example, gold nano particles (GNPs) are used for pregnancy tests through a colorimetric assay of human chorionic gonadotropin (hCG) in urine by hCG antibody-conjugated GNPs. Numerous preclinical studies suggest that diagnostics using nanomaterials will usher in a new level of ultrasensitive disease detection, allowing molecular changes to be detected even when only a small percentage of the biological system changes. At present, the use of nanomaterials for in vivo disease diagnosis and treatment is still in its infancy because the toxicities, disease-targeting capabilities and clearance mechanisms remain unknown. However, these questions are expected to be resolved in the near future, given the rate of nanotechnology development8.
In this Review, we describe how nanomaterials can be exploited with existing imaging modalities. Because in vitro strategies are extensively covered elsewhere7,9,10, we focus on nanotechnologies that enhance diagnostic capabilities in vivo. We cover the background physics of several widely accepted imaging modalities and the materials used for in vivo nanodiagnostics, and provide examples of clinical translation.
Imaging modalities
The adage ‘seeing is believing’ is now a cliché in the clinical diagnostic field, emphasizing imaging as the primary method of diagnosing certain diseases. Clinicians and researchers prefer direct observation of disease rather than indirect study (for example, history-taking and blood tests) because seeing disease, either in vivo (conventional imaging) or ex vivo (for example, biopsy), greatly enhances assessment of disease stage, localization and treatment management. Currently, the most direct method of seeing disease is biopsy. However, despite their advantages, biopsies have several limitations: choosing where to biopsy is non-trivial; tissue procurement can be anatomically or longitudinally restricted in certain diseases (for example, in lung cancer); false positives may occur because of the heterogeneity of the tissue sampled; and biopsies are invasive and do not study intact biology. As a result, medical imaging has become a useful complementary tool for non-invasive disease visualization in vivo.
Imaging modalities typically consist of discrete steps, including excitation, signal acquisition and signal processing. Collectively, these basic steps are designed to use diagnostic medical imaging systems effectively and differentiate genuine diagnostic information from background noise. Within this framework, several imaging modalities are explored below.
Radiography
Radiography, which includes medical X-ray imaging, computed tomography (CT) and mammography, exploits the contrast generated by attenuation of an incident-ionizing beam as it penetrates different parts of the body. X-ray photons are directed towards the body, where they interact through two primary processes: photo electric absorption and scattering (the extents of which are tissue-specific). Governed by the Beer–Lambert Law, extinction (that is, absorption and scattering) is proportional to the concentrations of the attenuating species in a sample. As most tissues are carbon-based, the main molecular contributions to X-ray tissue imaging are from hydrogen, carbon and oxygen. Thus, the density differences between tissues predominantly determine contrast in X-ray imaging (FIG. 2a). A tissue with low density, such as fat, can be distinguished from denser tissues, such as muscle. Meanwhile, bones and skeletal structures show good contrast, owing to the electronically dense inorganic component (calcium hydroxyapatite, Ca5(PO4)3(OH)) of the bone matrix (see the XCOM: Photon Cross Sections Database), which enhances photoelectric absorption. An early example of distinguishing diseased from non-diseased states is mammography using X-rays. This was first used in 1913 to detect stigmata of cancer by observing microscopic sprinkles of calcium deposited in cancerous breast tissue11.
Figure 2. Clinically used primary imaging modalities and their corresponding basic physical principles.
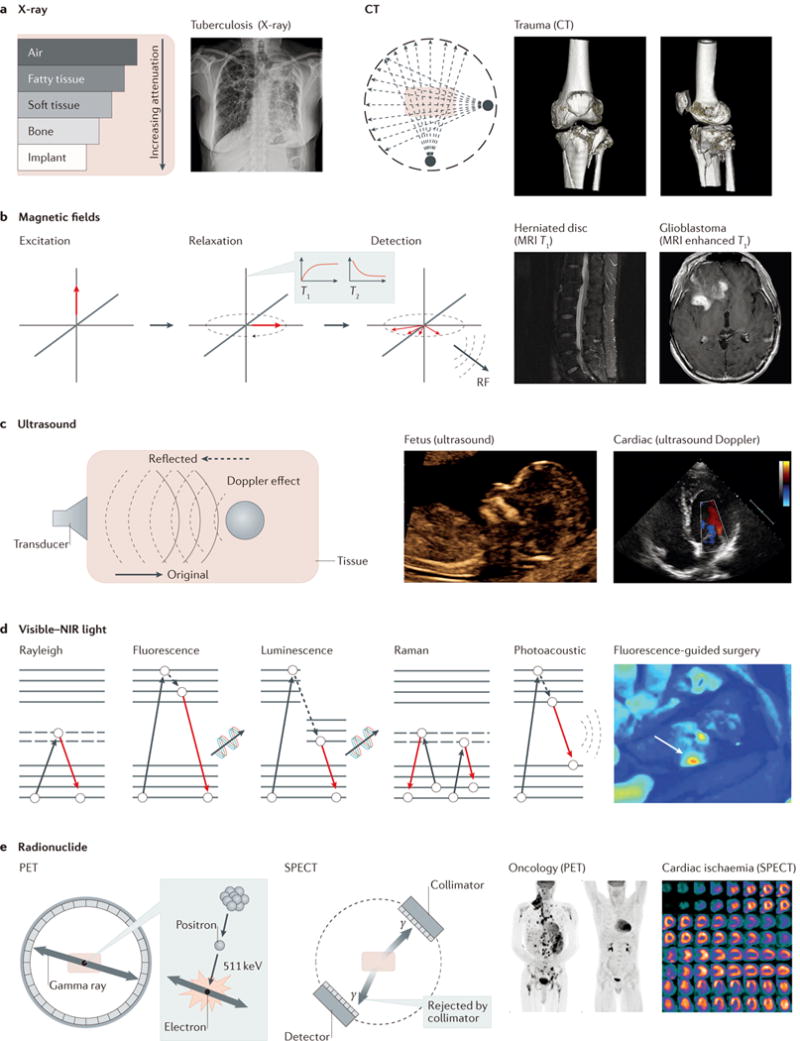
a | Clinical X-ray imaging with computed tomography (CT) primarily relies on tissue-specific attenuation of photons. Tuberculosis can be typically determined by posterior–anterior chest X-ray to investigate the existence of consolidations and/or cavities in the lung. Tibial plateau fractures can be visually represented in 3D by CT. CT scans are occasionally critical for assessing degree of fractures and guiding treatment. b | MRI uses magnetization of protons in tissues, such that the density of protons determines the contrast of tissues. Therefore, MRI is commonly used to diagnose anatomical anomalies, such as torn or damaged ligaments or herniated lumbar discs, as well as head- and neck-related diseases, such as brain tumours. c | Ultrasound uses a mechanical sound wave to characterize tissue-specific echoing properties, and is commonly used in obstetrics and gynaecology owing to its non-invasiveness. In addition, the Doppler effect can be used alongside ultrasound imaging to interrogate moving objects in the human body. d | Various optical imaging modalities are heavily dependent on photon–electron interactions, as shown in the Jablonski diagrams. Colonoscopy and fluorescence-guided surgery are examples of clinically used optical modalities using photon–electron interactions. e | PET and SPECT use injected radionuclides to generate signals from inside the body. Applications of these radio-modalities include the assessment of oncological activities or cardiac ischaemia. MRI, magnetic resonance imaging; NIR, near-infrared; PET, positron emission tomography; RF, radiofrequency; SPECT, single-photon emission computed tomography. Panel a courtesy of H. Guo and G. Gold, Stanford University. Panel b courtesy of D.-h. Ha, Stanford University. Panel c courtesy of R. Barth and J. Wu, Stanford University. Panel d courtesy of E. Rosenthal, Stanford University. Panel e courtesy of A. Iagaru, Stanford University, USA.
Although X-rays can generate both anterior–posterior and lateral projections, their resolution and use in 3D anatomic reconstruction is limited. The 3D anatomy is projected on a 2D film, leading to incomplete spatial resolution. CT is a 3D method that overcomes these limitations by exposing the body to a 360° rotating source of radiating X-rays (FIG. 2a). Typical 3D resolutions of CT are 1 mm3. In special cases, such as clinical imaging of bone microarchitecture ex vivo, a bone specimen can be imaged by micro-CT (high-resolution X-ray tomography) down to 1 μm. Human bone imaging in vivo is possible with a spatial resolution of only around 130 μm because of dose considerations and technical limitations12. The primary drawback of radiography is the carcinogenic risk of radiation exposure, because X-ray photons can induce cellular damage. However, in light of the clinical utility of radiography, these radiation risks are deemed clinically acceptable.
Magnetic resonance imaging
Magnetic resonance imaging (MRI) is based on the quantum behaviour of protons (that is, the hydrogen atoms predominantly found in water throughout the body) in a strong magnetic field (typically, ~1.5 T in a clinical MRI scanner) to render 3D structures based on spin–lattice (T1 relaxation time) and spin–spin (T2) interactions of protons (FIG. 2b). ‘Soft tissue contrast’ is a hallmark of MRI that cannot be achieved by X-ray-based radiography. Therefore, MRI is widely used in clinics to help diagnose anatomical anomalies such as torn or damaged muscles, ligaments and cartilage, or herniated lumbar discs.
MRI technologies have advanced towards stronger magnetic fields that polarize and excite more protons in the subject to overcome inherently poor nuclear polarization. For example, although the typical resolution of clinical magnetic resonance is 1 mm3, preclinical MRI systems, such as the BioSpec Bruker magnetic resonance system, can perform murine brain imaging at 15.2 T, achieving an unrivalled resolution of 19 μm2 in vivo13. Another method of increasing the sensitivity of MRI is to use the material’s hyperpolarization (that is, when the nuclear spin polarization exceeds that under thermal equilibrium). In normal imaging conditions, thermal fluctuations overpower proton alignment despite the large magnetic field. However, hyperpolarization can boost magnetic resonance signals because it increases the polarization by a factor of 104–105 compared with thermal equilibrium. For example, a 170,000-fold enhancement compared with thermal equilibrium was recently reported for bulk nuclear spin polarization of 13C from optically pumped nitrogen-vacancy centres in diamond14. Other hyperpolarization methods include spin-exchange optical pumping (by 3He and 129Xe)15,16, metastability-exchange optical pumping17, dynamic nuclear polarization18 and parahydrogen-induced polarization19.
Ultrasound
Ultrasound is non-invasive, non-ionizing and inexpensive, and has been widely used for clinical applications, such as gynaecological imaging. In ultrasound imaging, the mechanical wave propagates at a speed dependent on the acoustic impedance of the medium. This determines the echo signal, which is used to construct an image (FIG. 2c). The Doppler effect, which can be created by any moving object (usually blood or muscle movement), is an important factor in determining differential contrast within body parts imaged by ultrasound20.
Optical imaging
Optical imaging uses visible to near-infrared (NIR) wavelengths of light and exploits photon– electron interactions and their resulting electron energy states. For example, one of the simplest forms of optical imaging is endoscopy — the direct imaging of internal organs with visible light. Fluorescence imaging is another example, which, as depicted in FIG, 2d, harnesses differential electron states stimulated by incoming excitation light, resulting in emission of a longer-wavelength photon. As a clinical example, fluorescence-guided surgery uses fluorescently labelled tissues during surgery: indocyanine green non-specifically detects sentinel lymph nodes, and methylene blue provides unaided eye detection of sentinel lymph nodes intraoperatively. In addition to methods based on fluorescence intensity measurements, methods based on the fluorescence lifetime are also available21.
Other optical imaging modalities include Raman and photoacoustic imaging, which have primarily been used for preclinical applications. Raman imaging uses inelastic scattering of photons interacting with molecular vibrations. Notably, because Raman imaging relies on the detection of ‘fingerprint’ Raman spectra, it provides high multiplexing capability22 and molecular sensitivity. Raman endoscopy aided by multiplexing surface-enhanced Raman GNPs as molecular imaging contrast agents was used to image an internal organ (the colon), demonstrating the potential clinical applicability of in vivo multiplexed Raman imaging23,24. In contrast to Raman imaging, photoacoustic imaging uses the photon-induced thermal response for signal transduction, thereby overcoming the depth limitations of typical optical imaging modalities. In photoacoustic imaging, light pulses excite targeted imaging agents, causing thermal expansion, which generates an acoustic wave that can be recorded by an ultrasound transducer25,26.
Although optical imaging modalities provide high spatial resolution, they suffer from limited penetration depth, because the incident light is scattered and absorbed while travelling through a biological specimen. To overcome this limitation, many researchers have exploited the NIR window (NIR-I: 750–900 nm; NIR-II: 1,000–1,700 nm), in which the light absorption by biological tissues is minimized. For example, a rapidly excreted NIR-II fluorophore was recently used to probe tissues at centimetre depths and achieve micrometre-scale resolution at depths of millimetres27.
Molecular imaging
Although anatomic imaging can accurately depict the location, size and spread of some diseases, it is limited to abnormalities larger than 1 mm3 (REF. 28). Moreover, it is sometimes delayed in detecting macroscopic anatomical changes as a physiological response to progressed disease because of its limited sensitivity. In addition, anatomical imaging is frequently unable to distinguish between inflammatory, benign and cancerous diseases (for example, lymph node enlargement or benign lung nodule from lung cancer), thus not clearly representing underlying molecular and bio chemical processes. By contrast, molecular imaging generates biologically meaningful contrast by detecting molecular-level changes in vivo, thereby helping to detect alterations in subcellular processes, and also has the potential to be tailored for personalized medicine.
Positron emission tomography
Understanding the underlying biochemical processes of disease is crucial for successful molecular imaging. For example, the Warburg effect (that is, cancer cells undergo higher rates of glycolysis than non-cancerous cells) is used in positron emission tomography (PET) imaging of tumours. Specifically, 2-fluoro-2-deoxyglucose ([18F]FDG), a glucose analogue with the 2ʹOH replaced by a positron-emitting radionuclide (18F), is preferentially taken up by cancerous tissues but not metabolized like normal glucose. Thus, FDG uptake and trapping is used to trace regions in the body with higher glucose metabolic rates.
Positrons emitted by radionuclides in [18F] and other positron-emitting isotopes travel until they collide with their counterpart — an electron. Through matter–antimatter interaction and energy–mass conversion, they experience pair annihilation and transform into a pure energy form — a pair of gamma rays with a characteristic energy (511 keV) detectable by a scintillation detector. Theoretically, a pair of gamma rays propagates simultaneously while maintaining anti-parallel trajectories 180° relative to each other; however, the tiny momenta of the electron and the positron before annihilation contribute to a slight divergence in the gamma ray, causing a digression from the exact 180° trajectories (FIG. 2e). PET uses this feature of energy–mass equivalence to identify the spatial origins of positrons. This enables the extrapolation of the tumour location by tracking higher metabolic regions within the body. PET scans are usually performed alongside CT or magnetic resonance scans to simultaneously gain anatomical information for locating disease origins.
Clinical applications of PET with FDG are not limited to the area of oncology, because FDG can accumulate at the sites of infection and inflammation owing to increased glycolytic activity in these states29. Examples include mononuclear cells such as lymphocytes and macrophages, which consume large amounts of glucose when targeting a source of an infection. Therefore, PET-CT using FDG, or analogues such as 6-[18F]-fluoromaltose30, can image a wide range of inflammatory and infectious conditions30,31 such as granulomatous diseases and fungal infections. Other PET applications include tracking pharmaco kinetics of drugs32,33 and musculoskeletal studies34 with various PET tracers35. For further details, please see previous reviews36,37.
Single-photon emission computed tomography
In contrast to the fixed energy-level detection of PET, single-photon emission computed tomography (SPECT) can detect a broad range of energies, including the characteristic gamma-decay energy profiles of metastable technetium-99m (140 keV) and iodine-123/131 (159 keV). SPECT detects gamma rays emitted from excited radionuclides, which rearrange into less energetic, more stable configurations (an isomeric transition). The flexibility in radioactive agents is amenable to multiplexed imaging but is limited in sensitivity by the generally lower energy profiles of the agents and the need for physical collimators38 (FIG. 2e). Recently, stationary clustered pinhole SPECT was shown to image nuclear tracers at energies up to 600 keV (REFS 39,40). Imaging 213Bi down to 0.75 mm resolution was achieved using a SPECT system equipped with a dedicated collimator. This enhanced resolution enables direct imaging of high-energy therapeutic tracers for studying the in vivo behaviour of radio-therapeutics. Further details can be found in other review articles38,41.
Conventional contrast agents
Contrast agents were introduced to improve the sensitivity of anatomic imaging modalities. This includes any material that generates a sufficiently different signal (for example, attenuation length in X-ray-based imaging or relaxation time in MRI) in different tissues. Molecular imaging agents typically refer to a contrast agent that has some molecular specificity (for example, for a cell surface receptor), whereas the term contrast agent typically refers to a non-specific agent (for example, an agent that enables signal enhancement in the vasculature).
Most contrast agents for clinical applications are used in X-ray-based imaging and MRI. In X-ray imaging, iodine-based and barium sulfate contrast agents (that is, small molecules) have high attenuation coefficients because of their propensity to scatter incoming waves. These contrast agents can therefore be intravenously administered and used to visualize blood vessels. In MRI, gadolinium (Gd) reduces the spin relaxation time of protons within nearby water molecules, thus enhancing the signal at sites of contrast-agent accumulation. This effect is attributed mainly to the paramagnetic properties of Gd, which has seven unpaired electrons in the 3+ oxidation state (Gd3+). Gadolinium-based contrast agents are widely used in clinics for magnetic resonance angiography. In particular, they are used for imaging infection-related breakdown of the blood–brain barrier or the sites of neoplasm, because Gd chelates are normally unable to cross the intact blood–brain barrier42.
The first ultrasound contrast agent was an agitated saline that was injected in the aortic root; this enabled the undulating margins of the aortic root to be imaged with a cloud of echoes43. The use of agitated saline, which contains bubbles (created, for example, by rapidly and repetitively transferring the saline between two connected syringes), has led to the development of substantially higher-sensitivity microbubbles and microspheres, which are used in ultrasound imaging exams20, particularly exams of the heart. Microbubbles can be further modified to target overexpressed cellular markers with targeting ligands, such as antibodies44–46. This approach enabled the highly accurate and reliable detection of breast cancer and ductal carcinoma in situ44, using clinically translatable microbubbles that targeted vascular endothelial growth factor receptor type 2.
The examples detailed above highlight how contrast agents increase the sensitivity of various imaging modalities. To increase the specificity of disease diagnosis, imaging can incorporate aspects of the molecular biology, biochemistry and physiology of a given disease. Addressing the issue of specificity is a main aim of the field of molecular imaging, which has led to the translation of many common in vitro bioassay strategies for in vivo study.
Nanomaterial-based diagnostic imaging
A key advantage of nanomaterials is their ability to interact with biologically relevant structures (for example, proteins) of nanoscale dimensions47. Additionally, the high surface area to volume ratio at the nanoscale allows for versatile functionalization of nanomaterials for either targeted diagnostic imaging or encapsulated and triggered release of therapeutics. A detailed discussion of nanoparticles used in each imaging modality can be found elsewhere48. In this section, we focus on intrinsic nanomaterial properties and their potential for diagnostic in vivo imaging.
Inorganic nanomaterials
Most inorganic nanoparticles are metallic, with a high density of free electrons in the valence band. The interaction between these free electrons and the excitation phase is the basis of their use as contrast agents in various imaging modalities: for example, this attenuates incident X-rays, increases the Raman optical cross-section and influences the relaxation time of protons in MRI.
Paramagnetic nanoparticles are highly effective in MRI owing to their high magnetic moments. A clinically accepted nanomaterial, superparamagnetic iron oxide nanoparticles (SPIONs, a mixture of Fe2O3 and FeO or of Fe2O3 and Fe3O4), has been widely used as an MRI contrast agent. In SPIONs, the Fe2+ ions have four unpaired electrons in the 3d shell, resulting in strong magnetic moments. Although cobalt and nickel nanoparticles have comparable magnetic properties49, they have demonstrated considerable toxicity in preclinical studies50. SPIONs achieve negative signal enhancement in MRI by markedly reducing the T2 relaxation time. The mechanism of enhancement is based on susceptibility effects of the iron oxide core, which result in heterogeneity of the magnetic field.
Superparamagnetism is a unique property of nanomaterials, whereby ambient thermal fluctuations are sufficiently large to flip the direction of the magnetic moment of a magnetic particle. Superparamagnetism is derived from ferromagnetism, in which spins of unfilled d bands spontaneously align in parallel inside a domain below a critical temperature. These properties result in a large magnetic moment for each nanoparticle (similar to ferromagnetism), and the effect responds to external magnetic fields as a paramagnetic response (that is, there is no open hysteresis loop). Consequently, protons close to superparamagnetic nanoparticles are more sensitive to applied magnetic fields. Iron oxide nanoparticle size is the main determinant of magnetic character (paramagnetic, superparamagnetic and ferromagnetic) and can be roughly classified into extremely small-sized iron oxide nanoparticles (ESIONs, less than 5 nm)51, SPIONs (sizes roughly between 10 and 20 nm) and ferrimagnetic iron oxide nanoparticles (FIONs, larger than 20 nm)52 as demonstrated in TABLE 1 and FIG. 3a-c.
Table 1.
Representative nanomaterials designated for nanodiagnostics
| Types | Dimension | Imaging modalities | Comment |
|---|---|---|---|
| Inorganic | |||
| ESION51 | <5 nm | Magnetic resonance | Paramagnetic, T1 contrast agent |
| SPION52 | 10–20 nm | Magnetic resonance | Superparamagnetic, T2 contrast agent |
| FION52 | >20 nm | Magnetic resonance | Ferrimagnetic, T2 contrast agent |
| Si | • ~200 nm with 4 nm pores* • 6–7 nm (REF. 167) |
Ultrasound, magnetic resonance and fluorescence PET167 | • Mostly mesoporous silica
nanoparticles for drug delivery • Contain a class of biodegradable nanoparticles • C dots (functional core–shell silica particles)167 |
| ZnS (REF 77) | ~5.5 nm | Phosphorescence | Semiconductor, manganese(ii)-doped |
| GNP | Varies | X-ray, optical coherence tomography, photoacoustic and Raman | Known to be biologically inert but has size-dependent toxicity. |
| Ag2Se (REF 76) | Sub-3 nm | Fluorescence | • Semiconductor quantum
dot • NIR fluorescence • Low toxicity |
| Organic | |||
| Carbon nanotube | 1.2 nm (diameter, SWNT) | Fluorescence and photoacoustic | • Strong absorbance in NIR
light • Toxic, van Hove singularities |
| Liposome | 20–3,000 nm | Ultrasound, widely applicable | • Theranostic,
nanobubbles • Phospholipid bilayer with cholesterol, mostly used for drug delivery |
| Micelle | 5–100 nm | Widely applicable | • Theranostic, ionized fatty
acids • Mostly used for drug delivery |
| Dendrimer | 10–500 nm | Widely applicable | • Theranostic • Conjugated with paramagnetic iron oxide particles or gadolinium chelate for magnetic resonance • Gene delivery • Limited structural diversity |
| Self-assembled small molecules145 | 20–300 nm | Fluorescence | Triggered condensation through condensation chemistry |
C dots, Cornell dots; ESION, extremely small-sized iron oxide nanoparticles; FION, ferrimagnetic iron oxide nanoparticles; GNP, gold nanoparticles; NIR, near-infrared; PET, positron emission tomography; SPION, superparamagnetic iron oxide nanoparticles; SWNT, single-walled nanotubes.
Available commercially.
Figure 3. Examples of nanoparticles used in preclinical imaging.
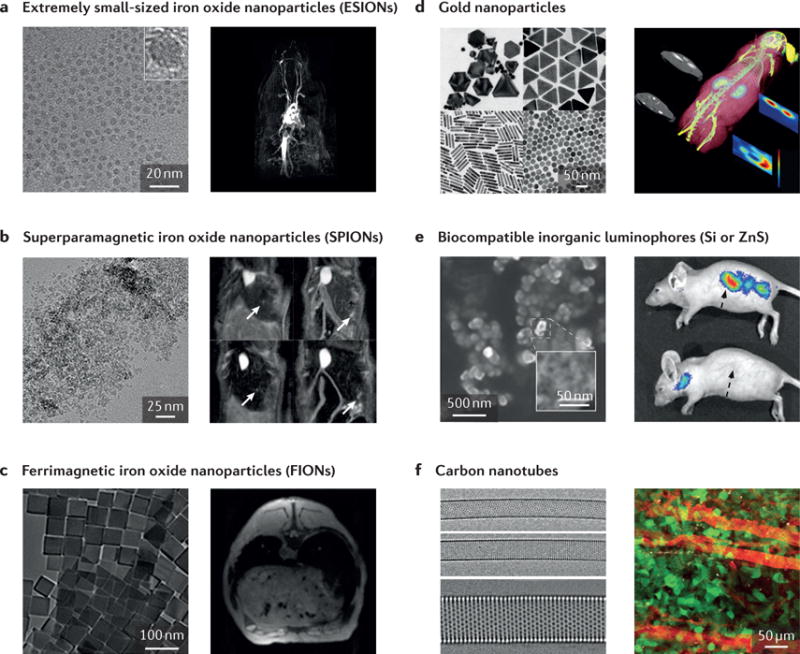
a | Extremely small-sized iron oxide nanoparticles (ESIONs) only a few nanometres in diameter exhibit relatively weak magnetic moments, suitable for T1 MRI contrast enhancement. A TEM image of iron oxide nanoparticles and an ESION-enhanced blood pool MRI of a rat obtained by 3D-FLASH sequence are displayed. b | A TEM image of Resovist, with magnetic resonance images of Huh7 orthotropic liver cancer model, are shown. Arrows indicate the location of tumours. c | In contrast to smaller iron oxide nanoparticles, larger iron oxide nanoparticles are suitable for the contrast enhancement in T2* MR images. Ferrimagnetic iron oxide nanoparticles are known to have the highest relaxivity among single iron oxide nanoparticles. d | Gold nanoparticles with various shapes for various purposes are displayed in SEM and TEM images. Owing to the high atomic number and free electrons of gold, GNPs have been widely used in the fields of plasmonics, X-ray, X-ray fluorescence computed tomography (XFCT), and so on. As an example, a tumour-bearing mouse injected with GNPs is accurately imaged with a benchtop XFCT. e | Biocompatible inorganic luminophores (Si or ZnS) that overcome the conventional limitations of quantum dots are shown. However, limitations exist, including excitation wavelengths. They have great applicability in multiphoton intravital imaging. f | Carbon nanotubes have unique optical and electrical properties that are widely used in NIR imaging. GNP, graphene nanoparticle; MRI, magnetic resonance imaging; NIR, near-infrared; SEM, scanning electron microscopy; TEM, transmission electron microscopy. Panel a is reproduced with permission from REF. 51, American Chemical Society. Panel b (left image) is reproduced with permission from REF. 200, American Institute of Physics. Panel b (right image) is reproduced with permission from REF. 201, American Chemical Society. Panel c is reproduced with permission from REF. 202, National Academy of Sciences. Panel d (left image, top left) is reproduced with permission from REF. 203, Wiley-VCH. Panel d (left image, top right) is reproduced with permission from REF. 204, American Chemical Society. Panel d (left image, bottom right) is reproduced with permission from REF. 205, Wiley-VCH. Panel d (left image, bottom left) is reproduced with permission from REF. 206, American Chemical Society. Panel d (right image) is reproduced with permission from REF. 207, Macmillan Publishers Limited. Panel e is reproduced with permission from REF. 78, Macmillan Publishers Limited. Panel f (left image) is reproduced with permission from REF. 208, Macmillan Publishers Limited. Panel f (right image) is reproduced with permission from REF. 83, Macmillan Publishers Limited.
GNPs have great potential in in vivo imaging modalities owing to their exceptional chemical and biological inertness. Because of their higher absorption coefficient53, resulting from their high electron density, GNPs yield greater contrast in X-ray-based imaging per unit weight than iodine, a common X-ray contrast agent54. However, despite their high X-ray absorption, relatively high tube potentials (>90 kVp) are necessary to generate clearer contrast55. In contrast to X-ray-based imaging, other imaging modalities require the functionalization of GNPs with small molecules before in vivo injection. Because their surface can be functionalized with small-molecule imaging agents through gold–thiolate bonds, GNPs can serve as nanocarriers for other imaging modalities such as MRI, PET or SPECT imaging. For example, GNPs can be modified with Gd chelates for MRI imaging56,57, with radionuclides for PET or SPECT imaging58,59, or with Gd coating and a silica shell for multimodal imaging60. Various research groups have reported56,61 GNPs functionalized with Gd, while maintaining high magnetic resonance relaxivity (29 mM−1 s−1, 30 MHz, 25 °C). GNPs can also be covalently linked with 1,4,7,10-tetraazacyclodo-decane-1,4,7,10-tetraacetic acid (DOTA) for immobilizing a radionuclide (64Cu)32 for both PET imaging and thera peutic intervention. Further, researchers could directly load radionuclide into the crystal lattice of GNP to create a copper–gold alloy (64CuAu)58,59. GNPs are also widely used in preclinical imaging modalities such as Cerenkov luminescence imaging62 and optical, Raman60,63 and hyperspectral imaging64, and are used as a sensing substrate for surfaced-enhanced Raman spectroscopy (SERS)65 with their various shapes and morphology (FIG. 3d). A detailed review on the use of GNPs in clinical imaging can be found elsewhere55.
Semiconductor nanoparticles — single crystals of a few nanometres in diameter, which are also known as colloidal semiconductor quantum dots — are broadly used in live cell imaging and in vivo diagnostics66–69. Unlike metallic nanoparticles, the Fermi levels — the total (electro) chemical potential of electrons — of semiconductor nanoparticles lie between the conduction and valence bands, leading the edges of the bands to govern the low-energy optical and electrical behaviour of the nanoparticle. As shown in TABLE 1, this property yields strong size-dependent optical excitations for clusters of as many as 10,000 atoms70. Many advanced synthesis methods have been investigated to improve photophysical and biochemical properties of quantum dots, such as photoluminescence quantum yield71, antibody conjugation72,73 and in vivo synthesis74. Owing to the excellent optical and physical properties of quantum dots, they have been widely adopted in preclinical imaging.
However, one of the main atomic components of the best-known quantum dot (CdS, cadmium sulfide) — cadmium — is highly toxic, and is believed to cause itai-itai disease. On that account, researchers used cadmium-free CuInS2/ZnS quantum dots for less toxic NIR imaging of sentinel lymph nodes75. Quantum dots made of Ag2Se, obtained by Na2SeO3 reduction with the binding of silver ions and alanine in a quasi-biosystem, exhibit notable NIR fluorescence, penetrating through the abdominal cavity of a living mouse76. Nanocrystals of ZnS for three-photon excitation combined with Mn2+ dopant for visible emission demonstrated targeted cellular imaging with high spatial resolution77 (FIG. 3e). The biocompatibility of ZnS confers great potential in clinical application compared with Cd-based quantum dots. Finally, luminescent porous silicon nanoparticles were used for in vivo imaging and to engineer the self-destruction of delinquent nanoparticles into non-toxic products that can be harmlessly eliminated from the body78.
Organic nanomaterials
Organic nanoparticles have also been used for multimodal theranostic applications. Dendrimers, micelles, fullerenes, nanoshells and liposomes are examples of organic nanomaterials that can carry both therapeutic agents and imaging agents, such as radionuclides and NIR fluorescent dyes.
Dendrimers have a tree-like branching structure and form a spherical shape. The loading efficiency of den-drimers is high because both their internal cavity and surface can be used for theranostic purposes. In addition, proper polymerization and selection of monomers determines the size, relative molecular mass and chemical composition of the dendrimer4.
Micelles, which are typically formed from soap molecules, can solubilize insoluble or poorly soluble drugs and increase their bioavailability. Consisting of closed lipid monolayers with a fatty acid core and a polar surface, micelles adopt a spherical form in response to the amphipathic nature of fatty acids. Their typical size ranges from 2 to 20 nm, depending on molecular composition and concentration, and their size allows them to accumulate in the leaky vasculature. In addition, chemical modifications on the lipid surfaces enable micelles to be used in many different imaging and therapeutic modalities79.
Similar to micelles, liposomes are artificially engineered vesicles with a phospholipid bilayer, separating an aqueous internal compartment from the bulk aqueous phase. They can be selectively localized to tumour sites and are capable of transporting both drugs and imaging agents. Liposomes have been radiolabelled to evaluate their in vivo performance as drug carriers80.
Carbon nanotubes81 — especially single-walled carbon nanotubes (SWNTs) — have an intrinsic semiconducting bandgap suitable for NIR-II fluorescence imaging. In addition, extreme confinement of electrons and phonons in the 1D structure, resulting in van Hove singularities in its density of states, leads to various optical phenomena82. For example, efficient photon–phonon conversion in SWNTs enables effective photoacoustic imaging25. Interestingly, almost 100% of SWNTs are taken up by a single immune cell subset, Ly-6Chi monocytes, whereas 3% or less are taken up in all other circulating cells, implying a potential for use in an immune-based delivery strategy83 (FIG. 3f). Real-time high-resolution intraoperative photoacoustic imaging is also available in conjunction with carbon nanoparticles derived from honey for sentinel lymph-node imaging84.
Inorganic nanoparticles often have intrinsic molecular properties that can generate contrast on imaging. For example, the unique magnetic properties of iron oxide nanoparticles enable contrast on MRI, and the high electron density of gold nanoparticles generates optical phenomena that can be exploited for X-ray or optical imaging. In contrast to inorganic nano particles, organic ones may not be able to generate sufficient contrast, as the molecular structures of many types of organic nano particles are similar to those of the imaging subject. Although there are methods of circumventing this issue, including surface functionalization, this lack of intrinsic contrast renders them more suitable for use as therapeutic vehicles rather than strict imaging agents. Indeed, as listed in TABLE 1, most organic nanoparticles are presented as theranostics, capable of both therapeutic payload delivery and imaging.
Current clinically available contrast agents and nanoparticles are heavily reliant on perfusion for passive targeting of disease sites. For active targeting (ligand-mediated targeting), which enables highly specific diagnosis and may provide possible treatment options, targeting and signalling components must be incorporated. The ability of nanoparticles to actively target diseased tissues is an important feature because it has the potential to reduce off-target effects and enhance accumulation at the diseased site85. Two main modifications of nanoparticles — targeting ligands and surface modifications — are available to construct nanoparticles as effective imaging tools. The dominant targeting ligands are antibodies and their fragments, and nanoparticles are able to accommodate numerous antibodies, thereby increasing their association constant significantly86,87. Other proteins and peptides can also be used to target specific substrates, with peptides having better stability because of their simpler 3D structures. Aptamers that bind to target molecules with high specificity and affinity are also available as targeting ligands on nanoparticles. They are smaller, more stable than antibodies and can be chemically synthesized. However, their laborious selection methods88 and their inherent positive charge are the limiting factors for clinical use.
The surface modifications of nanoparticles, including surface and ligand charges, and surface hydrophobicity or hydrophilicity, are closely related to their survival in the harsh in vivo environment. Although active targeting is generally believed to increase the chance of nano particle delivery to a specific disease site, the ligand–receptor interactions of nanoparticles are limited to less than 0.5 nm. Thus, current drug delivery methods do not have the ability to guide nanoparticles to a target89, thereby leading to insignificant differences in accumulation of nanoparticles in tumours. As a result, they are still reliant on blood circulation and extravasation followed by retention within the tumour. Therefore, designing nanoparticles with longer circulation times is crucial for better targeting.
Using nanomaterials in living subjects
For effective disease targeting, it is desirable to engineer nanoparticles with clearance times that are much longer than their distribution time, to maximize the local concentration of nanoparticles at the disease site for optimal contrast. Several parameters are important in the pharmacokinetics and biodistribution of nanoparticles, including size, shape, surface charge and surface chemistry90,91.
Design considerations
The circulation time of nanoparticles in the blood depends strongly on the particle size, with smaller particles typically having a longer circulation half-life than larger particles47. Nanoparticles smaller than 5–10 nm can pass through the glomerular basement membrane of the kidney and are quickly cleared from the blood92,93 (FIG. 4a). By contrast, micrometre-sized particles are filtered by the capillary bed of the lungs47,94 (FIG. 4b). Between these sizes, nanoparticles are predominantly taken up by the reticuloendothelial system. For example, nanoparticles larger than 100 nm are endocytosed by Kupffer cells of the liver, while the fenestrations in the spleen filter out particles larger than 200 nm (REFS 94,95) as schematic and scanning electron microscope images. However, particle deformability can allow large particles to squeeze through these fenestrations, increasing their circulation time95,96.
Figure 4. In vivo nanoparticle accumulation, clearance and filtration.
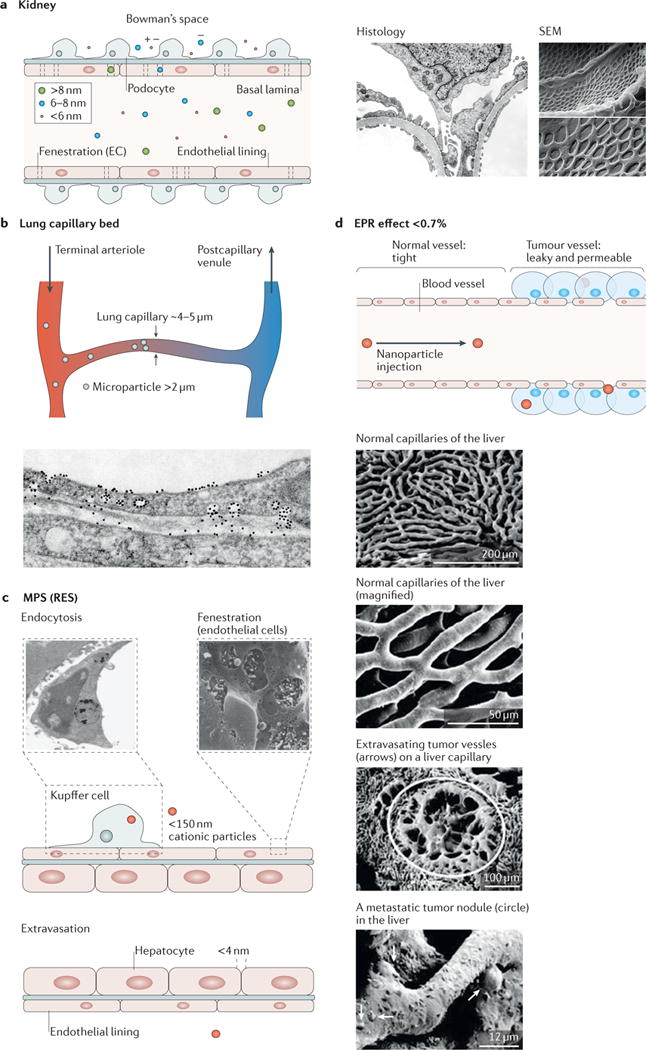
The figure shows the fate of nanoparticles and describes their accumulation and clearance sites. After injection, 99% of injected nanoparticles will face sequestration or clearance either by the reticuloendothelial system, including the liver and spleen, or by filtration of the kidney209. a | Kidney filtration or renal clearance is responsible for the filtration of nanoparticles, typically smaller than 6 nm in their hydrodynamic diameter. As shown in the scanning electron microscopy (SEM) images210 and histology, the numerous, round fenestrations over the entire glomerular cell surface (endothelial lining) serve as a filter for nanoparticle clearance. Filtered nanoparticles are then drained to the bladder and finally cleared through urination. b | Micrometre-sized particles are physically filtered by capillary beds in the lungs, which are known to be the smallest capillaries. c | The liver is a representative reticuloendothelial system and a major entrapment site for injected nanoparticles. Phagocytic cells, including Kupffer cells in the liver, preferentially entrap negatively charged nanoparticles smaller than 150 nm. Entrapped nanoparticles will eventually be cleared from the body via the bile duct. In addition, fenestration of endothelial cells (SEM inset) and intracellular gaps allow nanoparticles to extravasate as a part of clearance. d | The enhanced permeation and retention (EPR) effect enables nanoparticles with sizes of 100–200 nm to accumulate and retain in the tumour interstitium owing to its leaky vasculature structures. This mechanism is further enhanced in tumours because of the lack of a draining lymphatic system. Electron micrographs show the contrast between normal and cancerous tissues. On average, 0.7% of intravenously injected nanoparticles arrive at tumour sites209. MPS, mononuclear phagocytic system; RES, reticuloendothelial system. Histological image in panel a is reproduced with permission from REF. 211, Elsevier. Scanning electron microscopy image in panel a is reproduced with permission from REF. 210, Public Library of Science. The micrograph of a phagocytic Kupffer cell in panel c is reproduced with permission from REF. 212, BioMed Central. The micrograph of the hepatic endothelial fenestrae in panel c is reproduced with permission from REF. 213, Wiley-VCH. Electron micrographs in panel d are reproduced with permission from REF. 214, Springer.
Surface charge is also an important factor in determining the circulation time, because charged particles (particularly positively charged) tend to be cleared by the reticuloendothelial system more quickly and have a higher non-specific cell internalization rate than neutral particles90. For example, particles with primary amine groups are more readily phagocytosed than particles coated with carboxyl, sulfate and hydroxyl groups91. Particles with a surface charge below 15 mV showed decreased phagocytic uptake, longer circulation time, and higher accumulation in a murine tumour model97. However, the surface charge of a nanoparticle can quickly change upon contact with plasma owing to adsorption and opsonization of plasma proteins98,99, forming a ‘protein corona’, which can expedite particle phagocytosis and clearance100–102.
A common strategy for enhancing particle circulation is to coat nanoparticles with hydrophilic, neutral polymers, such as polyethylene glycol (PEG)103. PEG imparts stealth-like properties to nanoparticles by conferring enhanced resistance to protein adsorption and opsonization104, thereby allowing nanoparticles to evade phagocytosis by macrophages, and extending their circulation time from minutes to hours. Higher-molecular-weight PEG and greater coating density improve the circulation half-life103,105,106. For example, a study looking at the half-lives of PEG-functionalized crosslinked dextran-coated magnetic nanoparticles >100 nm in size demonstrated half-lives of 7.29 and 11.75 hours for 5 and 20 kDa PEG, respectively107.
Particles up to a few tens of nanometres in size can extravasate out of blood vessels into the interstitial space of organs and tissues. However, in tumours, the vasculature is leakier, and larger particles — up to a few hundred nanometres in size — can extravasate into the tumour site, where they can be retained for longer periods of time than smaller particles or small molecules108,109. This phenomenon, known as the enhanced permeability and retention effect (EPR, FIG. 4d), is the main mechanism responsible for passive uptake of nanoparticles into tumours110. By coating nanoparticles with antibodies or other targeting ligands, retention in the tumour can be further enhanced.
The shape of nanoparticles also determines their circulation time and uptake into tumours, because nano particles with a higher aspect ratio tend to be phagocytosed by macrophages more readily than spherical particles111–113. One study comparing the biodistribution of 50 nm gold nanospheres and similarly sized gold nanorods (45 nm × 10 nm) showed that at 6 hours, the nanospheres were present at only 1% injected dose per gram, whereas the nanorods were present at 11% injected dose per gram (REF. 114). This result is corroborated by other studies that have shown a substantially longer circulation time for long filamentous micelles compared with spherical micelles115.
In general, larger nanoparticles or submicrometre-sized particles provide better sensitivity as contrast agents. For example, larger GNPs can provide a greater scattering or absorption cross-section for SERS and photoacoustic detection116,117, and larger iron oxide particles can provide increased T2 relaxivities for improved MRI contrast118. However, metal nanoparticles above the kidney filtration size (even PEGylated long-circulating particles), once cleared by the reticuloendothelial system, can remain indefinitely in the liver and spleen. The exceedingly slow clearance from the body can take months or longer, with unknown long-term toxicities for many nanoparticles. Therefore, there is currently strong interest in engineering nanoparticles that are sufficiently large for strong EPR effect and contrast, while being able to biodegrade into small particles that can be cleared by the kidneys119.
Strategies to overcome nanomaterial toxicity
In vivo toxicity of nanoparticles can vary depending on the chemical composition, size and biodegradability. Measures of toxicity can include changes in animal behaviour, weight, cardiovascular status, liver function, biochemical parameters and histological changes (for example, inflammation, necrosis or apoptosis)120,121. Such extensive toxicity studies have been demonstrated on PEGylated silica-coated SERS gold nanoparticles120. Nanoparticles that have undergone rigorous clinical testing and been approved by the US Food and Drug Administration (FDA) include Feridex and ferumoxytol, for MRI liver contrast and iron supplementation in anaemic patients122, respectively. FDA guidelines strongly suggest that pharmaceutical drugs be cleared through metabolism or excretion processes after entering the host body, because timely and proper drug elimination lessens toxicity and prevents improper drug accumulation123.
SPIONs taken up by the reticuloendothelial system are readily metabolized to free iron, and end up in the body’s iron stores within the liver and bone marrow, where they are available for haemoglobin production by red blood cells124. In one study, it was reported that there were no acute or subacute toxic effects (according to histology or serology) in rats or beagle dogs injected with 3,000 μmol Fe kg−1 (~168 mg kg−1)124. Intravenous doses as high as 250 mg Fe kg−1 have been reported in rats without detectable hepatic mitochondrial dysfunction or microsomal lipid peroxidation, which are sensitive indicators of iron-induced toxicity125.
In contrast to SPIONs, GNPs, which were long thought to be biocompatible and inert126,127, in fact have demonstrated size-dependent toxicity. For example, at comparable doses in mice (8 mg kg−1 per week), GNPs with sizes from 3 to 5 nm and those from 50 to 100 nm were found not to be toxic; by contrast, those in the intermediate size range of 8–37 nm significantly affected the morbidity and mortality, and caused severe sickness, loss of appetite, weight loss, change in fur colour and shorter average lifespan128.
In this regard, surface coating plays an important part in nanoparticle toxicity. For example, gold nanorods synthesized with cetrimonium bromide (CTAB) were shown to be toxic to mice, but the toxicity greatly diminished when the nanoparticles were washed several times to remove CTAB129. The fundamental concept of encapsulation is to physically separate a potentially hazardous core from the biological system. Further reduced toxicity can be achieved through encapsulation with the above-mentioned PEGylation, polymers, silica or other biologically inert molecules66. A decrease in quantum dot toxicity has also been observed with an increasing number of surface layers130.
Although toxicity issues have hampered clinical translation, progress has also been made in the development of colloidal fluorescent quantum dots for in vivo applications. However, the main barrier to these particles is that most visible–NIR-fluorescent quantum dots are composed of toxic elements, such as arsenic, with highly covalent-bonding character, which causes them to be retained within the reticuloendothelial system131. The toxic elements are also difficult to metabolize and thus may remain intact in the body for many years132. For example, in one study, semiconductor quantum dots injected into mice remained intact for more than 2 years in the mouse tissues123. One potential method of over coming these toxicity issues is to shorten the hydrodynamic diameter of the particle such that it can be filtered by the porous glomerular basement membrane of the kidneys133.
PEG has provided a reasonable stealth effect in bio-fluids134; however, PEG-functionalized nanoparticles are known to interact with certain types of proteins135, possibly resulting in undesirable immune responses because of in situ formation of a protein corona136. An alternative way of using the stealth effect includes the incorporation of zwitterion functionalities onto the surface of the nanoparticles. For example, corona-free nanoparticles were developed with tunable hydrophobicity that serve as platforms to enhance desirable nanobiological behaviour, such as cellular uptake and haemolysis137. In addition, silica nanoparticles conjugated with biotin and cysteine were introduced to suppress corona-associated mistargeting, wherein cysteine was used as a zwitterionic ligand138. In this study, it was reported that a zwitterionic surface aids targeting. Moreover, some researchers found that the fate of nanoparticles and their associated detection efficacy can be substantially affected by a patient-specific corona139,140.
Self-assembled and biodegradable nanomaterials
Major advances for the in vivo use of inorganic particles have also been made by optimizing synthetic schemes. Most notable among these strategies are self-assembly and disassembly as a means to overcome size-limitations of nanoparticles. One example is an attempt to build nanoparticles directly inside living cells from cell-permeable, small-molecular-weight building blocks. The researchers established a method to self-assemble nanoparticles in vivo using a biocompatible condensation reaction141,142. Upon systemic injection into a small animal, designed small molecules can undergo self-condensation and subsequently self-assemble into nano particles on meeting the molecular target143, for example, the apoptosis effector enzyme caspase-3144–146.
In addition to the self-assembled nanoparticles introduced above, biodegradable nanoparticles have garnered attention owing to their biocompatibility and low toxicity in vivo. Numerous organic polymers, such as poly(lactic-co-glycolic acid), poly(butyl cyanoacrylate), poly(alkyl cyanoacrylate) and poly(ethyl cyanoacrylate), are good candidate materials for such nanoparticles because they are biodegradable, biocompatible and compatible with a broad range of therapeutic drugs147. In addition to biodegradable organic polymeric nanoparticles, there are a few classes of inorganic nanoparticles that can be metabolized through non-toxic elements and removed safely from the body after serving as imaging contrast agents. Glass nanospheres148 and mesoporous silica nanoparticles149 have been used for ultrasound imaging and/or MRI of stem cells, and their degradation products can be easily metabolized in the body.
Clinical applications
Clinically, nanomaterial-based imaging agents are used on the basis of either passive targeting by means of leaky vasculature, non-specific uptake by macrophages in lymphoid tissues and sites of inflammation, or molecular imaging by active targeting with surface antibodies or small peptides150. These guiding principles frame much of the clinical advancements in cancer, cardiovascular and inflammation imaging. In addition, the vast majority of clinical translation so far has involved magnetic nanomaterials as contrast agents for MRI. This is probably a result of the pervasiveness of MRI in clinical management compared with other imaging modalities (for example, photoacoustics), as well as the ease of repurposing existing FDA-approved magnetic iron oxide particles, such as ferumoxytol (TABLE 2), that were originally approved as iron-replacement therapies151. Accordingly, much of the discussion in this section focuses on magnetic nanomaterials for MRI to reflect the existing literature and clinical landscape.
Table 2.
Summary of clinically available or clinically translatable nanomaterials for in vivo nanodiagnostics
| Name | Material | Modality | Organ or disease | Half-life | Size | Status | Comment |
|---|---|---|---|---|---|---|---|
| C dots* | Silica–organic hybrid particles | PET or optical | Melanoma and brain cancer | 4 days | 6–7 nm | FDA IND |
NCT01266096 NCT02106598 |
| Clariscan (feruglose)* | Ultrasmall superparamagnetic iron oxide | MR | Liver and spleen | 3–4 hours | 11–20 nm | – | Development discontinued |
| Combidex (ferumoxtran)* |
Fe3O4 coated with dextran | MR | Lymph node | 24–30 hours | 30 nm | IND, NDA withdrawal | Development discontinued (2010) NCT02751606 |
| 64Cu-25%-CANF-Comb | Nanoparticle
radio-pharmaceutical 64Cu-25%-CANF-Comb |
PET or MR | Atherosclerosis | 12.7 hours (radioactivity) | 16 nm | FDA IND |
NCT02417688 NCT02498379 |
| Definity‡ | Perflutren lipid microspheres | US | Pulmonary and heart | 1.3 minutes (gas) | 1.1–3.3 μm | FDA (2001) | Micrometre-size |
| Feridex (ferumoxides)* | Fe3O4–γ-Fe2O3 coated with dextran | MR | Liver | 2 hours | 100 nm | FDA (1996) | Discontinued (2008) |
| Feraheme (ferumoxytol)‡ |
Carboxymethyldextran with iron oxide core | Possible MR | Anaemia and pancreatic cancer | 15 hours | 17–31 nm | FDA (2009) | Approved for anaemia and NCT00920023 |
| Luminity‡ | Lipid-encapsulated perflutren microspheres | US | Echocardiography | 1.3 minutes (gas) | 1–10 μm | EMA (2009) | Micrometre-size |
| Lumirem (ferumoxsil)‡ | Siloxane-coated non-stoichiometric magnetite, [FeOx(C5H13N2SiO2)y] |
MR | Gastrointestinal | 2.4 ± 0.2 hours | 400 nm | FDA (1996) | Oral, currently the only available iron oxide |
| N1177* | Crystalline iodinated nanoparticles | CT | Atherosclerosis | >2 hours | 259 nm, 1–5 μm (aerosol) | – | In clinical trial |
| Optison (perflutren)‡ | Albumin-coated perflutren lipid microspheres | US | Lymph node and myocardial | 1.3 minutes (gas) | 3–4.5 μm | FDA (1997) EMA (1998) |
Micrometre-size |
| Resovist (ferucarbotran)* | Fe3O4 with carboxydextran | MR | Liver | 2.4–3.6 hours | 60 nm | Sweden (2001) | Discontinued (2009) |
| Sonazoid* | Lipid-stabilized perfluorobutane microspheres | US | Heart and liver | 30 − 45 minutes (elimination) | 2.6 μm | – | Development suspended |
| SonoVue‡ | Microbubbles stabilized by phospholipids with SF6 | US | Echocardiography | 6 minutes | 2.5 μm | EMA (2001) | Micrometre-size |
| 99mTc sulfur colloid* | 99mTc sulfur colloid nanoparticles | SPECT | Breast cancer and lymph node | 6.02 hours (radioactivity) | 7.5–53.9 nm | FDA (1978) | Discontinued |
Additional information regarding the listed compounds may be found in the National Institute of Health Molecular Imaging and Contrast Agent Database. CANF, C-type atrial naturetic factor; C dots, Cornell dots; CT, computed tomography; EMA, European Medicines Agency; FDA, Food and Drug Administration; IND, investigational new drug; MR, magnetic resonance; NDA, new drug application; PET, positron emission tomography; US, ultrasound; SPECT, single photon emission computed tomography.
In developmental phase or development discontinued.
Available in clinic.
Cancer
One of the earliest applications of nanotechnology in medical imaging was the use of SPIONs for the highly sensitive detection of liver tumours152,153. Benign lesions and normal hepatic tissue have a greater tendency to accumulate SPIONs because of their increased levels of phagocytic Kupffer cells and blood pools compared with cancerous lesions154. Thus, regions with decreased signal on T2-weighted accumulation phase images denote likely cancerous nodules155. In one example, hepatocellular carcinoma in a patient population with cirrhosis was readily detectable using SPIO-enhanced MRI with a sensitivity comparable to that of (FIG. 5a). Although the passive delineation of phagocytic and non-phagocytic tissue has been of little clinical relevance outside of the liver, it has also been used to effectively image lymph nodes for cancer staging156–160. Lymph node metastases are notoriously difficult to discern by ultrasound, CT and MRI, especially without use of contrast161–163. Iron oxide particles have been shown to accumulate uniformly in macrophages of non-metastatic lymph nodes, causing them to appear homogenous and hypointense on T2-weighted images compared with metastatic nodes, which exhibit abnormal patterns of accumulation and regions of hyperintensity164.
Figure 5. Clinical translation of nanomaterial imaging agents.
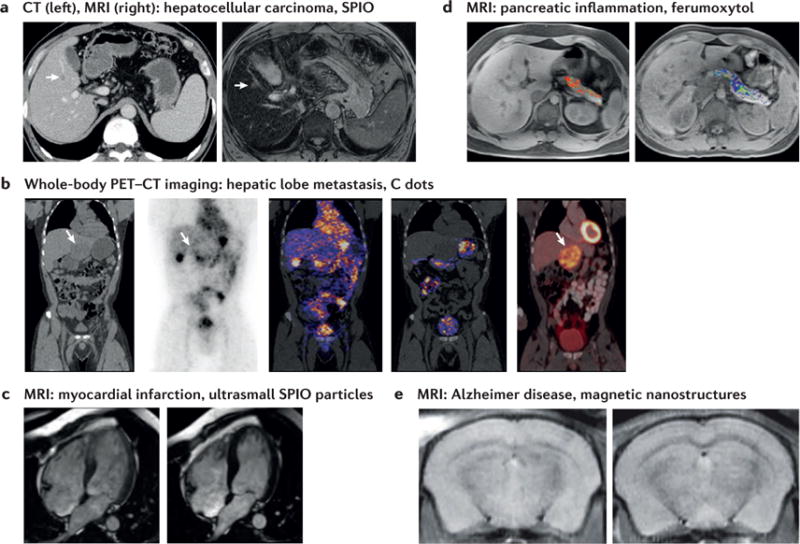
a | A 7 mm hepatocellular carcinoma nodule in a 61-year-old man shows low attenuation in the CT scan (arrow, left) and nodular hyperintensity on an SPIO-enhanced T2-weighted magnetic resonance image (arrow, right). b | Whole-body PET-CT imaging of particle biodistribution of Cornell dots (C dots) in a single patient showing a hypodense left hepatic lobe metastasis on a reformatted coronal CT scan (first image). Particle uptake is shown in the peripheral tumour area 4 hours after injection through coronal PET (second image), and in the bladder, stomach, intestines, gallbladder and heart (third and fourth images), and the hepatic metastasis with standard [18F]FDG PET–CT (fifth image). c | Long-axis view of a patient undergoing cardiovascular magnetic resonance imaging (MRI). Comparison of pre- and post-Feraheme scans in the setting of septal myocardial infarction shows hyperenhancement in the septal wall after 0 and 24 hours post-Feraheme injection (left and right images, respectively). d | Increased pancreatic ferumoxytol uptake in a patient with recently diagnosed type I diabetes (left) compared with a healthy control subject (right) seen with MRI. e | In vivo MRI of AβO-targeted probe mice showing hippocampal localization in an Alzheimer disease model (left) compared with a wild-type control brain (right). FDG, fluorodeoxyglucose; PET–CT, positron emission tomography–computed tomography; SPIO, superparamagnetic iron oxide. Panel a is reproduced with permission from REF. 157, Radiological Society of North America. Panel b is reproduced with permission from REF. 167, AAAS. Panel c is reproduced with permission from REF. 181, American Heart Association. Panel d is reproduced with permission from REF. 189, National Academy of Sciences. Panel e is reproduced from REF. 192, Macmillan Publishers Limited.
Less clinically advanced than the examples described above, targeted nanomaterials have shown potential for the molecular imaging of cancer. In particular, C dots (Cornell dots) are a promising imaging strategy in metastatic melanoma165–167. C dots are 6–7 nm core–shell hybrid silica particles capable of simultaneous PET–optical imaging with a Cy5 dye core and surface-attached 124 I radiolabels. The particles are also surface functionalized with cRGDY peptides for targeting of αvβ3 integrin- expressing tumours. In a first-in-human clinical trial of five patients, these particles exhibited high in vivo stability, were well tolerated and demonstrated evidence of accumulation at lesions in several subjects167. In one patient, particle uptake along the peripheral tumour area of a hepatic metastasis was seen as early as 4 hours after injection (FIG. 5b). A larger pilot study of 30 patients at Memorial Sloan Kettering Cancer Center, evaluating these particles for intraoperative mapping of sentinel lymph nodes in melanoma, breast, cervical and uterine cancer, is now recruiting patients (TABLE 2, trial identifier NCT02106598).
Cardiovascular imaging
Imaging of both cardiac and vascular pathology has largely depended on the increased inflammation at sites of disease. In atherosclerosis, abnormalities in cholesterol metabolism ultimately lead to vascular deposition of lipid-rich plaques, which can cause local ischaemia168. Macrophage infiltration within plaques contributes to the local inflammatory process and renders them unstable: that is, at risk of rupture and subsequent vascular occlusion leading to acute myocardial infarction or stroke168. Although the extent of vessel narrowing can be visualized with anatomic techniques including X-ray, MRI and CT angio graphy, lumen size is a poor predictor of rupture risk169–171. Thus, functional interrogation of atherosclerotic plaque immunology is a promising strategy for identifying patients with high risk of rupture and monitoring therapies. Nanomaterial-mediated imaging of atherosclerosis has spanned MRI, CT and PET171, including multimodal approaches with added optical capabilities for fluorescence-based agent validation in preclinical studies172. For example, a crystalline iodinated nanoparticle (N1177, TABLE 2), with high affinity for macrophages, is capable of detecting intraplaque macrophages and has been used for CT imaging in a rabbit model, based on its energy-dependent photon attenuation173. Magnetic iron oxide nanoparticles that are taken up by plaque macrophages represent the clinically most advanced approach174–176, but challenges remain associated with the small blood volumes in many vessels of interest — namely, the coronary and carotid arteries177.
Similar to atherosclerosis, myocardium remodelling after infarction is another immune-mediated process that can be imaged with macrophage tracking. Immediately after infarction, macrophages have a key role in the removal of necrotic tissue, angiogenesis and collagen synthesis, but their prolonged persistence at the site of injury can generate damaging free radicals and contribute to scar tissue formation178. Thus, tracking macrophage infiltration over time can potentially be used as a diagnostic for post-infarction recovery. Both iron oxides179 and Gd-based180 strategies have been used for this purpose, and key clinical studies performed with ferumoxytol181 demonstrated particle uptake in both the infarct and peri-infarct regions of the left ventricle as visualized by T2-weighted hypo-enhancement in these areas. In one study using ferumoxytol in patients with acute myo cardial infarction, there was clear particle uptake in both infarcted and remote myocardium 24 hours after infusion (FIG. 5c). Interestingly, use of a different SPIO particle, ferucarbotran, in a small clinical study did not show an improvement of infarct zone visualization compared with standard Gd-based methods182. Related strategies are undergoing preclinical development for detection of myocarditis183 and for monitoring heart transplant rejection184,185.
Emerging applications
The clinical translation of imaging nanodiagnostics has been largely restricted to cancer and cardiovascular disease; however, emerging applications in type I diabetes and Alzheimer disease have garnered recent clinical interest and are briefly discussed here. Type I diabetes is distinct from the insulin- resistance-mediated type II diabetes in that it is a chronic autoimmune process resulting in destruction of the insulin-producing β cells of the pancreas185. Given the lack of existing methods to assess disease progression and monitor response to therapy, there is a great clinical need and push to develop non-invasive methods of visualizing pancreatic inflammation186–188. In a clinical study using ferumoxytol to target infiltrating macrophages in the pancreas, researchers noted not only increased nanoparticle accumulation in the recently diagnosed patients, but also increased heterogeneity in signal intensity compared with healthy controls using 3T MRI189 (FIG. 5b).
Although still in preclinical research, the novelty and potential impact of targeted imaging in Alzheimer disease is also worthy of discussion. An important advance in imaging Alzheimer disease was the development of PET tracers specific for amyloid plaques, but the clinical progression of the disease may not correlate with the presence of plaques, and more cost-effective alternatives to PET are being actively developed190. In one study, ex vivo T2-weighted MRI performed on Tg2576 mice injected with sub-100 nm SPIONs coated with amyloid-targeting curcumin showed clear visualization of plaques consistent with histological patterns191. Another promising approach targeted Aβ oligomers, an early-stage biomarker of Alzheimer disease, with antibody-laden 12–16 nm iron oxide magnetic nanostructures stabilized with nitro- dopamine and PEG192. In cellular labelling, murine studies and isolated samples of human brain tissue, the particle was capable of distinguishing AβO-containing samples, setting the stage for earlier diagnostics in Alzheimer disease (FIG. 5e).
Ex vivo nanodiagnostic applications
Numerous clinical and preclinical ex vivo and/or in vitro nanodiagnostic technologies are now available in the field of clinical diagnostics. As mentioned earlier, pregnancy test kits, which often consist of GNPs that undergo a plasmonic colorimetric change on sensing a hormone level change in the urine, are an exemplary application of in vitro nanodiagnostics. Likewise, various in vitro diagnostics including lateral flow immunoassays have benefited from the development of nanomaterials193,194. In contrast to in vivo nanodiagnostics, ex vivo/ in vitro nanodiagnostics represents an indirect or remote way to investigate disease in minimally invasive manners (for example, detecting biomarkers in blood, urine and saliva). However, because endogenous biomarker detection is sometimes hindered by highly variable background noise, nanomaterials have been used to increase the signal-to-noise ratio of the biomarkers in biological samples. As an alternative, exogenous bio-marker detection ex vivo has garnered much attention recently, owing to unique biomarker presence under a triggered condition. So-called nanoworms195 were developed for diagnosing non-communicable diseases (for example, colorectal cancer) with paper microfluid-ics196. Segmented nanoworms, composed of magnetic iron oxide and coated with a polymer, are able to find and attach to tumours. These nano worms are reformulated to release ligand-encoded reporters designed for detection by a companion point-of-care diagnostic. Unfortunately, because nanoworms passively target and attach to tumours, their delivery may suffer from low yield. Alternatively, we introduced tumour-activatable minicircles197 that greatly improve tumour detectability by detecting unique blood biomarkers for cancers198. Tumour-activatable minicircles encoding a secretable biomarker downstream of the tumour-specific survivin promoter are packaged in nanocomplexes and delivered systemically. Although the minicircles are delivered to many cell types, the promoter is only active (and thus reporter only generated) in tumour cells. Detecting such reporter proteins from a blood sample aids ex vivo/ in vitro detection of the given disease.
Perspective
Clinically available imaging modalities have provided a non-invasive way to look within the human body. As is the case with mammography, which can detect lesions in breast tissue even when they are too small to be felt by palpation, non-invasive imaging modalities have greatly decreased the detection threshold for earlier disease diagnosis. Many traditional imaging modalities are, however, unable to provide single-cell or molecular-level information (at any depth) and are therefore still limited in their sensitivity and specificity. Accordingly, the development of nanomaterials that enhance the sensitivity and specificity of imaging modalities has been a dynamic research area for the past two decades. In particular, many nanomaterials have been developed with the aim of reaching the level of single-cell sensitivity and specificity (at least at limited imaging depths), which may reveal the true origin of diseases. Achieving these aims requires an appreciation for both the underlying physics of clinical imaging modalities and the biological processes that underlie disease. Nanomaterials present one unique strategy towards achieving these goals.
With the exception of iron oxide particles, nanomaterials have seldom been used in clinical diagnostics. We believe that this is primarily because of difficulties in attaining acceptable pharmacokinetic properties and proper quality control, as well as issues of toxicity, biodegradation and clearance of developed nanomaterials. Additionally, materials may exhibit new or changed physico chemical properties at the nanoscale, which may serve as a double-edged sword for the development of new products, especially for in vivo use199. In this regard, the FDA approaches nanomaterial consideration through two lenses: product quality assessment for standardized nanomaterial characterization, quality control and manufacturing; and product safety assessment for biodistribution, clearance, metabolism and toxi cology. Therefore, it is imperative for researchers to reflect these considerations when developing nano scale materials for in vivo use.
Readers can now appreciate that all aspects of a nano material — from the choice of material to surface modifications — must be thoroughly considered and tested before it can be readily used in patients. However, the widespread clinical use of nanomaterials has been impeded by several factors, including nanomaterial biodistribution, unknown toxicity profiles and short clearance times. Therefore, to use nanodiagnostics effectively in a clinical setting, disease heterogeneity and human variability in response to disease should be carefully considered. Despite these hurdles, we envisage that nanodiagnostics accompanied with imaging modalities will serve as an effective diagnostic tool in the near future.
Acknowledgments
This work was supported by the US National Institutes of Health (NIH) Award U54CA151459 (Center for Cancer Nanotechnology Excellence and Translation). The authors thank the Ben & Catherine Ivy Foundation, the Canary Foundation and the Sir Peter Michael Foundation for supporting their research. They thank H. Guo, G. Gold, E. Rosenthal, R. Barth, J. Wu, X. Qin, A. Iagaru, D.-h. Ha, J. Jokerst, B. R. Smith, T. Haywood, A. F. Sabour, E. Robinson and J. Schwimmer for their input.
Footnotes
Competing interests statement
The authors declare no competing interests.
Publisher’s note
Springer Nature remains neutral with regard to jurisdictional claims in published maps and institutional affiliations.
DATABASES
National Institutes of Health Molecular Imaging and Contrast Agent Database: http://www.ncbi.nlm.nih.gov/books/NBK5330/
XCOM: Photon Cross Section Database: https://www.nist.gov/pml/xcom-photon-cross-sections-database
FURTHER INFORMATION
The Statistics Portal: https://www.statista.com/statistics/184566/deaths-by-cancer-in-the-us-since-1950/
References
- Cairns J. The treatment of diseases and the war against cancer. Sci Am. 1985;253:51–59. doi: 10.1038/scientificamerican1185-51. [DOI] [PubMed] [Google Scholar]
- Nestor PJ, Scheltens P, Hodges JR. Advances in the early detection of Alzheimer’s disease. Nat Med. 2004;10(Suppl):S34–S41. doi: 10.1038/nrn1433. [DOI] [PubMed] [Google Scholar]
- Greish K. Enhanced permeability and retention (EPR) effect for anticancer nanomedicine drug targeting. Methods Mol Biol. 2010;624:25–37. doi: 10.1007/978-1-60761-609-2_3. [DOI] [PubMed] [Google Scholar]
- Lee DE, et al. Multifunctional nanoparticles for multimodal imaging and theragnosis. Chem Soc Rev. 2012;41:2656–2672. doi: 10.1039/c2cs15261d. [DOI] [PubMed] [Google Scholar]
- Anker JN, et al. Biosensing with plasmonic nanosensors. Nat Mater. 2008;7:442–453. doi: 10.1038/nmat2162. [DOI] [PubMed] [Google Scholar]
- Jokerst JV, Gambhir SS. Molecular imaging with theranostic nanoparticles. Acc Chem Res. 2011;44:1050–1060. doi: 10.1021/ar200106e. [DOI] [PMC free article] [PubMed] [Google Scholar]
- Park SM, Sabour AF, Son JH, Lee SH, Lee LP. Toward integrated molecular diagnostic system (i MDx): principles and applications. IEEE Trans Biomed Eng. 2014;61:1506–1521. doi: 10.1109/TBME.2014.2309119. [DOI] [PMC free article] [PubMed] [Google Scholar]
- Waldrop MM. The chips are down for Moore’s law. Nature. 2016;530:144–147. doi: 10.1038/530144a. [DOI] [PubMed] [Google Scholar]
- Jain KK. Applications of nanobiotechnology in clinical diagnostics. Clin Chem. 2007;53:2002–2009. doi: 10.1373/clinchem.2007.090795. [DOI] [PubMed] [Google Scholar]
- Jain KK. Nanotechnology in clinical laboratory diagnostics. Clin Chim Acta. 2005;358:37–54. doi: 10.1016/j.cccn.2005.03.014. [DOI] [PubMed] [Google Scholar]
- Picard JD. History of mammography. Bull Acad Natl Med. 1998;182:1613–1620. (in French) [PubMed] [Google Scholar]
- Burghardt AJ, Link TM, Majumdar S. High-resolution computed tomography for clinical imaging of bone microarchitecture. Clin Orthop Relat Res. 2011;469:2179–2193. doi: 10.1007/s11999-010-1766-x. [DOI] [PMC free article] [PubMed] [Google Scholar]
- Wokrina T, et al. High-resolution murine brain imaging at 15.2 Tesla. Proc Int Soc Magn Reson Med Abstr. 2012;20:3233. [Google Scholar]
- King JP, et al. Room-temperature in situ nuclear spin hyperpolarization from optically pumped nitrogen vacancy centres in diamond. Nat Commun. 2015;6:8965. doi: 10.1038/ncomms9965. [DOI] [PMC free article] [PubMed] [Google Scholar]
- Hersman FW, et al. Large production system for hyperpolarized 129Xe for human lung imaging studies. Acad Radiol. 2008;15:683–692. doi: 10.1016/j.acra.2007.09.020. [DOI] [PMC free article] [PubMed] [Google Scholar]
- Kirby M, et al. Hyperpolarized 3He and 129Xe MR imaging in healthy volunteers and patients with chronic obstructive pulmonary disease. Radiology. 2012;265:600–610. doi: 10.1148/radiol.12120485. [DOI] [PubMed] [Google Scholar]
- Nikiel-Osuchowska A, et al. Metastability exchange optical pumping of 3He gas up to hundreds of millibars at 4.7 Tesla. Eur Phys J D. 2013;67:1–29. [Google Scholar]
- Ardenkjaer-Larsen JH, et al. Increase in signal-to-noise ratio of >10,000 times in liquid-state NMR. Proc Natl Acad Sci USA. 2003;100:10158–10163. doi: 10.1073/pnas.1733835100. [DOI] [PMC free article] [PubMed] [Google Scholar]
- Natterer J, Bargon J. Parahydrogen induced polarization. Prog Nucl Magn Reson Spectrosc. 1997;31:293–315. [Google Scholar]
- James ML, Gambhir SS. A molecular imaging primer: modalities, imaging agents, and applications. Physiol Rev. 2012;92:897–965. doi: 10.1152/physrev.00049.2010. [DOI] [PubMed] [Google Scholar]
- Sarder P, Maji D, Achilefu S. Molecular probes for fluorescence lifetime imaging. Bioconjug Chem. 2015;26:963–974. doi: 10.1021/acs.bioconjchem.5b00167. [DOI] [PMC free article] [PubMed] [Google Scholar]
- Zavaleta CL, et al. Multiplexed imaging of surface enhanced Raman scattering nanotags in living mice using noninvasive Raman spectroscopy. Proc Natl Acad Sci USA. 2009;106:13511–13516. doi: 10.1073/pnas.0813327106. [DOI] [PMC free article] [PubMed] [Google Scholar]
- Zavaleta CL, et al. A Raman-based endoscopic strategy for multiplexed molecular imaging. Proc Natl Acad Sci USA. 2013;110:E2288–2297. doi: 10.1073/pnas.1211309110. [DOI] [PMC free article] [PubMed] [Google Scholar]
- Garai E, et al. A real-time clinical endoscopic system for intraluminal, multiplexed imaging of surface-enhanced Raman scattering nanoparticles. PLoS ONE. 2015;10:e0123185. doi: 10.1371/journal.pone.0123185. [DOI] [PMC free article] [PubMed] [Google Scholar]
- de la Zerda A, et al. Carbon nanotubes as photoacoustic molecular imaging agents in living mice. Nat Nanotechnol. 2008;3:557–562. doi: 10.1038/nnano.2008.231. [DOI] [PMC free article] [PubMed] [Google Scholar]
- de la Zerda A, et al. Ultrahigh sensitivity carbon nanotube agents for photoacoustic molecular imaging in living mice. Nano Lett. 2010;10:2168–2172. doi: 10.1021/nl100890d. [DOI] [PMC free article] [PubMed] [Google Scholar]
- Antaris AL, et al. A small-molecule dye for NIR-II imaging. Nat Mater. 2016;15:235–242. doi: 10.1038/nmat4476. [DOI] [PubMed] [Google Scholar]
- Thakor AS, Gambhir SS. Nanooncology: the future of cancer diagnosis and therapy. CA Cancer J Clin. 2013;63:395–418. doi: 10.3322/caac.21199. [DOI] [PubMed] [Google Scholar]
- Zhuang H, Codreanu I. Growing applications of FDG PET-CT imaging in non-oncologic conditions. J Biomed Res. 2015;29:189–202. doi: 10.7555/JBR.29.20140081. [DOI] [PMC free article] [PubMed] [Google Scholar]
- Gowrishankar G, et al. Investigation of 6-[18F]-fluoromaltose as a novel PET tracer for imaging bacterial infection. PLoS ONE. 2014;9:e107951. doi: 10.1371/journal.pone.0107951. [DOI] [PMC free article] [PubMed] [Google Scholar]
- Molton JS, Leek FA, Ng LH, Totman JJ, Paton NIA. Novel approach to CT, MR, and PET examination of patients with infections requiring stringent airborne precautions. Radiology. 2016;278:881–887. doi: 10.1148/radiol.2015150289. [DOI] [PubMed] [Google Scholar]
- Wang Y, et al. Evaluating the pharmacokinetics and in vivo cancer targeting capability of Au nanocages by positron emission tomography imaging. ACS Nano. 2012;6:5880–5888. doi: 10.1021/nn300464r. [DOI] [PMC free article] [PubMed] [Google Scholar]
- Wang W, et al. Pharmacokinetic analysis of hypoxia 18F-fluoromisonidazole dynamic PET in head and neck cancer. J Nucl Med. 2010;51:37–45. doi: 10.2967/jnumed.109.067009. [DOI] [PMC free article] [PubMed] [Google Scholar]
- Chaudhry AA, et al. Utility of positron emission tomography-magnetic resonance imaging in musculoskeletal imaging. World J Radiol. 2016;8:268–274. doi: 10.4329/wjr.v8.i3.268. [DOI] [PMC free article] [PubMed] [Google Scholar]
- Haywood T, et al. Carbon-11 radiolabelling of organosulfur compounds: 11C synthesis of the progesterone receptor agonist tanaproget. Chemistry. 2015;21:9034–9038. doi: 10.1002/chem.201501089. [DOI] [PubMed] [Google Scholar]
- Gambhir SS. Molecular imaging of cancer with positron emission tomography. Nat Rev Cancer. 2002;2:683–693. doi: 10.1038/nrc882. [DOI] [PubMed] [Google Scholar]
- Cherry SR, Dahlbom M. In: PET: Physics, Instrumentation, and Scanners. Phelps ME, editor. Springer. 2006. pp. 1–117. [Google Scholar]
- Rahmim A, Zaidi H. PET versus SPECT: strengths, limitations and challenges. Nucl Med Commun. 2008;29:193–207. doi: 10.1097/MNM.0b013e3282f3a515. [DOI] [PubMed] [Google Scholar]
- de Swart J, et al. Utilizing high-energy ?-photons for high-resolution 213Bi SPECT in mice. J Nucl Med. 2015;57:486–492. doi: 10.2967/jnumed.115.157685. [DOI] [PubMed] [Google Scholar]
- Goorden MC, et al. VECTor: a preclinical imaging system for simultaneous submillimeter SPECT and PET. J Nucl Med. 2013;54:306–312. doi: 10.2967/jnumed.112.109538. [DOI] [PubMed] [Google Scholar]
- Pysz MA, Gambhir SS, Willmann JK. Molecular imaging: current status and emerging strategies. Clin Radiol. 2010;65:500–516. doi: 10.1016/j.crad.2010.03.011. [DOI] [PMC free article] [PubMed] [Google Scholar]
- Runge VM, et al. The use of Gd DTPA as a perfusion agent and marker of blood-brain barrier disruption. Magn Reson Imaging. 1985;3:43–55. doi: 10.1016/0730-725x(85)90008-6. [DOI] [PubMed] [Google Scholar]
- Gramiak R, Shah PM. Echocardiography of the aortic root. Invest Radiol. 1968;3:356–366. doi: 10.1097/00004424-196809000-00011. [DOI] [PubMed] [Google Scholar]
- Bachawal SV, et al. Earlier detection of breast cancer with ultrasound molecular imaging in a transgenic mouse model. Cancer Res. 2013;73:1689–1698. doi: 10.1158/0008-5472.CAN-12-3391. [DOI] [PMC free article] [PubMed] [Google Scholar]
- Deshpande N, Needles A, Willmann JK. Molecular ultrasound imaging: current status and future directions. Clin Radiol. 2010;65:567–581. doi: 10.1016/j.crad.2010.02.013. [DOI] [PMC free article] [PubMed] [Google Scholar]
- Pysz MA, Willmann JK. Targeted contrast-enhanced ultrasound: an emerging technology in abdominal and pelvic imaging. Gastroenterology. 2011;140:785–790. doi: 10.1053/j.gastro.2011.01.027. [DOI] [PMC free article] [PubMed] [Google Scholar]
- Blanco E, Shen H, Ferrari M. Principles of nanoparticle design for overcoming biological barriers to drug delivery. Nat Biotechnol. 2015;33:941–951. doi: 10.1038/nbt.3330. [DOI] [PMC free article] [PubMed] [Google Scholar]
- Smith BR, Gambhir SS. Nanomaterials for in vivo imaging. Chem Rev. 2017;117:901–986. doi: 10.1021/acs.chemrev.6b00073. [DOI] [PubMed] [Google Scholar]
- Lee H, et al. An endoscope with integrated transparent bioelectronics and theranostic nanoparticles for colon cancer treatment. Nat Commun. 2015;6:10059. doi: 10.1038/ncomms10059. [DOI] [PMC free article] [PubMed] [Google Scholar]
- Magaye R, Zhao J, Bowman L, Ding M. Genotoxicity and carcinogenicity of cobalt-, nickel- and copper-based nanoparticles. Exp Ther Med. 2012;4:551–561. doi: 10.3892/etm.2012.656. [DOI] [PMC free article] [PubMed] [Google Scholar]
- Kim BH, et al. Large-scale synthesis of uniform and extremely small-sized iron oxide nanoparticles for high-resolution T1 magnetic resonance imaging contrast agents. J Am Chem Soc. 2011;133:12624–12631. doi: 10.1021/ja203340u. [DOI] [PubMed] [Google Scholar]
- Ling D, Lee N, Hyeon T. Chemical synthesis and assembly of uniformly sized iron oxide nanoparticles for medical applications. Acc Chem Res. 2015;48:1276–1285. doi: 10.1021/acs.accounts.5b00038. [DOI] [PubMed] [Google Scholar]
- Hainfeld JF, Slatkin DN, Focella TM, Smilowitz HM. Gold nanoparticles: a new X-ray contrast agent. Br J Radiol. 2006;79:248–253. doi: 10.1259/bjr/13169882. [DOI] [PubMed] [Google Scholar]
- Jackson PA, Rahman WN, Wong CJ, Ackerly T, Geso M. Potential dependent superiority of gold nanoparticles in comparison to iodinated contrast agents. Eur J Radiol. 2010;75:104–109. doi: 10.1016/j.ejrad.2009.03.057. [DOI] [PubMed] [Google Scholar]
- Yang X, Yang M, Pang B, Vara M, Xia Y. Gold nanomaterials at work in biomedicine. Chem Rev. 2015;115:10410–10488. doi: 10.1021/acs.chemrev.5b00193. [DOI] [PubMed] [Google Scholar]
- Ferreira MF, et al. Gold nanoparticles functionalised with stable, fast water exchanging Gd3+ chelates as high relaxivity contrast agents for MRI. Dalton Trans. 2012;41:5472–5475. doi: 10.1039/c2dt30388d. [DOI] [PubMed] [Google Scholar]
- Alric C, et al. Gadolinium chelate coated gold nanoparticles as contrast agents for both X-ray computed tomography and magnetic resonance imaging. J Am Chem Soc. 2008;130:5908–5915. doi: 10.1021/ja078176p. [DOI] [PubMed] [Google Scholar]
- Zhao Y, et al. Copper-64-alloyed gold nanoparticles for cancer imaging: improved radiolabel stability and diagnostic accuracy. Angew Chem Int Ed. 2014;53:156–159. doi: 10.1002/anie.201308494. [DOI] [PubMed] [Google Scholar]
- Zhao Y, Sultan D, Detering L, Luehmann H, Liu Y. Facile synthesis, pharmacokinetic and systemic clearance evaluation, and positron emission tomography cancer imaging of 64Cu–Au alloy nanoclusters. Nanoscale. 2014;6:13501–13509. doi: 10.1039/c4nr04569f. [DOI] [PubMed] [Google Scholar]
- Kircher MF, et al. A brain tumor molecular imaging strategy using a new triple-modality MRI- photoacoustic–Raman nanoparticle. Nat Med. 2012;18:829–834. doi: 10.1038/nm.2721. [DOI] [PMC free article] [PubMed] [Google Scholar]
- Moriggi L, et al. Gold nanoparticles functionalized with gadolinium chelates as high-relaxivity MRI contrast agents. J Am Chem Soc. 2009;131:10828–10829. doi: 10.1021/ja904094t. [DOI] [PubMed] [Google Scholar]
- Wang Y, et al. Radioluminescent gold nanocages with controlled radioactivity for real-time in vivo imaging. Nano Lett. 2013;13:581–585. doi: 10.1021/nl304111v. [DOI] [PMC free article] [PubMed] [Google Scholar]
- Qian X, et al. In vivo tumor targeting and spectroscopic detection with surface-enhanced Raman nanoparticle tags. Nat Biotechnol. 2008;26:83–90. doi: 10.1038/nbt1377. [DOI] [PubMed] [Google Scholar]
- Lee K, Cui Y, Lee LP, Irudayaraj J. Quantitative imaging of single mRNA splice variants in living cells. Nat Nanotechnol. 2014;9:474–480. doi: 10.1038/nnano.2014.73. [DOI] [PMC free article] [PubMed] [Google Scholar]
- Park SM, Huh YS, Craighead HG, Erickson D. A method for nanofluidic device prototyping using elastomeric collapse. Proc Natl Acad Sci USA. 2009;106:15549–15554. doi: 10.1073/pnas.0904004106. [DOI] [PMC free article] [PubMed] [Google Scholar]
- Michalet X, et al. Quantum dots for live cells. in vivo imaging, and diagnostics. Science. 2005;307:538–544. doi: 10.1126/science.1104274. [DOI] [PMC free article] [PubMed] [Google Scholar]
- Kairdolf BA, et al. Semiconductor quantum dots for bioimaging and biodiagnostic applications. Annu Rev Anal Chem. 2013;6:143–162. doi: 10.1146/annurev-anchem-060908-155136. [DOI] [PMC free article] [PubMed] [Google Scholar]
- Gao X, Cui Y, Levenson RM, Chung LW, Nie S. In vivo cancer targeting and imaging with semiconductor quantum dots. Nat Biotechnol. 2004;22:969–976. doi: 10.1038/nbt994. [DOI] [PubMed] [Google Scholar]
- Stroh M, et al. Quantum dots spectrally distinguish multiple species within the tumor milieu in vivo. Nat Med. 2005;11:678–682. doi: 10.1038/nm1247. [DOI] [PMC free article] [PubMed] [Google Scholar]
- Alivisatos AP. Semiconductor clusters, nanocrystals, and quantum dots. Science. 1996;271:933. [Google Scholar]
- Chen O, et al. Compact high-quality CdSe–CdS core– shell nanocrystals with narrow emission linewidths and suppressed blinking. Nat Mater. 2013;12:445–451. doi: 10.1038/nmat3539. [DOI] [PMC free article] [PubMed] [Google Scholar]
- Han HS, et al. Quantum dot/antibody conjugates for in vivo cytometric imaging in mice. Proc Natl Acad Sci USA. 2015;112:1350–1355. doi: 10.1073/pnas.1421632111. [DOI] [PMC free article] [PubMed] [Google Scholar]
- Medintz IL, Uyeda HT, Goldman ER, Mattoussi H. Quantum dot bioconjugates for imaging, labelling and sensing. Nat Mater. 2005;4:435–446. doi: 10.1038/nmat1390. [DOI] [PubMed] [Google Scholar]
- Lemon CM, et al. Micelle-encapsulated quantum dot-porphyrin assemblies as in vivo two-photon oxygen sensors. J Am Chem Soc. 2015;137:9832–9842. doi: 10.1021/jacs.5b04765. [DOI] [PMC free article] [PubMed] [Google Scholar]
- Pons T, et al. Cadmium-free CuInS2/ZnS quantum dots for sentinel lymph node imaging with reduced toxicity. ACS Nano. 2010;4:2531–2538. doi: 10.1021/nn901421v. [DOI] [PubMed] [Google Scholar]
- Gu YP, Cui R, Zhang ZL, Xie ZX, Pang DW. Ultrasmall near-infrared Ag2Se quantum dots with tunable fluorescence for in vivo imaging. J Am Chem Soc. 2012;134:79–82. doi: 10.1021/ja2089553. [DOI] [PubMed] [Google Scholar]
- Yu JH, et al. High-resolution three-photon biomedical imaging using doped ZnS nanocrystals. Nat Mater. 2013;12:359–366. doi: 10.1038/nmat3565. [DOI] [PubMed] [Google Scholar]
- Park JH, et al. Biodegradable luminescent porous silicon nanoparticles for in vivo applications. Nat Mater. 2009;8:331–336. doi: 10.1038/nmat2398. [DOI] [PMC free article] [PubMed] [Google Scholar]
- Torchilin VP. PEG-based micelles as carriers of contrast agents for different imaging modalities. Adv Drug Deliv Rev. 2002;54:235–252. doi: 10.1016/s0169-409x(02)00019-4. [DOI] [PubMed] [Google Scholar]
- Petersen AL, Hansen AE, Gabizon A, Andresen TL. Liposome imaging agents in personalized medicine. Adv Drug Deliv Rev. 2012;64:1417–1435. doi: 10.1016/j.addr.2012.09.003. [DOI] [PubMed] [Google Scholar]
- Gong H, Peng R, Liu Z. Carbon nanotubes for biomedical imaging: the recent advances. Adv Drug Deliv Rev. 2013;65:1951–1963. doi: 10.1016/j.addr.2013.10.002. [DOI] [PubMed] [Google Scholar]
- Dresselhaus MS, Dresselhaus G, Saito R, Jorio A. Raman spectroscopy of carbon nanotubes. Phys Rep. 2005;409:47–99. [Google Scholar]
- Smith BR, et al. Selective uptake of single-walled carbon nanotubes by circulating monocytes for enhanced tumour delivery. Nat Nanotechnol. 2014;9:481–487. doi: 10.1038/nnano.2014.62. [DOI] [PMC free article] [PubMed] [Google Scholar]
- Wu L, et al. A green synthesis of carbon nanoparticle from honey for real-time photoacoustic imaging. Nano Res. 2013;6:312–325. doi: 10.1007/s12274-013-0308-8. [DOI] [PMC free article] [PubMed] [Google Scholar]
- Bertrand N, Wu J, Xu X, Kamaly N, Farokhzad OC. Cancer nanotechnology: the impact of passive and active targeting in the era of modern cancer biology. Adv Drug Deliv Rev. 2014;66:2–25. doi: 10.1016/j.addr.2013.11.009. [DOI] [PMC free article] [PubMed] [Google Scholar]
- Hong S, et al. The binding avidity of a nanoparticle-based multivalent targeted drug delivery platform. Chem Biol. 2007;14:107–115. doi: 10.1016/j.chembiol.2006.11.015. [DOI] [PubMed] [Google Scholar]
- Sykes EA, Chen J, Zheng G, Chan WC. Investigating the impact of nanoparticle size on active and passive tumor targeting efficiency. ACS Nano. 2014;8:5696–5706. doi: 10.1021/nn500299p. [DOI] [PubMed] [Google Scholar]
- Park SM, et al. Selection and elution of aptamers using nanoporous sol-gel arrays with integrated microheaters. Lab Chip. 2009;9:1206–1212. doi: 10.1039/b814993c. [DOI] [PubMed] [Google Scholar]
- Bae YH, Park K. Targeted drug delivery to tumors: myths, reality and possibility. J Controlled Release. 2011;153:198–205. doi: 10.1016/j.jconrel.2011.06.001. [DOI] [PMC free article] [PubMed] [Google Scholar]
- Chouly C, Pouliquen D, Lucet I, Jeune JJ, Jallet P. Development of superparamagnetic nanoparticles for MRI: effect of particle size, charge and surface nature on biodistribution. J Microencapsul. 1996;13:245–255. doi: 10.3109/02652049609026013. [DOI] [PubMed] [Google Scholar]
- Alexis F, Pridgen E, Molnar LK, Farokhzad OC. Factors affecting the clearance and biodistribution of polymeric nanoparticles. Mol Pharm. 2008;5:505–515. doi: 10.1021/mp800051m. [DOI] [PMC free article] [PubMed] [Google Scholar]
- Venturoli D, Rippe B. Ficoll and dextran vs. globular proteins as probes for testing glomerular permselectivity: effects of molecular size, shape, charge, and deformability. Am J Physiol Renal Physiol. 2005;288:F605–613. doi: 10.1152/ajprenal.00171.2004. [DOI] [PubMed] [Google Scholar]
- Vinogradov SV, Bronich TK, Kabanov AV. Nanosized cationic hydrogels for drug delivery: preparation, properties and interactions with cells. Adv Drug Deliv Rev. 2002;54:135–147. doi: 10.1016/s0169-409x(01)00245-9. [DOI] [PubMed] [Google Scholar]
- Moghimi SM, Hunter AC, Murray JC. Long-circulating and target-specific nanoparticles: theory to practice. Pharmacol Rev. 2001;53:283–318. [PubMed] [Google Scholar]
- Chen LT, Weiss L. The role of the sinus wall in the passage of erythrocytes through the spleen. Blood. 1973;41:529–537. [PubMed] [Google Scholar]
- Moghimi SM, Porter CJ, Muir IS, Illum L, Davis SS. Non-phagocytic uptake of intravenously injected microspheres in rat spleen: influence of particle size and hydrophilic coating. Biochem Biophys Res Commun. 1991;177:861–866. doi: 10.1016/0006-291x(91)91869-e. [DOI] [PubMed] [Google Scholar]
- He C, Hu Y, Yin L, Tang C, Yin C. Effects of particle size and surface charge on cellular uptake and biodistribution of polymeric nanoparticles. Biomaterials. 2010;31:3657–3666. doi: 10.1016/j.biomaterials.2010.01.065. [DOI] [PubMed] [Google Scholar]
- Patel HM, Moghimi SM. Serum-mediated recognition of liposomes by phagocytic cells of the reticuloendothelial system — the concept of tissue specificity. Adv Drug Deliv Rev. 1998;32:45–60. doi: 10.1016/s0169-409x(97)00131-2. [DOI] [PubMed] [Google Scholar]
- Moore A, Weissleder R, Bogdanov A., Jr Uptake of dextran-coated monocrystalline iron oxides in tumor cells and macrophages. J Magn Reson Imaging. 1997;7:1140–1145. doi: 10.1002/jmri.1880070629. [DOI] [PubMed] [Google Scholar]
- Bakhtiary Z, et al. Targeted superparamagnetic iron oxide nanoparticles for early detection of cancer: possibilities and challenges. Nanomedicine. 2015;12:287–307. doi: 10.1016/j.nano.2015.10.019. [DOI] [PubMed] [Google Scholar]
- Mirshafiee V, Kim R, Park S, Mahmoudi M, Kraft ML. Impact of protein pre-coating on the protein corona composition and nanoparticle cellular uptake. Biomaterials. 2016;75:295–304. doi: 10.1016/j.biomaterials.2015.10.019. [DOI] [PubMed] [Google Scholar]
- Mahmoudi M, et al. Variation of protein corona composition of gold nanoparticles following plasmonic heating. Nano Lett. 2014;14:6–12. doi: 10.1021/nl403419e. [DOI] [PubMed] [Google Scholar]
- Fang C, et al. In vivo tumor targeting of tumor necrosis factor-a-loaded stealth nanoparticles: effect of MePEG molecular weight and particle size. Eur J Pharm Sci. 2006;27:27–36. doi: 10.1016/j.ejps.2005.08.002. [DOI] [PubMed] [Google Scholar]
- Bergstrom K, et al. Effects of branching and molecular weight of surface-bound poly(ethylene oxide) on protein rejection. J Biomater Sci Polym Ed. 1994;6:123–132. doi: 10.1163/156856294x00257. [DOI] [PubMed] [Google Scholar]
- Perry JL, et al. PEGylated PRINT nanoparticles: the impact of PEG density on protein binding, macrophage association, biodistribution, and pharmacokinetics. Nano Lett. 2012;12:5304–5310. doi: 10.1021/nl302638g. [DOI] [PMC free article] [PubMed] [Google Scholar]
- Larsen EK, et al. Accumulation of magnetic iron oxide nanoparticles coated with variably sized polyethylene glycol in murine tumors. Nanoscale. 2012;4:2352–2361. doi: 10.1039/c2nr11554a. [DOI] [PubMed] [Google Scholar]
- Cole AJ, et al. Polyethylene glycol modified, cross-linked starch-coated iron oxide nanoparticles for enhanced magnetic tumor targeting. Biomaterials. 2011;32:2183–2193. doi: 10.1016/j.biomaterials.2010.11.040. [DOI] [PMC free article] [PubMed] [Google Scholar]
- McDonald DM, Baluk P. Significance of blood vessel leakiness in cancer. Cancer Res. 2002;62:5381–5385. [PubMed] [Google Scholar]
- Yuan F, et al. Vascular permeability in a human tumor xenograft: molecular size dependence and cutoff size. Cancer Res. 1995;55:3752–3756. [PubMed] [Google Scholar]
- Fang J, Nakamura H, Maeda H. The EPR effect: unique features of tumor blood vessels for drug delivery, factors involved, and limitations and augmentation of the effect. Adv Drug Deliv Rev. 2011;63:136–151. doi: 10.1016/j.addr.2010.04.009. [DOI] [PubMed] [Google Scholar]
- Champion JA, Mitragotri S. Role of target geometry in phagocytosis. Proc Natl Acad Sci USA. 2006;103:4930–4934. doi: 10.1073/pnas.0600997103. [DOI] [PMC free article] [PubMed] [Google Scholar]
- Gratton SE, et al. The effect of particle design on cellular internalization pathways. Proc Natl Acad Sci USA. 2008;105:11613–11618. doi: 10.1073/pnas.0801763105. [DOI] [PMC free article] [PubMed] [Google Scholar]
- Bartneck M, et al. Rapid uptake of gold nanorods by primary human blood phagocytes and immunomodulatory effects of surface chemistry. ACS Nano. 2010;4:3073–3086. doi: 10.1021/nn100262h. [DOI] [PubMed] [Google Scholar]
- Arnida, Janát-Amsbury MM, Ray A, Peterson CM, Ghandehari H. Geometry and surface characteristics of gold nanoparticles influence their biodistribution and uptake by macrophages. Eur J Pharm Biopharm. 2011;77:417–423. doi: 10.1016/j.ejpb.2010.11.010. [DOI] [PMC free article] [PubMed] [Google Scholar]
- Geng Y, et al. Shape effects of filaments versus spherical particles in flow and drug delivery. Nat Nanotechnol. 2007;2:249–255. doi: 10.1038/nnano.2007.70. [DOI] [PMC free article] [PubMed] [Google Scholar]
- Cho EC, et al. Measuring the optical absorption cross-sections of Au–Ag nanocages and au nanorods by photoacoustic imaging. J Phys Chem C. 2009;113:9023–9028. doi: 10.1021/jp903343p. [DOI] [PMC free article] [PubMed] [Google Scholar]
- Hu M, et al. Gold nanostructures: engineering their plasmonic properties for biomedical applications. Chem Soc Rev. 2006;35:1084–1094. doi: 10.1039/b517615h. [DOI] [PubMed] [Google Scholar]
- Huang J, Zhong X, Wang L, Yang L, Mao H. Improving the magnetic resonance imaging contrast and detection methods with engineered magnetic nanoparticles. Theranostics. 2012;2:86–102. doi: 10.7150/thno.4006. [DOI] [PMC free article] [PubMed] [Google Scholar]
- Ehlerding EB, Chen F, Cai W. Biodegradable and renal clearable inorganic nanoparticles. Adv Sci. 2016;3:1500223. doi: 10.1002/advs.201500223. [DOI] [PMC free article] [PubMed] [Google Scholar]
- Thakor AS, et al. The fate and toxicity of Raman-active silica-gold nanoparticles in mice. Sci Transl Med. 2011;3:79ra33. doi: 10.1126/scitranslmed.3001963. [DOI] [PMC free article] [PubMed] [Google Scholar]
- Hauck TS, Anderson RE, Fischer HC, Newbigging S, Chan WC. In vivo quantum-dot toxicity assessment. Small. 2010;6:138–144. doi: 10.1002/smll.200900626. [DOI] [PubMed] [Google Scholar]
- Sosnovik DE, Nahrendorf M, Weissleder R. Magnetic nanoparticles for MR imaging: agents, techniques and cardiovascular applications. Basic Res Cardiol. 2008;103:122–130. doi: 10.1007/s00395-008-0710-7. [DOI] [PMC free article] [PubMed] [Google Scholar]
- Ballou B, et al. Sentinel lymph node imaging using quantum dots in mouse tumor models. Bioconjug Chem. 2007;18:389–396. doi: 10.1021/bc060261j. [DOI] [PubMed] [Google Scholar]
- Weissleder R, et al. Superparamagnetic iron oxide: pharmacokinetics and toxicity. AJR Am J Roentgenol. 1989;152:167–173. doi: 10.2214/ajr.152.1.167. [DOI] [PubMed] [Google Scholar]
- Ferrucci J, Stark D. Iron oxide-enhanced MR imaging of the liver and spleen: review of the first 5 years. AJR Am J Roentgenol. 1990;155:943–950. doi: 10.2214/ajr.155.5.2120963. [DOI] [PubMed] [Google Scholar]
- Alkilany AM, Murphy CJ. Toxicity and cellular uptake of gold nanoparticles: what we have learned so far? J Nanopart Res. 2010;12:2313–2333. doi: 10.1007/s11051-010-9911-8. [DOI] [PMC free article] [PubMed] [Google Scholar]
- Brown CL, Whitehouse MW, Tiekink ER, Bushell GR. Colloidal metallic gold is not bio-inert. Inflammopharmacology. 2008;16:133–137. doi: 10.1007/s10787-007-0017-6. [DOI] [PubMed] [Google Scholar]
- Chen YS, Hung YC, Liau I, Huang GS. Assessment of the in vivo toxicity of gold nanoparticles. Nanoscale Res Lett. 2009;4:858–864. doi: 10.1007/s11671-009-9334-6. [DOI] [PMC free article] [PubMed] [Google Scholar]
- Alkilany AM, et al. Cellular uptake and cytotoxicity of gold nanorods: molecular origin of cytotoxicity and surface effects. Small. 2009;5:701–708. doi: 10.1002/smll.200801546. [DOI] [PubMed] [Google Scholar]
- Walling MA, Novak JA, Shepard JR. Quantum dots for live cell and in vivo imaging. Int J Mol Sci. 2009;10:441–491. doi: 10.3390/ijms10020441. [DOI] [PMC free article] [PubMed] [Google Scholar]
- Hardman R. A toxicologic review of quantum dots: toxicity depends on physicochemical and environmental factors. Environ Health Perspect. 2006;114:165–172. doi: 10.1289/ehp.8284. [DOI] [PMC free article] [PubMed] [Google Scholar]
- Choi HS, Frangioni JV. Nanoparticles for biomedical imaging: fundamentals of clinical translation. Mol Imag. 2010;9:291–310. [PMC free article] [PubMed] [Google Scholar]
- Choi HS, et al. Renal clearance of quantum dots. Nat Biotechnol. 2007;25:1165–1170. doi: 10.1038/nbt1340. [DOI] [PMC free article] [PubMed] [Google Scholar]
- Jokerst JV, Lobovkina T, Zare RN, Gambhir SS. Nanoparticle PEGylation for imaging and therapy. Nanomedicine (Lond) 2011;6:715–728. doi: 10.2217/nnm.11.19. [DOI] [PMC free article] [PubMed] [Google Scholar]
- Pelaz B, et al. Surface functionalization of nanoparticles with polyethylene glycol: effects on protein adsorption and cellular uptake. ACS Nano. 2015;9:6996–7008. doi: 10.1021/acsnano.5b01326. [DOI] [PubMed] [Google Scholar]
- Hamad I, et al. Distinct polymer architecture mediates switching of complement activation pathways at the nanosphere–serum interface: implications for stealth nanoparticle engineering. ACS Nano. 2010;4:6629–6638. doi: 10.1021/nn101990a. [DOI] [PubMed] [Google Scholar]
- Moyano DF, et al. Fabrication of corona-free nanoparticles with tunable hydrophobicity. ACS Nano. 2014;8:6748–6755. doi: 10.1021/nn5006478. [DOI] [PMC free article] [PubMed] [Google Scholar]
- Safavi-Sohi R, et al. Bypassing protein corona issue on active targeting: zwitterionic coatings dictate specific interactions of targeting moieties and cell receptors. ACS Appl Mater Interfaces. 2016;8:22808–22818. doi: 10.1021/acsami.6b05099. [DOI] [PubMed] [Google Scholar]
- Hajipour MJ, Laurent S, Aghaie A, Rezaee F, Mahmoudi M. Personalized protein coronas: a ‘key’ factor at the nanobiointerface. Biomater Sci. 2014;2:1210–1221. doi: 10.1039/c4bm00131a. [DOI] [PubMed] [Google Scholar]
- Hajipour MJ, et al. Personalized disease-specific protein corona influences the therapeutic impact of graphene oxide. Nanoscale. 2015;7:8978–8994. doi: 10.1039/c5nr00520e. [DOI] [PubMed] [Google Scholar]
- Ren H, et al. A biocompatible condensation reaction for the labeling of terminal cysteine residues on proteins. Angew Chem Int Ed. 2009;48:9658–9662. doi: 10.1002/anie.200903627. [DOI] [PMC free article] [PubMed] [Google Scholar]
- Liang G, Ren H, Rao J. A biocompatible condensation reaction for controlled assembly of nanostructures in living cells. Nat Chem. 2010;2:54–60. doi: 10.1038/nchem.480. [DOI] [PMC free article] [PubMed] [Google Scholar]
- Dragulescu-Andrasi A, Kothapalli SR, Tikhomirov GA, Rao J, Gambhir SS. Activatable oligomerizable imaging agents for photoacoustic imaging of furin-like activity in living subjects. J Am Chem Soc. 2013;135:11015–11022. doi: 10.1021/ja4010078. [DOI] [PMC free article] [PubMed] [Google Scholar]
- Shen B, et al. Positron emission tomography imaging of drug-induced tumor apoptosis with a caspase-triggered nanoaggregation probe. Angew Chem Int Ed. 2013;52:10511–10514. doi: 10.1002/anie.201303422. [DOI] [PMC free article] [PubMed] [Google Scholar]
- Ye D, et al. Bioorthogonal cyclization-mediated in situ self-assembly of small-molecule probes for imaging caspase activity in vivo. Nat Chem. 2014;6:519–526. doi: 10.1038/nchem.1920. [DOI] [PMC free article] [PubMed] [Google Scholar]
- Ye D, et al. Caspase-responsive smart gadolinium-based contrast agent for magnetic resonance imaging of drug-induced apoptosis. Chem Sci. 2014;4:3845–3852. doi: 10.1039/C4SC01392A. [DOI] [PMC free article] [PubMed] [Google Scholar]
- Soppimath KS, Aminabhavi TM, Kulkarni AR, Rudzinski WE. Biodegradable polymeric nanoparticles as drug delivery devices. J Controlled Release. 2001;70:1–20. doi: 10.1016/s0168-3659(00)00339-4. [DOI] [PubMed] [Google Scholar]
- Foroutan F, et al. Sol–gel synthesis and electrospraying of biodegradable (P2O5)55–(CaO)30– (Na2O)15 glass nanospheres as a transient contrast agent for ultrasound stem cell imaging. ACS Nano. 2015;9:1868–1877. doi: 10.1021/nn506789y. [DOI] [PMC free article] [PubMed] [Google Scholar]
- Kempen PJ, et al. Theranostic mesoporous silica nanoparticles biodegrade after pro-survival drug delivery and ultrasound/magnetic resonance imaging of stem cells. Theranostics. 2015;5:631–642. doi: 10.7150/thno.11389. [DOI] [PMC free article] [PubMed] [Google Scholar]
- Nune SK, et al. Nanoparticles for biomedical imaging. Expert Opin Drug Deliv. 2009;6:1175–1194. doi: 10.1517/17425240903229031. [DOI] [PMC free article] [PubMed] [Google Scholar]
- Bashir MR, Bhatti L, Marin D, Nelson RC. Emerging applications for ferumoxytol as a contrast agent in MRI. J Magn Reson Imaging. 2015;41:884–898. doi: 10.1002/jmri.24691. [DOI] [PubMed] [Google Scholar]
- Bellin MF, et al. Liver metastases: safety and efficacy of detection with superparamagnetic iron oxide in MR imaging. Radiology. 1994;193:657–663. doi: 10.1148/radiology.193.3.7972804. [DOI] [PubMed] [Google Scholar]
- Denys A, et al. Hepatic tumors: detection and characterization at 1-T MR imaging enhanced with AMI-25. Radiology. 1994;193:665–669. doi: 10.1148/radiology.193.3.7972805. [DOI] [PubMed] [Google Scholar]
- Reimer P, Tombach B. Hepatic MRI with SPIO: detection and characterization of focal liver lesions. Eur Radiol. 1998;8:1198–1204. doi: 10.1007/s003300050535. [DOI] [PubMed] [Google Scholar]
- Semelka RC, Helmberger TK. Contrast agents for MR imaging of the liver. Radiology. 2001;218:27–38. doi: 10.1148/radiology.218.1.r01ja2427. [DOI] [PubMed] [Google Scholar]
- Ross RW, et al. Lymphotropic nanoparticle-enhanced magnetic resonance imaging (LNMRI) identifies occult lymph node metastases in prostate cancer patients prior to salvage radiation therapy. Clin Imaging. 2009;33:301–305. doi: 10.1016/j.clinimag.2009.01.013. [DOI] [PubMed] [Google Scholar]
- Kim YK, et al. Hepatocellular carcinoma in patients with chronic liver disease: comparison of SPIO-enhanced MR imaging and 16-detector row CT. Radiology. 2006;238:531–541. doi: 10.1148/radiol.2381042193. [DOI] [PubMed] [Google Scholar]
- Harisinghani MG, et al. Noninvasive detection of clinically occult lymph-node metastases in prostate cancer. N Engl J Med. 2003;348:2491–2499. doi: 10.1056/NEJMoa022749. [DOI] [PubMed] [Google Scholar]
- Mack MG, Balzer JO, Straub R, Eichler K, Vogl TJ. Superparamagnetic iron oxide-enhanced MR imaging of head and neck lymph nodes. Radiology. 2002;222:239–244. doi: 10.1148/radiol.2221010225. [DOI] [PubMed] [Google Scholar]
- Guimaraes AR, et al. Pilot study evaluating use of lymphotrophic nanoparticle-enhanced magnetic resonance imaging for assessing lymph nodes in renal cell cancer. Urology. 2008;71:708–712. doi: 10.1016/j.urology.2007.11.096. [DOI] [PubMed] [Google Scholar]
- Harisinghani MG, Weissleder R. Sensitive, noninvasive detection of lymph node metastases. PLoS Med. 2004;1:e66. doi: 10.1371/journal.pmed.0010066. [DOI] [PMC free article] [PubMed] [Google Scholar]
- Klerkx WM, et al. Detection of lymph node metastases by gadolinium-enhanced magnetic resonance imaging: systematic review and meta-analysis. J Natl Cancer Inst. 2010;102:244–253. doi: 10.1093/jnci/djp514. [DOI] [PubMed] [Google Scholar]
- Wunderbaldinger P, Josephson L, Bremer C, Moore A, Weissleder R. Detection of lymph node metastases by contrast-enhanced MRI in an experimental model. Magn Reson Med. 2002;47:292–297. doi: 10.1002/mrm.10068. [DOI] [PubMed] [Google Scholar]
- Mouli SK, Zhao LC, Omary RA, Thaxton CS. Lymphotropic nanoparticle enhanced MRI for the staging of genitourinary tumors. Nat Rev Urol. 2010;7:84–93. doi: 10.1038/nrurol.2009.254. [DOI] [PubMed] [Google Scholar]
- Benezra M, et al. Multimodal silica nanoparticles are effective cancer-targeted probes in a model of human melanoma. J Clin Invest. 2011;121:2768–2780. doi: 10.1172/JCI45600. [DOI] [PMC free article] [PubMed] [Google Scholar]
- Bradbury MS, et al. Clinically-translated silica nanoparticles as dual-modality cancer-targeted probes for image-guided surgery and interventions. Integr Biol. 2013;5:74–86. doi: 10.1039/c2ib20174g. [DOI] [PMC free article] [PubMed] [Google Scholar]
- Phillips E, et al. Clinical translation of an ultrasmall inorganic optical-PET imaging nanoparticle probe. Sci Transl Med. 2014;6:260ra149. doi: 10.1126/scitranslmed.3009524. [DOI] [PMC free article] [PubMed] [Google Scholar]
- Schulz C, Massberg S. Atherosclerosis — multiple pathways to lesional macrophages. Sci Transl Med. 2014;6:239ps2. doi: 10.1126/scitranslmed.3008922. [DOI] [PubMed] [Google Scholar]
- Mulder WJ, Jaffer FA, Fayad ZA, Nahrendorf M. Imaging and nanomedicine in inflammatory atherosclerosis. Sci Transl Med. 2014;6:239sr1. doi: 10.1126/scitranslmed.3005101. [DOI] [PMC free article] [PubMed] [Google Scholar]
- Sanz J, Fayad ZA. Imaging of atherosclerotic cardiovascular disease. Nature. 2008;451:953–957. doi: 10.1038/nature06803. [DOI] [PubMed] [Google Scholar]
- Kratz JD, Chaddha A, Bhattacharjee S, Goonewardena SN. Atherosclerosis and nanotechnology: diagnostic and therapeutic applications. Cardiovasc Drugs Ther. 2016;30:33–39. doi: 10.1007/s10557-016-6649-2. [DOI] [PMC free article] [PubMed] [Google Scholar]
- Nahrendorf M, et al. Nanoparticle PET-CT imaging of macrophages in inflammatory atherosclerosis. Circulation. 2008;117:379–387. doi: 10.1161/CIRCULATIONAHA.107.741181. [DOI] [PMC free article] [PubMed] [Google Scholar]
- Danad I, Fayad ZA, Willemink MJ, Min JK. New applications of cardiac computed tomography: dual-energy, spectral, and molecular CT imaging. JACC Cardiovasc Imaging. 2015;8:710–723. doi: 10.1016/j.jcmg.2015.03.005. [DOI] [PMC free article] [PubMed] [Google Scholar]
- Toussaint JF, LaMuraglia GM, Southern JF, Fuster V, Kantor HL. Magnetic resonance images lipid, fibrous, calcified, hemorrhagic, and thrombotic components of human atherosclerosis in vivo. Circulation. 1996;94:932–938. doi: 10.1161/01.cir.94.5.932. [DOI] [PubMed] [Google Scholar]
- Kooi ME, et al. Accumulation of ultrasmall superparamagnetic particles of iron oxide in human atherosclerotic plaques can be detected by in vivo magnetic resonance imaging. Circulation. 2003;107:2453–2458. doi: 10.1161/01.CIR.0000068315.98705.CC. [DOI] [PubMed] [Google Scholar]
- Tang TY, et al. The ATHEROMA (Atorvastatin Therapy: Effects on Reduction of Macrophage Activity) study: evaluation using ultrasmall superparamagnetic iron oxide-enhanced magnetic resonance imaging in carotid disease. J Am Coll Cardiol. 2009;53:2039–2050. doi: 10.1016/j.jacc.2009.03.018. [DOI] [PubMed] [Google Scholar]
- Weissleder R, Nahrendorf M, Pittet MJ. Imaging macrophages with nanoparticles. Nat Mater. 2014;13:125–138. doi: 10.1038/nmat3780. [DOI] [PubMed] [Google Scholar]
- Nahrendorf M, Pittet MJ, Swirski FK. Monocytes: protagonists of infarct inflammation and repair after myocardial infarction. Circulation. 2010;121:2437–2445. doi: 10.1161/CIRCULATIONAHA.109.916346. [DOI] [PMC free article] [PubMed] [Google Scholar]
- Alam SR, et al. Ultrasmall superparamagnetic particles of iron oxide in patients with acute myocardial infarction: early clinical experience. Circ Cardiovasc Imaging. 2012;5:559–565. doi: 10.1161/CIRCIMAGING.112.974907. [DOI] [PubMed] [Google Scholar]
- Naresh NK, et al. Monocyte and/or macrophage infiltration of heart after myocardial infarction: MR imaging by using T1-shortening liposomes. Radiology. 2012;264:428–435. doi: 10.1148/radiol.12111863. [DOI] [PMC free article] [PubMed] [Google Scholar]
- Yilmaz A, et al. Imaging of myocardial infarction using ultrasmall superparamagnetic iron oxide nanoparticles: a human study using a multi-parametric cardiovascular magnetic resonance imaging approach. Eur Heart J. 2013;34:462–475. doi: 10.1093/eurheartj/ehs366. [DOI] [PubMed] [Google Scholar]
- Yilmaz A, et al. Magnetic resonance imaging (MRI) of inflamed myocardium using iron oxide nanoparticles in patients with acute myocardial infarction — preliminary results. Int J Cardiol. 2013;163:175–182. doi: 10.1016/j.ijcard.2011.06.004. [DOI] [PubMed] [Google Scholar]
- Moon H, et al. Noninvasive assessment of myocardial inflammation by cardiovascular magnetic resonance in a rat model of experimental autoimmune myocarditis. Circulation. 2012;125:2603–2612. doi: 10.1161/CIRCULATIONAHA.111.075283. [DOI] [PubMed] [Google Scholar]
- Wu YL, et al. Noninvasive evaluation of cardiac allograft rejection by cellular and functional cardiac magnetic resonance. JACC Cardiovasc Imaging. 2009;2:731–741. doi: 10.1016/j.jcmg.2009.01.013. [DOI] [PMC free article] [PubMed] [Google Scholar]
- Christen T, et al. Molecular imaging of innate immune cell function in transplant rejection. Circulation. 2009;119:1925–1932. doi: 10.1161/CIRCULATIONAHA.108.796888. [DOI] [PMC free article] [PubMed] [Google Scholar]
- Gaglia JL, et al. Noninvasive imaging of pancreatic islet inflammation in type 1A diabetes patients. J Clin Invest. 2011;121:442–445. doi: 10.1172/JCI44339. [DOI] [PMC free article] [PubMed] [Google Scholar]
- Turvey SE, et al. Noninvasive imaging of pancreatic inflammation and its reversal in type 1 diabetes. J Clin Invest. 2005;115:2454–2461. doi: 10.1172/JCI25048. [DOI] [PMC free article] [PubMed] [Google Scholar]
- Denis MC, Mahmood U, Benoist C, Mathis D, Weissleder R. Imaging inflammation of the pancreatic islets in type 1 diabetes. Proc Natl Acad Sci USA. 2004;101:12634–12639. doi: 10.1073/pnas.0404307101. [DOI] [PMC free article] [PubMed] [Google Scholar]
- Gaglia JL, et al. Noninvasive mapping of pancreatic inflammation in recent-onset type-1 diabetes patients. Proc Natl Acad Sci USA. 2015;112:2139–2144. doi: 10.1073/pnas.1424993112. [DOI] [PMC free article] [PubMed] [Google Scholar]
- Johnson KA, Fox NC, Sperling RA, Klunk WE. Brain imaging in Alzheimer disease. Cold Spring Harb Perspect Med. 2012;2:a006213. doi: 10.1101/cshperspect.a006213. [DOI] [PMC free article] [PubMed] [Google Scholar]
- Cheng KK, et al. Curcumin-conjugated magnetic nanoparticles for detecting amyloid plaques in Alzheimer’s disease mice using magnetic resonance imaging (MRI) Biomaterials. 2015;44:155–172. doi: 10.1016/j.biomaterials.2014.12.005. [DOI] [PubMed] [Google Scholar]
- Viola KL, et al. Towards non-invasive diagnostic imaging of early-stage Alzheimer’s disease. Nat Nanotechnol. 2015;10:91–98. doi: 10.1038/nnano.2014.254. [DOI] [PMC free article] [PubMed] [Google Scholar]
- Jensen SA, et al. Spherical nucleic acid nanoparticle conjugates as an RNAi-based therapy for glioblastoma. Sci Transl Med. 2013;5:209ra152. doi: 10.1126/scitranslmed.3006839. [DOI] [PMC free article] [PubMed] [Google Scholar]
- Seferos DS, Giljohann DA, Hill HD, Prigodich AE, Mirkin CA. Nanoflares: probes for transfection and mRNA detection in living cells. J Am Chem Soc. 2007;129:15477–15479. doi: 10.1021/ja0776529. [DOI] [PMC free article] [PubMed] [Google Scholar]
- Kwong GA, et al. Mass-encoded synthetic biomarkers for multiplexed urinary monitoring of disease. Nat Biotechnol. 2013;31:63–70. doi: 10.1038/nbt.2464. [DOI] [PMC free article] [PubMed] [Google Scholar]
- Warren AD, Kwong GA, Wood DK, Lin KY, Bhatia SN. Point-of-care diagnostics for noncommunicable diseases using synthetic urinary biomarkers and paper microfluidics. Proc Natl Acad Sci USA. 2014;111:3671–3676. doi: 10.1073/pnas.1314651111. [DOI] [PMC free article] [PubMed] [Google Scholar]
- Ronald JA, et al. Development and validation of non-integrative, self-limited, and replicating minicircles for safe reporter gene imaging of cell-based therapies. PLoS ONE. 2013;8:e73138. doi: 10.1371/journal.pone.0073138. [DOI] [PMC free article] [PubMed] [Google Scholar]
- Ronald JA, Chuang HY, Dragulescu-Andrasi A, Hori SS, Gambhir SS. Detecting cancers through tumor-activatable minicircles that lead to a detectable blood biomarker. Proc Natl Acad Sci USA. 2015;112:3068–3073. doi: 10.1073/pnas.1414156112. [DOI] [PMC free article] [PubMed] [Google Scholar]
- Lane LA, Qian X, Smith AM, Nie S. Physical chemistry of nanomedicine: understanding the complex behaviors of nanoparticles in vivo. Annu Rev Phys Chem. 2015;66:521–547. doi: 10.1146/annurev-physchem-040513-103718. [DOI] [PMC free article] [PubMed] [Google Scholar]
- Ferguson RM, Khandhar AP, Krishnan KM. Tracer design for magnetic particle imaging. J Appl Phys. 2012;111:07318B. doi: 10.1063/1.3676053. [DOI] [PMC free article] [PubMed] [Google Scholar]
- Huang J, et al. Effects of nanoparticle size on cellular uptake and liver MRI with polyvinylpyrrolidone-coated iron oxide nanoparticles. ACS Nano. 2010;4:7151–7160. doi: 10.1021/nn101643u. [DOI] [PMC free article] [PubMed] [Google Scholar]
- Lee N, et al. Magnetosome-like ferrimagnetic iron oxide nanocubes for highly sensitive MRI of single cells and transplanted pancreatic islets. Proc Natl Acad Sci USA. 2011;108:2662–2667. doi: 10.1073/pnas.1016409108. [DOI] [PMC free article] [PubMed] [Google Scholar]
- Tsuji M, Hashimoto M, Nishizawa Y, Kubokawa M, Tsuji T. Microwave-assisted synthesis of metallic nanostructures in solution. Chem Eur J. 2005;11:440–452. doi: 10.1002/chem.200400417. [DOI] [PubMed] [Google Scholar]
- Chen L, et al. High-yield seedless synthesis of triangular gold nanoplates through oxidative etching. Nano Lett. 2014;14:7201–7206. doi: 10.1021/nl504126u. [DOI] [PubMed] [Google Scholar]
- Zheng Y, Zhong X, Li Z, Xia Y. Successive, seed-mediated growth for the synthesis of single-crystal gold nanospheres with uniform diameters controlled in the range of 5–150 nm. Part Part Syst Charact. 2014;31:266–273. [Google Scholar]
- Ye X, et al. Improved size-tunable synthesis of monodisperse gold nanorods through the use of aromatic additives. ACS Nano. 2012;6:2804–2817. doi: 10.1021/nn300315j. [DOI] [PubMed] [Google Scholar]
- Manohar N, Reynoso FJ, Diagaradjane P, Krishnan S, Cho SH. Quantitative imaging of gold nanoparticle distribution in a tumor-bearing mouse using benchtop X-ray fluorescence computed tomography. Sci Rep. 2016;6:22079. doi: 10.1038/srep22079. [DOI] [PMC free article] [PubMed] [Google Scholar]
- Warner JH, Young NP, Kirkland AI, Briggs GAD. Resolving strain in carbon nanotubes at the atomic level. Nat Mater. 2011;10:958–962. doi: 10.1038/nmat3125. [DOI] [PubMed] [Google Scholar]
- Wilhelm S, et al. Analysis of nanoparticle delivery to tumours. Nat Rev Mater. 2016;1:16014. [Google Scholar]
- Rice WL, et al. High resolution helium ion scanning microscopy of the rat kidney. PLoS ONE. 2013;8:e57051. doi: 10.1371/journal.pone.0057051. [DOI] [PMC free article] [PubMed] [Google Scholar]
- Young B, O’Dowd G, Woodford P. Wheater’s Functional Histology. 6th. Churchill Livingstone; 2014. Ch.16. [Google Scholar]
- Sadauskas E, et al. Kupffer cells are central in the removal of nanoparticles from the organism. Part Fibre Toxicol. 2007;4:10. doi: 10.1186/1743-8977-4-10. [DOI] [PMC free article] [PubMed] [Google Scholar]
- Wisse E, De Zanger RB, Charels K, Van Der Smissen P, McCuskey RS. The liver sieve: considerations concerning the structure and function of endothelial fenestrae, the sinusoidal wall and the space of Disse. Hepatology. 1985;5:683–692. doi: 10.1002/hep.1840050427. [DOI] [PubMed] [Google Scholar]
- Seki T, Fang J, Maeda H. In: Pharmaceutical Perspectives of Cancer Therapeutics. Lu Y, Mahato RL, editors. Springer. 2009. p. 98. [Google Scholar]