Abstract
Despite significant advances in understanding of the causes of and treatment of myocardial infarction (MI) in recent years, morbidity and mortality is still high. The aim of this study was to identify miRNA and genes potentially associated with MI. mRNA and miRNA expression datasets were downloaded from the Gene Expression Omnibus database (http://www.ncbi.nlm.nih.gov/geo/). Interactions between miRNA and the expression and function of target genes were analyzed, and a protein–protein interaction network was constructed. The diagnostic value of identified miRNA and genes was assessed. Quantitative RT‐PCR was applied to validate the results of the bioinformatics analysis. MiR‐27a, miR‐31*, miR‐1291, miR‐139‐5p, miR‐204, miR‐375, and target genes including CX3CR1,HSPA6, and TPM3 had potential diagnostic value. The genes TFEB,IRS2,GRB2,FASLG,LIMS1,CX3CR1,HSPA6,TPM3,LAT2,CEBPD,AQP9, and MAPKAPK2 were associated with recovery from MI. In conclusion, the identified miRNA and genes might be associated with the pathology of MI.
Keywords: diagnostic biomarkers, miRNA‐target network, myocardial infarction, protein–protein interaction network
Abbreviations
- AQP9
aquaporin 9
- AUC
area under the curve
- CEBPD
CCAAT/enhancer binding protein delta
- CX3CR1
C‐X3‐C motif chemokine receptor 1
- DEGs
differentially expressed genes
- FASLG
fas ligand
- FDR
false discovery rate
- GEO
gene expression omnibus
- GO
gene ontology
- GRB2
growth factor receptor bound protein 2
- HCM
hypertrophic cardiomyopathy
- HSPA6
heat shock protein family A (Hsp70) member 6
- IRS2
insulin receptor substrate 2
- KEGG
kyoto encyclopedia of genes genomes
- LAT2
linker for activation of T cells family member 2
- LIMS1
LIM zinc finger domain containing 1
- MAPKAPK2
mitogen‐activated protein kinase‐activated protein kinase 2
- MI
myocardial infarction
- PPI
protein–protein interaction
- qRT‐PCR
quantitative RT‐PCR
- ROC
receiver operating characteristic
- TFEB
transcription factor EB
- TPM3
tropomyosin 3
Myocardial infarction (MI) is the multifactorial injurious event, which involves all the components of the cardiac myocyte 1. The partial or complete occlusion of a coronary artery is the cause of MI, which leads to apoptosis and necrosis in the myocardium. It is reported that smoking, hypertension, diabetes mellitus, hypercholesterolemia, or dyslipidemia are the main causal factors of MI 2. Atherosclerosis also leads to MI 3. Even though survival rates after MI have been remarkably improved by early revascularization therapy and drug treatment, a significant number of patients develop heart failure 4. Despite significant advances in understanding of the causes of and treatment of MI in recent years, morbidity and mortality is still high 5.
miRNA are small, noncoding RNA that regulate the expression of target genes at the post‐transcription level. miRNA can modulate important complex gene regulatory pathways involved in cardiovascular development 6, 7, 8. More and more evidence reveals that signature expression pattern of miRNA plays a vital role in MI, cardiac arrhythmia, and pathological cardiac hypertrophy 9. It is noted that some miRNA expressed in heart are remarkably deregulated in patients with acute MI compared with healthy controls 10, 11. It is found that several miRNA including miR‐1, miR‐21, miR‐206, and miR‐499‐5p are deregulated in MI 12, 13, 14. Clinically, myoglobin, cardiac troponins, N‐terminal probrain natriuretic peptide, creatine kinases, and lactate dehydrogenase have been considered as diagnosis biomarkers of patients with acute MI 15, 16, 17, 18. It is worth mentioning that several miRNA including miR‐1, miR‐208α, miR‐126, miR‐122‐5p, and miR‐19a have been recognized as novel biomarkers for early diagnosis of acute MI 19, 20, 21, 22. Therefore, improving knowledge about the interaction between miRNA and target genes may be helpful in finding new pathological mechanism and markers for MI.
In this study, we aimed to find differentially expressed miRNA and genes in MI by integrated analysis. The miRNA‐gene target analysis was subsequently performed. Then, functional enrichment analysis including Gene Ontology (GO) and Kyoto Encyclopedia of Genes Genomes (KEGG) was used to investigate the biological function of genes followed by construction of a protein–protein interaction (PPI) network of top 100 differentially expressed genes (DEGs; 50 up‐regulated and 50 down‐regulated). Receiver operating characteristic (ROC) analysis was applied to analyze the diagnostic usefulness of identified differentially expressed miRNA and genes. Quantitative RT‐PCR (qRT‐PCR) was used to validate the result of the bioinformatics analysis. http://www.ncbi.nlm.nih.gov/geo/query/acc.cgi?acc=GSE29532 and http://www.ncbi.nlm.nih.gov/geo/query/acc.cgi?acc=GSE48060 datasets were used for expression and recovery analysis of DEGs. Our study may be helpful in understanding the pathogenic mechanism and finding valuable diagnosis biomarkers for MI.
Materials and methods
Datasets
In this study, we searched datasets from the Gene Expression Omnibus (GEO) database (http://www.ncbi.nlm.nih.gov/geo/). The study type was characterized as ‘expression profiling by array’. All selected datasets were genome‐wide expression data of mRNA/miRNA from MI group and normal group blood samples. And those standardized or primary datasets were included in this study. Finally, a total of three mRNA datasets (http://www.ncbi.nlm.nih.gov/geo/query/acc.cgi?acc=GSE34198, http://www.ncbi.nlm.nih.gov/geo/query/acc.cgi?acc=GSE48060, and http://www.ncbi.nlm.nih.gov/geo/query/acc.cgi?acc=GSE61145) and two miRNA datasets (http://www.ncbi.nlm.nih.gov/geo/query/acc.cgi?acc=GSE31568 and http://www.ncbi.nlm.nih.gov/geo/query/acc.cgi?acc=GSE61741) were screened, which was shown in Table 1.
Table 1.
The mRNA and miRNA datasets
| GEO accession | Platform | Samples (N : P) | Country | |
|---|---|---|---|---|
| http://www.ncbi.nlm.nih.gov/geo/query/acc.cgi?acc=GSE34198 | mRNA‐array | GPL6102 Illumina human‐6 v2.0 expression beadchip | 48 : 45 | Czech Republic |
| http://www.ncbi.nlm.nih.gov/geo/query/acc.cgi?acc=GSE48060 | mRNA‐array | GPL570 [HG‐U133_Plus_2] Affymetrix Human Genome U133 Plus 2.0 Array | 21 : 31 | USA |
| http://www.ncbi.nlm.nih.gov/geo/query/acc.cgi?acc=GSE61145 | mRNA‐array | GPL6106 Sentrix Human‐6 v2 Expression BeadChip | 10 : 7 | South Korea |
| http://www.ncbi.nlm.nih.gov/geo/query/acc.cgi?acc=GSE31568 | miRNA‐array | GPL9040 febit Homo Sapiens miRBase 13.0 | 70 : 20 | Germany |
| http://www.ncbi.nlm.nih.gov/geo/query/acc.cgi?acc=GSE61741 | miRNA‐array | GPL9040 febit Homo Sapiens miRBase 13.0 | 94 : 62 | Germany |
N, normal; P, patients.
Identification of differentially expressed genes and differentially expressed miRNA
With numbers of publicly available microarray databases, there will be an interest in combining data from different platforms. It is noted that metaMA package allows this integration of different platforms as it can handle missing data and eliminate the batch effects 23. In this study, Limma and metaMA packages were used to identify the DEGs. The normal inverse method was used to combine the P value in metaMA. The false discovery rate (FDR) was performed for multiple testing corrections of raw P value through the Benjamin and Hochberg method 24, 25. The threshold of DEGs was set as FDR < 0.05. FDR < 0.05 & |Combined.ES|> 0.8 was the threshold of identifying differentially expressed miRNA.
miRNA‐gene target analyses
Identifying the target genes of miRNA is a crucial step in exploring the function of miRNA in specific tissues and cells. Herein, six miRNA‐target prediction tools (RNA22, miRanda, miRDB, miRWalk, PICTAR2, and Targetscan) were applied to predict the target DEGs of differentially expressed miRNA. The miRNA‐targets that were predicted by more than four algorithms or verified by experiment in miRWalk database were screened out. Then, the miRNA‐target regulatory network was constructed, which was visualized using Cytoscape Software 26.
Functional annotation analyses of miRNA‐target differentially expressed genes
To obtain the biological function and signaling pathways of miRNA‐target DEGs, the GeneCoDis3 (http://genecodis.cnb.csic.es/analysis) software was used for GO (http://www.geneontology.org/) annotation and KEGG (http://www.genome. jp/kegg/pathway.html) pathway enrichment analysis. The threshold of GO function and KEGG pathway of DEGs was all set as FDR < 0.05.
Protein–protein interaction network construction
It is useful for understanding the molecule mechanism of MI by studying the interactions between proteins. To gain insights into the interaction between proteins encoded by DEGs and other proteins, the database of BioGRID (http://thebiogrid.org) was used to retrieve the predicted interactions between top 100 proteins encoded by DEGs (50 up‐regulated and 50 down‐regulated) and other proteins. Then, PPI network was visualized by the Cytoscape Software (http://cytoscape.org/). A node in the PPI network denotes protein, and the edge denotes the interactions.
Receiver operating characteristic analyses
Using pROC package in R language, we performed the receiver operating characteristic analyses to assess the diagnostic value of DEGs. The area under the curve (AUC) under binomial exact confidence interval was calculated, and the receiver operating characteristic curve was generated.
Validation of quantitative RT‐PCR
In this study, five patients diagnosed as MI and five normal individuals were enrolled in this study. Both MI and corresponding normal blood samples were obtained and immediately frozen in liquid nitrogen. All participating individuals provided informed consent with the approval of the ethics committee of our hospital.
Total RNA of fresh blood samples from MI patients and normal individuals was extracted using TRizol reagent (Invitrogen, Foster City, CA, USA) according to the manual instructions. SuperScript III Reverse Transcription Kit (Invitrogen) was used to synthesize the cDNA. qRT‐PCR was performed using SYBR Green PCR Master Mix (Applied Biosystems, Foster City, CA, USA) on Applied Biosystems 7500 (Applied Biosystems). GAPDH served as internal control for gene detection, and the relative expression of genes was calculated using the fold change equation.
Expression analyses in the early stage of myocardial infarction and recovery‐related analysis of differentially expressed genes
To analyze the expression of DEGs in the early stage (different blood collection time points, time 1, time 2, time 3, time 4, time 5, and time 6) of MI in the dataset of http://www.ncbi.nlm.nih.gov/geo/query/acc.cgi?acc=GSE29532 and further investigate the association between DEGs and MI recovery in the dataset of http://www.ncbi.nlm.nih.gov/geo/query/acc.cgi?acc=GSE48060, 12 DEGs including transcription factor EB (TFEB), insulin receptor substrate 2 (IRS2), growth factor receptor bound protein 2 (GRB2), fas ligand (FASLG), LIM zinc finger domain containing 1 (LIMS1), C‐X3‐C motif chemokine receptor 1 (CX3CR1), heat shock protein family A (Hsp70) member 6 (HSPA6), tropomyosin 3 (TPM3), linker for activation of T cells family member 2 (LAT2), CCAAT/enhancer binding protein delta (CEBPD), aquaporin 9 (AQP9), and mitogen‐activated protein kinase‐activated protein kinase 2 (MAPKAPK2) were selected for analysis.
Results
Differentially expressed genes and differentially expressed miRNA analysis
A total of 1007 DEGs were identified as the threshold of FDR < 0.05, consisting of 564 up‐regulated and 443 down‐regulated genes. Top 10 up‐ and down‐regulated DEGs were presented in Table 2. The heat map of top 100 DEGs was shown in Fig. 1. All DEGs were listed in the Table S1. In addition, a total of 38 differentially expressed miRNA including 14 up‐regulated and 24 down‐regulated miRNA. Top 10 up‐ and down‐regulated differentially expressed miRNA was listed in Table 3. Figure 2 showed the heat map of all differentially expressed miRNA.
Table 2.
Top 10 up‐ and down‐regulated DEGs
| ID | Symbol | Combined.ES | P value | FDR | Up/Down |
|---|---|---|---|---|---|
| 55350 | VNN3 | 1.098788106 | 1.68E‐08 | 0.00015739 | Up |
| 1912 | PHC2 | 1.106042072 | 4.44E‐08 | 0.000207716 | Up |
| 7942 | TFEB | 0.930874415 | 8.63E‐08 | 0.000269206 | Up |
| 8291 | DYSF | 0.944578311 | 2.10E‐07 | 0.000393166 | Up |
| 7462 | LAT2 | 0.91656781 | 1.75E‐07 | 0.000393166 | Up |
| 2137 | EXTL3 | 0.978263843 | 9.75E‐07 | 0.000707473 | Up |
| 1052 | CEBPD | 0.93852956 | 1.03E‐06 | 0.000707473 | Up |
| 366 | AQP9 | 0.920634347 | 7.99E‐07 | 0.000707473 | Up |
| 89846 | FGD3 | 0.86933981 | 1.06E‐06 | 0.000707473 | Up |
| 10043 | TOM1 | 0.811419165 | 1.01E‐06 | 0.000707473 | Up |
| 54438 | GFOD1 | −0.857872809 | 2.85E‐07 | 0.000444736 | Down |
| 81537 | SGPP1 | −0.925693388 | 4.02E‐07 | 0.000538047 | Down |
| 356 | FASLG | −0.898564987 | 4.97E‐07 | 0.000544713 | Down |
| 130814 | PQLC3 | −0.888672951 | 5.24E‐07 | 0.000544713 | Down |
| 22836 | RHOBTB3 | −0.763444842 | 3.05E‐06 | 0.001188091 | Down |
| 3560 | IL2RB | −0.890989888 | 3.60E‐06 | 0.001227364 | Down |
| 1524 | CX3CR1 | −0.854049867 | 4.19E‐06 | 0.00126511 | Down |
| 9788 | MTSS1 | −0.818619651 | 4.16E‐06 | 0.00126511 | Down |
| 962 | CD48 | −0.925369052 | 4.83E‐06 | 0.001414235 | Down |
| 51699 | VPS29 | −0.772616109 | 5.02E‐06 | 0.001422705 | Down |
Figure 1.
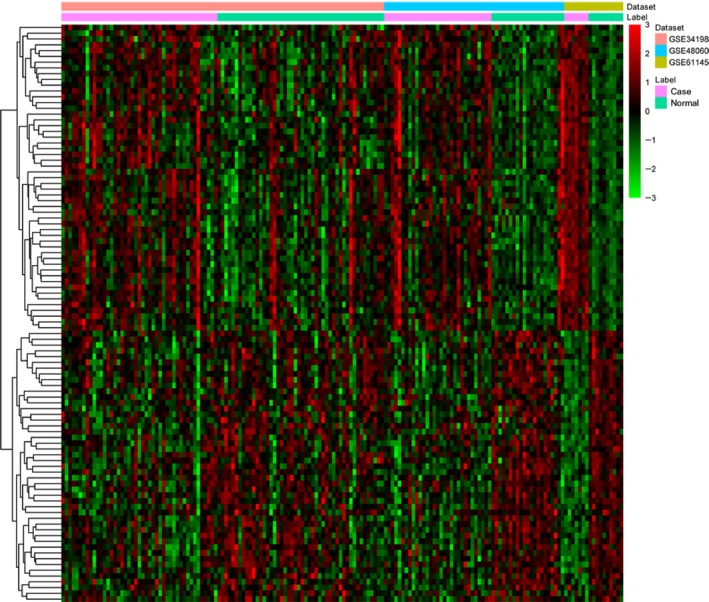
Heat map of top 100 DEGs in MI. Diagram presents the result of a two‐way hierarchical clustering of top 100 DEGs and samples. The clustering is constructed using the complete‐linkage method together with the Euclidean distance. Each row represents a DEG and each column, a sample. DEGs clustering tree is shown on the right. The color scale illustrates the relative level of DEGs expression: purple, below the reference channel; green, higher than the reference.
Table 3.
Top 10 up‐ and down‐regulated differentially expressed miRNA
| Symbol | Combined.ES | P value | FDR | Up/Down |
|---|---|---|---|---|
| hsa‐miR‐375 | 0.964233114 | 3.81E‐11 | 3.23E‐08 | Up |
| hsa‐miR‐520c‐3p | 0.928272928 | 2.90E‐10 | 8.18E‐08 | Up |
| hsa‐miR‐132* | 0.897286366 | 4.05E‐10 | 8.58E‐08 | Up |
| hsa‐miR‐204 | 0.906784899 | 5.45E‐10 | 9.24E‐08 | Up |
| hsa‐miR‐142‐3p | 0.87693145 | 1.32E‐09 | 1.86E‐07 | Up |
| hsa‐miR‐29c* | 0.83581277 | 3.13E‐09 | 3.31E‐07 | Up |
| hsa‐miR‐1274b | 0.803505509 | 1.26E‐08 | 9.72E‐07 | Up |
| hsa‐miR‐1258 | 1.030135467 | 1.23E‐07 | 6.49E‐06 | Up |
| hsa‐miR‐1468 | 0.965203705 | 5.28E‐05 | 0.000520325 | Up |
| hsa‐miR‐609 | 0.887322197 | 0.000406945 | 0.00271117 | Up |
| hsa‐miR‐200a | −0.927575354 | 2.63E‐10 | 8.18E‐08 | Down |
| hsa‐miR‐767‐5p | −0.871863499 | 1.94E‐09 | 2.35E‐07 | Down |
| hsa‐miR‐455‐3p | −0.838268201 | 7.37E‐09 | 6.94E‐07 | Down |
| hsa‐miR‐646 | −0.836200084 | 8.52E‐09 | 7.22E‐07 | Down |
| hsa‐miR‐627 | −0.800880075 | 3.77E‐08 | 2.46E‐06 | Down |
| hsa‐miR‐1245 | −0.917431476 | 4.02E‐07 | 1.46E‐05 | Down |
| hsa‐miR‐515‐5p | −1.095131558 | 1.33E‐05 | 0.000176153 | Down |
| hsa‐miR‐519b‐5p | −0.893325033 | 1.36E‐05 | 0.000177605 | Down |
| hsa‐miR‐155* | −0.921431507 | 7.49E‐05 | 0.000694016 | Down |
| hsa‐miR‐330‐3p | −0.968066113 | 0.000129252 | 0.001085202 | Down |
Figure 2.
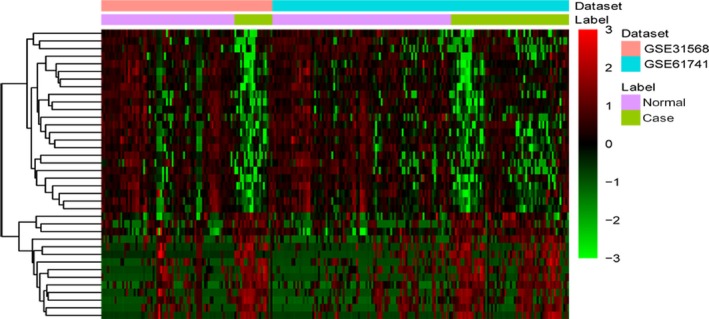
Heat map of all differentially expressed miRNA in MI. Diagram presents the result of a two‐way hierarchical clustering of all differentially expressed miRNA and samples. The clustering is constructed using the complete‐linkage method together with the Euclidean distance. Each row represents a miRNA and each column, a sample. The miRNA clustering tree is shown on the right. The color scale illustrates the relative level of miRNA expression: purple, below the reference channel; green, higher than the reference.
miRNA‐target gene interactions
A total of 1186 miRNA‐target pairs including 392 up‐regulated miRNA‐down‐regulated target pairs and 639 down‐regulated miRNA‐up‐regulated target pairs were obtained. Among which, 132 up‐regulated miRNA‐down‐regulated target pairs and 113 down‐regulated miRNA‐up‐regulated target pairs have been confirmed by miRWalk. The MI‐specific miRNA‐target interaction network was shown in Fig. 3. Table 4 listed the target DEGs of differentially expressed miRNA.
Figure 3.
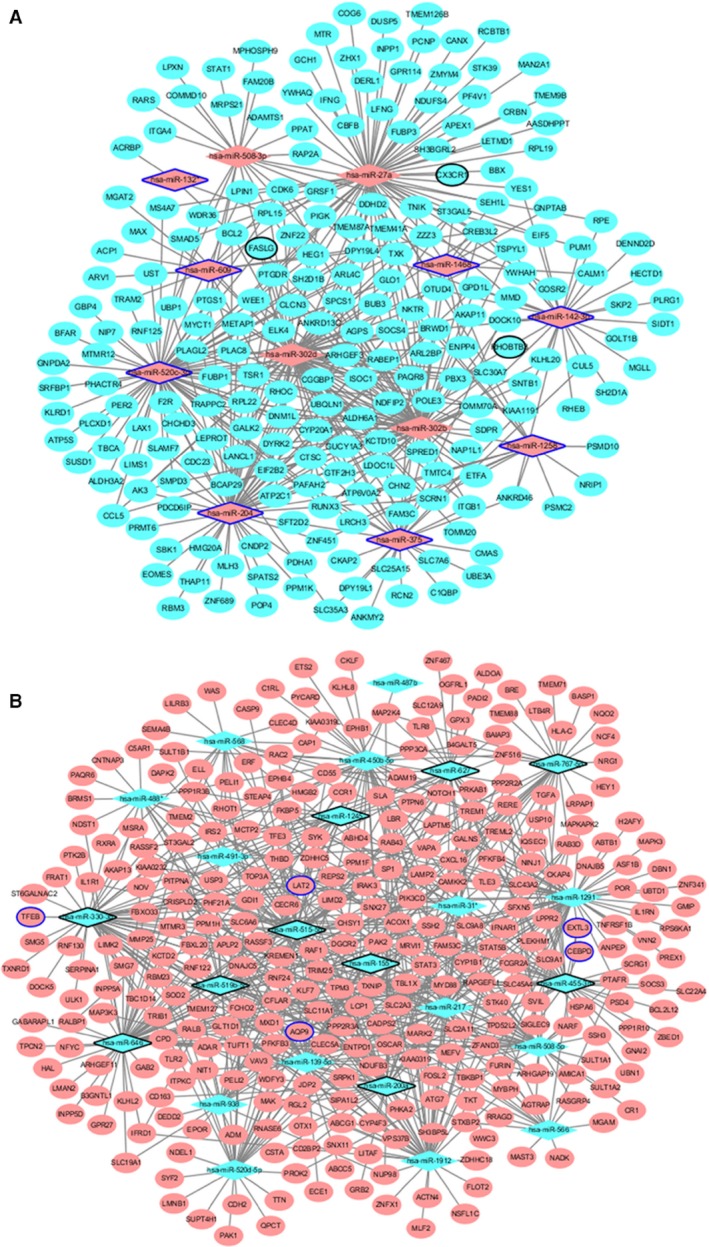
Interaction networks of miRNA and target DEGs in MI. (A) Up‐regulated miRNA and target genes; (B) the down‐regulated miRNA and target genes. The rhombus and ellipses represent the miRNA and target DEGs, respectively. The red and green colors represent up‐regulation and down‐regulation, respectively. Ellipses with blue and black border represent top 10 up‐regulation and down‐regulation, respectively.
Table 4.
The target DEGs of differentially expressed miRNA
| miRNA | Up/Down | Count | Target mRNA |
|---|---|---|---|
| hsa‐miR‐302d | Up | 75 | PIGK, DNM1L, CDK6, LANCL1, FAM3C, AKAP11, CHN2, SH2D1B, SOCS4, SLC30A7, SPRED1, ELK4, ETFA, ENPP4, TNIK, METAP1, ATP6V0A2, GALK2, ZZZ3, ATP2C1, GLO1, DPY19L4, GUCY1A3, UBQLN1, FASLG, ITGB1, SMAD5, NAP1L1, NKTR, ARHGEF3, AK3, PBX3, PLAC8, PLAGL2, BRWD1, POLE3, NDFIP2, OTUD4, BCAP29, PTGDR, CYP20A1, PTGS1, HEG1, RPL15, RPL22, TRAPPC2, CREB3L2, SNTB1, TSPYL1, WEE1, ANKRD13C, KCTD10, LDOC1L, SDPR, DYRK2, PAQR8, AGPS, CGGBP1, RUNX3, ST3GAL5, FUBP1, RABEP1, TOMM20, TOMM70A, CLCN3, SPCS1, GTF2H3, RHOC, ISOC1, TSR1, CCL5, TXK, EIF2B2, BUB3, SCRN1 |
| hsa‐miR‐27a | Up | 71 | PIGK, ARL4C, CDK6, YWHAQ, ZHX1, CLCN3, SOCS4, WDR36, SLC30A7, CX3CR1, DUSP5, EIF5, GPR114, TNIK, LPIN1, DDHD2, MMD, ARL2BP, LETMD1, TMEM87A, ZZZ3, GCH1, STK39, DPY19L4, GRSF1, APEX1, INPP1, SMAD5, MAN2A1, MTR, NDUFS4, NKTR, PAFAH2, CRBN, PF4V1, PLAGL2, BRWD1, PPAT, RCBTB1, TMEM126B, TMEM9B, BBX, PCNP, PTGDR, HEG1, COG6, MS4A7, RAP2A, BCL2, CREB3L2, TSPYL1, WEE1, YES1, ZNF22, SEH1L, CANX, SH3BGRL2, TMTC4, AGPS, CBFB, ST3GAL5, FUBP3, BUB3, ZMYM4, GOSR2, IFNG, LFNG, OTUD4, AASDHPPT, RPL19, DERL1 |
| hsa‐miR‐520c‐3p | Up | 70 | DNM1L, UST, ARL4C, CDK6, GBP4, GNPDA2, WDR36, SLC30A7, SRFBP1, SPRED1, ELK4, F2R, ALDH3A2, METAP1, LPIN1, SLC35A3, GALK2, ATP5S, GLO1, DPY19L4, GTF2H3, GUCY1A3, FASLG, KLRD1, RHOC, LIMS1, SMAD5, PAFAH2, ARHGEF3, PBX3, BFAR, PLAC8, NIP7, PLAGL2, BRWD1, MTMR12, LEPROT, LAX1, CHCHD3, RNF125, PLCXD1, SMPD3, TSR1, BCAP29, KIAA1191, PTGDR, CYP20A1, PTGS1, HEG1, SLAMF7, MS4A7, CCL5, TRAPPC2, SUSD1, PHACTR4, TBCA, WEE1, MYCT1, LRCH3, AGPS, RUNX3, CDC23, PER2, TMEM41A, RABEP1, TRAM2, CLCN3, SPCS1, TXK, EIF2B2 |
| hsa‐miR‐302b | Up | 69 | DNM1L, CDK6, LANCL1, AKAP11, CHN2, SH2D1B, SOCS4, SLC30A7, SPRED1, ELK4, ETFA, ENPP4, TNIK, GPD1L, METAP1, ATP6V0A2, GALK2, ATP2C1, KLHL20, GUCY1A3, UBQLN1, FASLG, ITGB1, NAP1L1, NKTR, ARHGEF3, AK3, PBX3, PLAC8, PLAGL2, BRWD1, POLE3, NDFIP2, OTUD4, DOCK10, BCAP29, PTGDR, CYP20A1, RPL15, RPL22, TRAPPC2, CREB3L2, SNTB1, TSPYL1, WEE1, ANKRD13C, KCTD10, LDOC1L, SDPR, DYRK2, PAQR8, AGPS, CGGBP1, RUNX3, ST3GAL5, RABEP1, TOMM70A, CLCN3, GLO1, SPCS1, GTF2H3, RHOC, ISOC1, TSR1, CCL5, TXK, EIF2B2, BUB3, SCRN1 |
| hsa‐miR‐646 | Down | 61 | TRIB1, ADAR, TXNIP, CAMKK2, RALBP1, LMAN2, RNF24, KLHL2, B3GNTL1, MARK2, TPCN2, KCTD2, GABARAPL1, FBXO33, RASSF3, HAL, NDST1, RAB43, IFRD1, IL1R1, INPP5A, INPP5D, MEFV, MAP3K3, MYD88, NFYC, NOV, ACOX1, RAPGEFL1, PFKFB3, PITPNA, TMEM127, TBC1D14, RAF1, RALB, ST3GAL2, SLC6A6, SLC9A1, SLC19A1, SOD2, SP1, STAT3, SVIL, SYK, TOP3A, TPM3, LAPTM5, KIAA0319L, DNAJC5, KREMEN1, KLF7, IRS2, MTMR3, ENTPD1, PPM1F, ARHGEF11, GAB2, SMG7, OSCAR, GPR27, SLC2A3 |
| hsa‐miR‐1291 | Down | 59 | MRVI1, SLC43A2, DBN1, MARK2, EXTL3, SLC9A8, DNAJB5, GALNS, CECR6, ANPEP, RAB43, IL1RN, MYBPH, NINJ1, NOTCH1, FURIN, PAK2, GMIP, PFKFB4, POR, ASF1B, MAPK3, PTAFR, PREX1, PTPN6, RAF1, RPS6KA1, ABHD4, LPPR2, SLC9A1, SLC11A1, SP1, STAT5B, SYK, TBL1X, TKT, TLE3, TNFRSF1B, TRIM25, LAPTM5, TREML2, UBTD1, ABTB1, LIMD2, STK40, KREMEN1, ZNF341, VNN2, REPS2, MAPKAPK2, SFXN5, ENTPD1, H2AFY, PPM1F, TBKBP1, PLEKHM1, IQSEC1, OSCAR, PFKFB3 |
| hsa‐miR‐204 | Up | 54 | PDCD6IP, DNM1L, ARL4C, LANCL1, HMG20A, CHN2, SOCS4, SLC30A7, PPM1K, SPRED1, ELK4, F2R, RHOBTB3, GPD1L, METAP1, DDHD2, TMEM87A, ZNF451, MLH3, SBK1, PAFAH2, AK3, BRWD1, PRMT6, SMPD3, CNDP2, BCAP29, THAP11, PTGDR, CYP20A1, PTGS1, SLAMF7, RBM3, BCL2, CREB3L2, SPATS2, UBP1, WEE1, ZNF22, MYCT1, EOMES, LDOC1L, PAQR8, AGPS, ST3GAL5, SCRN1, TOMM70A, POP4, ZNF689, SFT2D2, ALDH6A1, PDHA1, CHCHD3, CDC23 |
| hsa‐miR‐330‐3p | Down | 52 | FRAT1, TRIB1, ST6GALNAC2, IRAK3, AKAP13, RNF24, FCHO2, JDP2, CPD, GLT1D1, PTK2B, WDFY3, SMG5, CECR6, AQP9, LAMP2, MXD1, MSRA, ACOX1, PFKFB3, SERPINA1, RNF130, PPM1H, TBC1D14, CXCL16, RRAGD, RAF1, RALB, RXRA, ABHD4, ST3GAL2, SOD2, TBL1X, TXNRD1, TRIM25, TFEB, PPP1R3B, STEAP4, DOCK5, DNAJC5, CRISPLD2, KREMEN1, ULK1, SSH2, MTMR3, VAPA, ENTPD1, ZNF516, KIAA0232, SMG7, RBM23, SP1 |
| hsa‐miR‐200a | Down | 46 | CD2BP2, OSCAR, CPD, CSTA, FKBP5, WDFY3, GRB2, LBR, CYP4F3, MAK, MAP3K3, NDUFB3, NUP98, FURIN, ACOX1, PITPNA, PPP2R2A, PRKAB1, MCTP2, PPM1H, SIPA1L2, RALB, MAP2K4, SLC6A6, SP1, STAT5B, THBD, TOP3A, LAT2, DNAJC5, SH3BP5L, KLF7, IRS2, REPS2, CD163, ENTPD1, RAB3D, ZNF516, KIAA0319, FCHO2, CYP1B1, OTX1, RGL2, SOD2, STXBP2, RASSF2 |
| hsa‐miR‐515‐5p | Down | 46 | IRAK3, EPHB4, ERF, CHSY1, FKBP5, FOSL2, TMEM2, ZDHHC5, GDI1, RASSF3, APLP2, IL1R1, RERE, PAK2, ACOX1, PHF21A, PITPNA, PPP2R2A, TMEM127, PPM1H, RAC2, RNASE6, SLC11A1, SP1, STAT5B, THBD, TPM3, TUFT1, PPP1R3B, LIMD2, ELL, CASP9, FBXL20, ARHGAP19, SSH2, KLF7, MTMR3, CADPS2, ENTPD1, RASSF2, USP3, DGCR2, VAV3, CD55, DAPK2, NOTCH1 |
| hsa‐miR‐1912 | Down | 46 | ADAR, MRVI1, ATG7, IRAK3, GLT1D1, FLOT2, SLC9A8, KCTD2, FOSL2, SNX11, RAB43, IFRD1, AQP9, MYBPH, MYD88, NUP98, RAPGEFL1, PFKFB3, TREM1, PRKAB1, TMEM127, MCTP2, NSFL1C, PELI2, ZNFX1, SLA, SLC2A3, SLC6A6, SLC11A1, SRPK1, STAT5B, SYK, TGFA, TKT, TPM3, MLF2, SH3BP5L, CFLAR, VAPA, LITAF, ENTPD1, RAB3D, ABCG1, TBKBP1, ACTN4, ZDHHC18 |
| hsa‐miR‐508‐5p | Down | 42 | RASGRP4, AMICA1, JDP2, CR1, GLT1D1, CYP1B1, FKBP5, LAMP2, LCP1, MEFV, RERE, PAK2, ACOX1, PIK3CD, PPP2R3A, PTAFR, PROK2, ZFAND3, SLC11A1, SULT1A2, SULT1A1, TBL1X, TFE3, TPM3, TUFT1, LAT2, TRIM25, TREML2, ARHGAP19, CFLAR, SFXN5, DGCR2, OSCAR, NARF, SIGLEC9, HSPA6, SSH3, RBM23, FBXL20, SSH2, ENTPD1, RAB3D |
| hsa‐miR‐455‐3p | Down | 40 | RNF24, EXTL3, UBN1, LAMP2, RERE, PAK2, FAM53C, PFKFB4, PPP1R10, PPP2R2A, TMEM127, SLC45A4, PTAFR, SLC22A4, SRPK1, SVIL, TGFA, SNX27, KLF7, SOCS3, ZBED1, SFXN5, KIAA0319, CEBPD, TXNIP, CKAP4, SCRG1, FKBP5, PSD4, NARF, SIGLEC9, GNAI2, HSPA6, IFNAR1, ACOX1, CXCL16, TFE3, TPM3, BCL2L12, USP10 |
| hsa‐miR‐450b‐5p | Down | 40 | MRVI1, CAP1, RALBP1, EPHB1, ETS2, CECR6, HMGB2, CLEC4D, RAB43, LAMP2, LBR, PAK2, CKLF, C1RL, PIK3CD, PPP2R2A, PPP3CA, PELI1, KLHL8, RAC2, ST3GAL2, SOD2, STAT5B, TPM3, C5AR1, STEAP4, KIAA0319L, SNX27, SSH2, KLF7, IRS2, ADAM19, USP10, VAPA, B4GALT5, ENTPD1, ZNF516, IQSEC1, SLC43A2, PYCARD |
| hsa‐miR‐520d‐5p | Down | 33 | CDH2, TRIB1, TXNIP, CAMKK2, FCHO2, WDFY3, QPCT, MXD1, MAK, PAK2, PHF21A, PFKFB3, PITPNA, RBM23, PRKAB1, RNASE6, SLC6A6, SRPK1, SUPT4H1, TBL1X, TTN, TUFT1, TRIM25, NDEL1, RAB3D, DGCR2, ADM, SYF2, LMNB1, PAK1, PROK2, SOD2, CRISPLD2 |
| hsa‐miR‐139‐5p | Down | 33 | ABCC5, MRVI1, FCHO2, JDP2, OSCAR, ECE1, CLEC5A, APLP2, MXD1, NIT1, NOTCH1, PAK2, ACOX1, PITPNA, PPP2R3A, SLC45A4, ZFAND3, SRPK1, TBL1X, THBD, TPM3, TRIM25, VPS37B, ITPKC, DNAJC5, CRISPLD2, ARHGAP19, SSH2, KLF7, ABCG1, KIAA0319, HMGB2, RHOT1 |
| hsa‐miR‐142‐3p | Up | 30 | MGLL, ANKRD46, SPRED1, RHOBTB3, MMD, HECTD1, KLHL20, DPY19L4, PLRG1, BRWD1, SIDT1, RHEB, RPE, DENND2D, CALM1, CUL5, GOSR2, PUM1, EIF5, GPD1L, SH2D1A, GOLT1B, OTUD4, DOCK10, KIAA1191, CREB3L2, SKP2, TSPYL1, YES1, YWHAH |
| hsa‐miR‐375 | Up | 29 | ARL4C, ELK4, MMD, LEPROT, ANKMY2, SLC25A15, FAM3C, CTSC, ANKRD46, SPRED1, DPY19L1, SLC35A3, ARL2BP, CKAP2, ITGB1, SFT2D2, PAFAH2, CMAS, KIAA1191, CYP20A1, RCN2, BCL2, C1QBP, UBE3A, CUL5, KCTD10, TMTC4, PAQR8, SLC7A6 |
| hsa‐miR‐767‐5p | Down | 29 | BASP1, CAMKK2, LTB4R, TMEM71, HEY1, NRG1, HLA‐C, MXD1, NCF4, NQO2, ACOX1, PIK3CD, PPP3CA, AGTRAP, MAP2K4, TGFA, TPM3, LAT2, SSH2, CFLAR, TMEM88, VAPA, B4GALT5, SFXN5, BRE, ZNF516, LRPAP1, TLE3, RAB3D |
| hsa‐miR‐627 | Down | 29 | IRAK3, PADI2, ZNF467, GPX3, MYD88, RAPGEFL1, PFKFB4, PITPNA, SLC12A9, PTPN6, MAP2K4, SLA, TREML2, KREMEN1, MTMR3, BAIAP3, SFXN5, KIAA0232, CYP1B1, CD55, EPHB1, ALDOA, NINJ1, NOTCH1, TLR8, TREM1, PRKAB1, SP1, OGFRL1 |
| hsa‐miR‐217 | Down | 28 | ATG7, IRAK3, FCGR2A, CHSY1, LBR, MXD1, ACOX1, PHKA2, TREM1, WWC3, PPM1H, SLC6A6, SLC2A11, STAT5B, TGFA, TPD52L2, DNAJC5, ARHGAP19, CFLAR, MTMR3, CADPS2, ENTPD1, RAB3D, PPM1F, KIAA0232, PLEKHM1, CKAP4, STK40 |
| hsa‐miR‐519b‐5p | Down | 26 | CAMKK2, IRAK3, FKBP5, WDFY3, SLC9A8, IFRD1, LAMP2, LCP1, LIMK2, PAK2, FAM53C, PHF21A, PIK3CD, PPP2R3A, PELI2, PTAFR, PPM1H, MAP2K4, MMP25, ST3GAL2, TLR2, RNF122, ARHGAP19, CFLAR, MTMR3, ENTPD1 |
| hsa‐miR‐508‐3p | Up | 22 | ARL4C, MPHOSPH9, WDR36, ELK4, DPY19L4, ITGA4, COMMD10, PPAT, PTGS1, RAP2A, RARS, RPE, RPL15, STAT1, UBP1, YWHAH, MYCT1, LPXN, ADAMTS1, FAM20B, MRPS21, PUM1 |
| hsa‐miR‐938 | Down | 19 | TRIB1, ADAR, ADM, DEDD2, EPOR, CECR6, MXD1, NUP98, FAM53C, MAP2K4, LPPR2, SLC11A1, SLC19A1, SRPK1, DNAJC5, SSH2, ADAM19, CFLAR, VAV3 |
| hsa‐miR‐568 | Down | 18 | CAP1, SEMA4B, LILRB3, FBXO33, GALNS, CLEC4D, MSRA, NOTCH1, PHF21A, TREM1, RHOT1, MCTP2, SLC6A6, STAT5B, WAS, PPP1R3B, STEAP4, ELL |
| hsa‐miR‐488* | Down | 17 | AKAP13, NDST1, ACOX1, PHF21A, PELI1, PPM1H, SYK, TFE3, TPM3, C5AR1, CNTNAP3, PAQR6, SNX27, CFLAR, RASSF2, BRMS1, RXRA |
| hsa‐miR‐566 | Down | 17 | IRAK3, RASGRP4, MAST3, MEFV, RAPGEFL1, AGTRAP, PTAFR, NADK, STAT3, TBL1X, TPM3, CRISPLD2, EXTL3, FOSL2, RRAGD, STXBP2, MGAM |
| hsa‐miR‐1258 | Up | 14 | SLC30A7, ENPP4, ATP6V0A2, ZNF451, ALDH6A1, NKTR, BRWD1, PSMC2, PSMD10, NRIP1, LRCH3, RUNX3, SCRN1, ANKRD46 |
| hsa‐miR‐1245 | Down | 14 | CCR1, IFNAR1, NIT1, RHOT1, PTPN6, SLC2A11, SYK, TOP3A, LAT2, PPP1R3B, CRISPLD2, CFLAR, RASSF2, KIAA0232 |
| hsa‐miR‐31* | Down | 14 | CAMKK2, CYP1B1, FKBP5, KCTD2, MYD88, SLC6A6, STAT3, TLE3, TRIM25, SNX27, KIAA0232, TXNIP, HSPA6, SP1 |
| hsa‐miR‐609 | Up | 13 | UST, CDK6, CTSC, DPY19L4, GRSF1, MAX, MGAT2, CREB3L2, ARV1, TRAM2, ALDH6A1, PLAC8, ACP1 |
| hsa‐miR‐491‐3p | Down | 10 | FKBP5, NOV, PAK2, RHOT1, SLA, THBD, TPM3, SNX27, VAPA, SULT1B1 |
| hsa‐miR‐155* | Down | 9 | IRAK3, FCHO2, RERE, NOTCH1, PITPNA, TRIM25, MRVI1, TXNIP, MYD88 |
| hsa‐miR‐1468 | Up | 7 | SEH1L, SLC30A7, ENPP4, ZZZ3, GNPTAB, CALM1, TMEM41A |
| hsa‐miR‐132* | Up | 3 | BCL2, RPL15, ACRBP |
| hsa‐miR‐487b | Down | 1 | MAP2K4 |
Enrichment analyses of target genes of differentially expressed miRNA
In target genes analysis of differentially expressed miRNA, a total of 528 target DEGs were obtained. To study the biological function of these target DEGs, GO enrichment and KEGG pathway analysis were performed. Based on the top 15 GO terms, enrichment analysis (Fig. 4), carbohydrate metabolic process, platelet activation, and nerve growth factor receptor signaling pathway were the most significantly enriched biological processes; intracellular, nucleolus, and membrane fraction were the most remarkably enriched cellular components; hydrolase activity, sequence‐specific DNA binding transcription factor activity, and protein serine/threonine kinase activity were the most significantly enriched molecular functions. Additionally, hypertrophic cardiomyopathy (HCM) and viral myocarditis were the most remarkably enriched signal pathways (Table 5 and Fig. 4).
Figure 4.
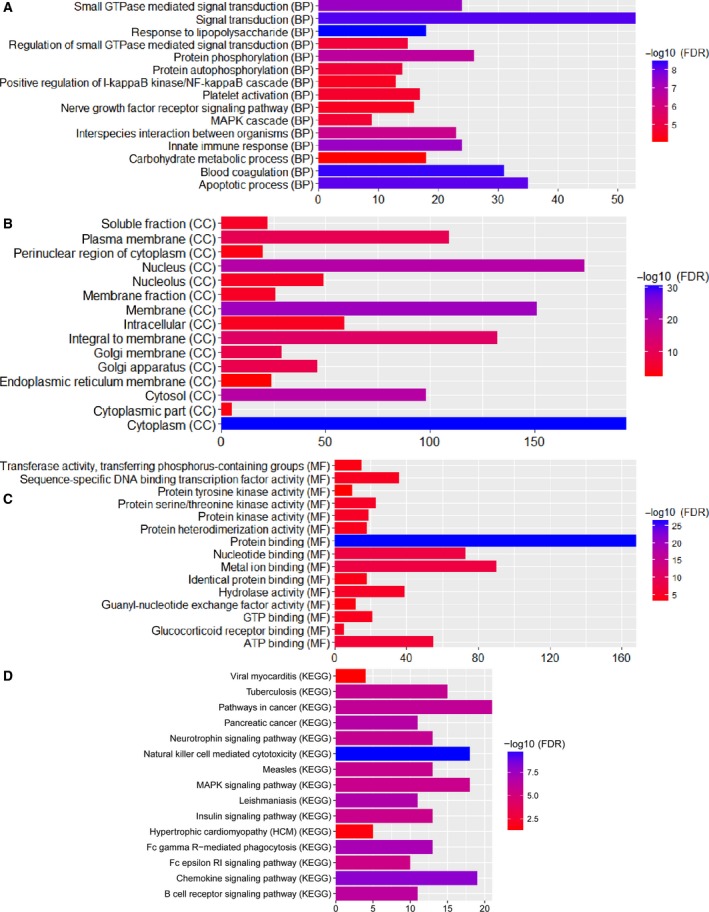
Top 15 significant enrichment GO and KEGG terms of DEGs. (A) BP: biological process; (B) CC: cellular component; (C) MF: molecular function; (D) KEGG: signaling pathway.
Table 5.
Enriched KEGG pathway of target DEGs in MI
| Items | Items_Details | Count | Size | FDR | Symbols |
|---|---|---|---|---|---|
| 04650 | Natural killer cell‐mediated cytotoxicity | 18 | 125 | 1.71E‐10 | SH2D1B, MAPK3, PTK2B, RAC2, SH2D1A, IFNG, GRB2, SYK, HLA‐C, FASLG, PTPN6, PAK1, KLRD1, RAF1, PIK3CD, PPP3CA, IFNAR1, VAV3 |
| 04666 | Fc gamma R‐mediated phagocytosis | 13 | 92 | 8.05E‐08 | MAPK3, WAS, RAC2, SYK, GAB2, DNM1L, FCGR2A, PAK1, RAF1, PIK3CD, INPP5D, VAV3, LIMK2 |
| 04662 | B‐cell receptor signaling pathway | 11 | 75 | 5.55E‐07 | MAPK3, RAC2, GRB2, LILRB3, SYK, PTPN6, RAF1, PIK3CD, PPP3CA, INPP5D, VAV3 |
| 05200 | Pathways in cancer | 21 | 324 | 9.56E‐07 | CDK6, STAT1, MAPK3, TGFA, MAX, RAC2, STAT3, TPM3, GRB2, RALB, CASP9, FASLG, RALBP1, SKP2, RAF1, PIK3CD, BCL2, ITGB1, RXRA, DAPK2, STAT5B |
| 04722 | Neurotrophin signaling pathway | 13 | 124 | 1.41E‐06 | YWHAH, MAPK3, YWHAQ, MAPKAPK2, GRB2, MAP3K3, FASLG, RAF1, IRAK3, PIK3CD, BCL2, RPS6KA1, IRS2 |
| 05152 | Tuberculosis | 15 | 172 | 1.50E‐06 | STAT1, MAPK3, TLR2, ATP6V0A2, IFNG, SYK, CASP9, MYD88, FCGR2A, RAF1, BCL2, PPP3CA, NFYC, LAMP2, CR1 |
| 05162 | Measles | 13 | 130 | 2.02E‐06 | CDK6, STAT1, TLR2, SH2D1A, STAT3, IFNG, HSPA6, MYD88, FASLG, PIK3CD, ADAR, STAT5B, IFNAR1 |
| 04010 | MAPK signaling pathway | 18 | 262 | 2.30E‐06 | MAPK3, RASGRP4, MAX, IL1R1, RAC2, MAPKAPK2, GRB2, MAP3K3, MAP2K4, HSPA6, ELK4, FASLG, DUSP5, PAK1, RAF1, PPP3CA, RPS6KA1, PAK2 |
| 05410 | HCM | 5 | 82 | 0.0278085 | ITGA4, TTN, TPM3, ITGB1, PRKAB1 |
| 05416 | Viral myocarditis | 4 | 63 | 0.043939 | CD55, RAC2, CASP9, HLA‐C |
Protein–protein interaction network
To obtain the interaction between the proteins encoded by DEGs and other proteins, PPI network was explored and visualize by Cytoscape. PPI networks of top 50 up‐regulated and top 50 down‐regulated DEGs were shown in Fig. 5. As Fig. 5 shown, the network consisted of 170 nodes and 148 edges. The top twelve proteins with a high degree were GRB2 (degree = 8), PLAUR (degree = 8), FASLG (degree = 8), BCOR (degree = 7), TFEB (degree = 6), DDIT3 (degree = 6), IRS2 (degree = 6), MAST3 (degree = 5), DDX21 (degree = 5), IL2RB (degree = 5), LIMS1 (degree = 5), and FLOT1 (degree = 5).
Figure 5.
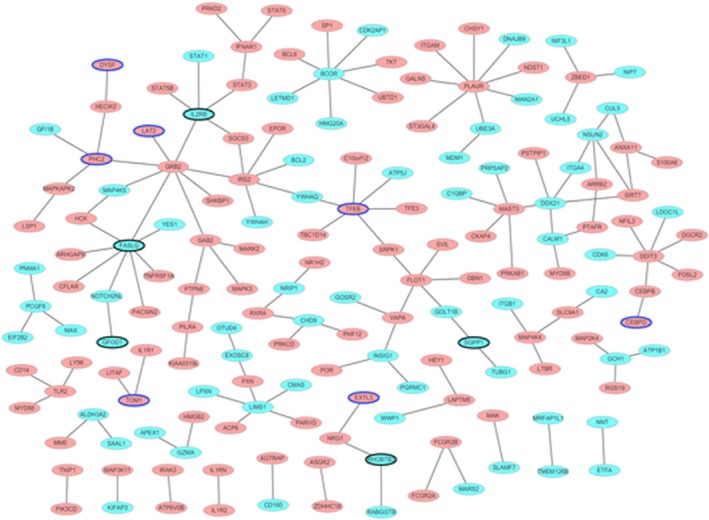
The PPI networks of top 100 DEGs. All the ellipses are proteins encoded by top 100 DEGs. The red and green colors represent up‐regulation and down‐regulation, respectively. Ellipses with blue and black border represent top 10 up‐regulation and down‐regulation, respectively.
Receiver operating characteristic curve analysis
We performed receiver operating characteristic curve analyses and calculated the AUC to assess the discriminatory ability of selected six miRNA (miR‐27a, miR‐31*, miR‐139‐5p, miR‐204, miR‐375, and miR‐1291) and three DEGs (CX3CR1, HSPA6, and TPM3) from GEO dataset (Fig. 6). The AUC of all these DEGs and miRNA was > 0.7. MiR‐27a, miR‐31*, and miR‐1291 had the largest AUC. For MI diagnosis, the specificity and sensitivity of miR‐27a were 72.9% and 95%, respectively; the specificity and sensitivity of miR‐31* were 78.6% and 85%, respectively; the specificity and sensitivity of miR‐139‐5p were 84.3% and 65%, respectively; the specificity and sensitivity of miR‐204 were 77.1% and 75%, respectively; the specificity and sensitivity of miR‐375 were 88.6% and 65%, respectively; the specificity and sensitivity of miR‐1291 were 90% and 65%, respectively; the specificity and sensitivity of CX3CR1 were 96.8% and 52.4%, respectively; the specificity and sensitivity of HSPA6 were 67.7% and 81%, respectively; the specificity and sensitivity of TPM3 were 71% and 71.4%, respectively. In addition, the data of the receiver operating characteristic analysis including the C‐statistic and 95% confidence interval and odds ratio and 95% confidence interval were listed in Table 6.
Figure 6.
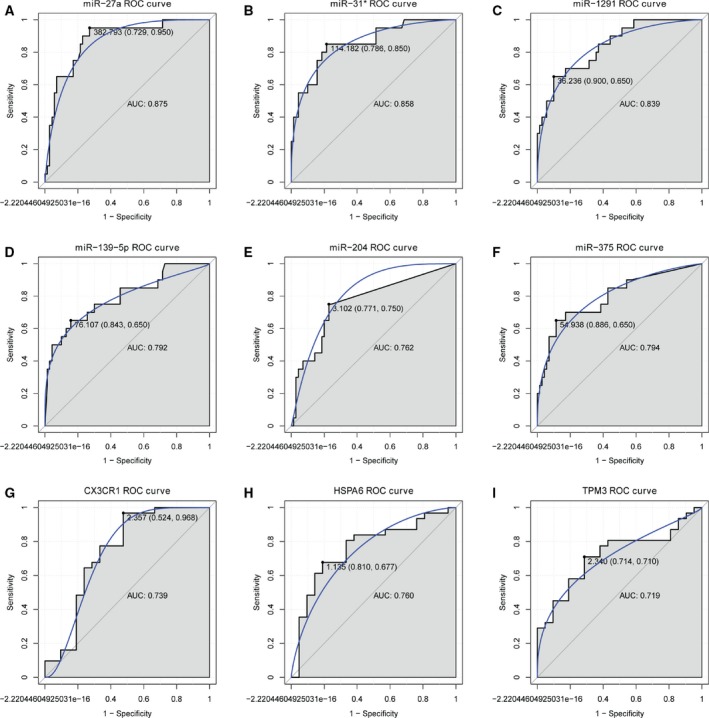
receiver operating characteristic curves of selected DEGs and differentially expressed miRNA between MI patients and healthy controls. (A) miR‐27a; (B) miR‐31*; (C) miR‐1291; (D) miR‐139‐5p; (E) miR‐204; (F) miR‐375; (G) CX3CR1; (H) HSPA6; (I) TPM3. The receiver operating characteristic curves were used to show the diagnostic ability of these selected DEGs and differentially expressed miRNA with specificity and sensitivity. The x‐axis shows 1‐specificity, and y‐axis shows sensitivity.
Table 6.
The data of receiver operating characteristic analysis
| miRNA/mRNA | AUC | 95% confidence interval | Odds ratio | 95% confidence interval |
|---|---|---|---|---|
| miR‐27a | 0.8754 | 0.7902–0.9605 | 51 | 6.3793–407.7280 |
| miR‐31* | 0.8575 | 0.7615–0.9535 | 20.7778 | 5.3666–80.4666 |
| miR‐1291 | 0.8393 | 0.7432–0.9354 | 16.7143 | 5.0049–55.8192 |
| miR‐139‐5p | 0.7921 | 0.6707–0.9136 | 9.961 | 3.2439–30.5871 |
| miR‐204 | 0.7625 | 0.6457–0.8793 | 10.125 | 3.1877–32.1598 |
| miR‐375 | 0.7943 | 0.6725–0.9161 | 14.3929 | 4.4338–46.7221 |
| CX3CR1 | 0.7389 | 0.5844–0.8933 | 33 | 3.7729–288.6339 |
| HSPA6 | 0.7604 | 0.6221–0.8987 | 6.72 | 1.9153–23.5773 |
| TPM3 | 0.7189 | 0.578–0.8598 | 6.1111 | 1.7972–20.7800 |
Quantitative RT‐PCR
To verify the bioinformatics analyses, the expression level of DEGs and differentially expressed miRNA was quantified by qRT‐PCR in five blood samples of MI patients and five normal blood samples. Three DEGs (HSPA6, CX3CR1, and TPM3) and three differentially expressed miRNA (miR‐139‐5p, miR‐31*, and miR‐27a) were selected for validation. As showed in Fig. 7, HSPA6, miR‐139‐5p, miR‐31*, and miR‐27a were up‐regulated and CX3CR1 and TPM3 were down‐regulated. The validation result was consistent with the bioinformatics except TPM3, miR‐139‐5p, and miR‐31*.
Figure 7.
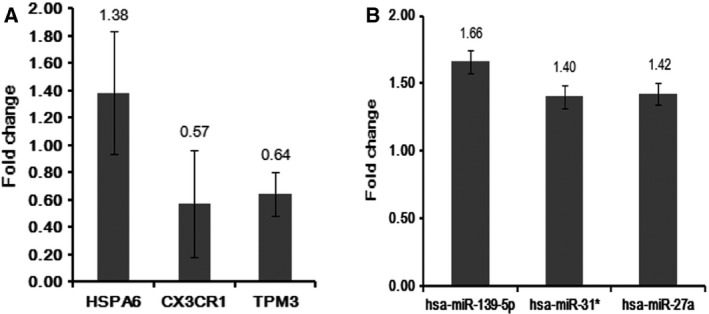
Validation differentially expressed miRNAs and genes in the MI blood by qRT‐PCR. (A) The expression of differentially expressed genes; (B) The expression of differentially expressed miRNAs.
Early stage expression analyses and recovery‐related analysis of differentially expressed genes
As shown in Fig. 8, TFEB, IRS2, GRB2, FASLG, LIMS1, CX3CR1, HSPA6, TPM3, LAT2, CEBPD, AQP9, and MAPKAPK2 were differentially expressed in different time points. Furthermore, all these genes were associated with the recovery of MI (Fig. 9).
Figure 8.
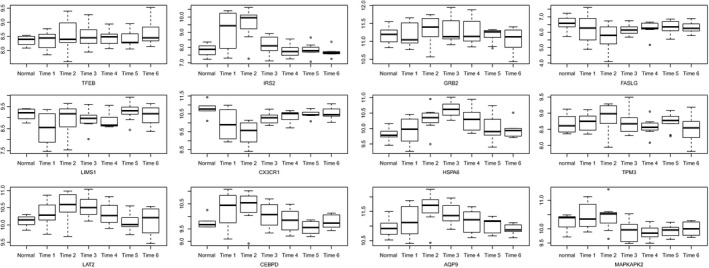
Expression of DEGs in early stage of MI. Time 1: 12 h after blood collection; Time 2: 24 h after blood collection; Time 3: 36 h after blood collection; Time 4: 72 h after blood collection; Time 5: 84 h after blood collection; Time 6: 96 h after blood collection.
Figure 9.
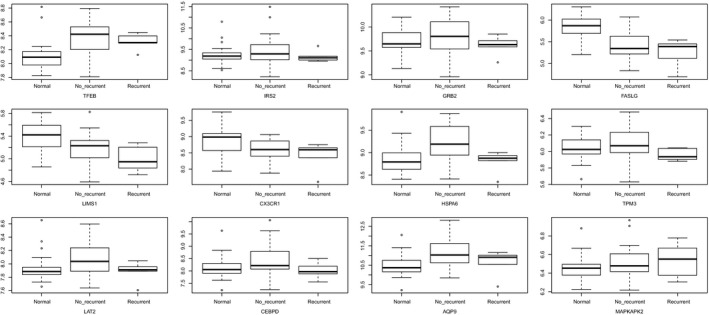
Recovery‐related analysis of DEGs.
Discussion
Myocardial infarction is an important clinical problem because of its large contribution to mortality. Therefore, it is urgent to elucidate MI carcinogenesis mechanism for developing novel diagnose that will be highly specific to malignant cells, with minimal or no risk of adverse effect. In this study, we found several differentially expressed miRNA and genes, which may play an important role in the development of MI.
Linker for activation of T cells family member 2 is involved in the process of calcium mobilization, which is associated with coronary artery calcification in atherosclerosis 27. Herein, we found that LAT2 was regulated by both miR‐767‐5p and miR‐1245 in the blood of MI. MiR‐767‐5p has been found differentially expressed in the heart tissue of patients with MI 11. However, there are not any reports about miR‐1245 in the development of heart. Further research is needed to study the function of miR‐1245.
CCAAT/enhancer binding protein delta (also called CELF) is a transcription factor important in activating the expression of inflammatory genes in cardiac myocytes 28. In animal models, the expression of CEBPD altered in skeletal and muscular functions and overexpression of the dominant negative CEBPD protein results in fibrosis, cardiac hypertrophy, and dilated cardiomyopathy 29, 30, 31. In our study, CEBPD was regulated by miR‐455‐3p in the blood of MI. It is noted that the expression of miR‐455‐3p was deregulated early during acute MI 32.
C‐X3‐C motif chemokine receptor 1 is associated with the prevalence of coronary heart disease or MI 33. In this study, we found that CX3CR1 was under the regulation of miR‐27a. Romaine et al. 34 found that miR‐27a had a high specificity in predicting the occurrence of left ventricular failure 6 months after acute MI. It is worth mentioning that miR‐27a is the prognostic indicator for acute MI 35. In this study, we found that both miR‐27a and target gene CX3CR1 had a great diagnostic value for MI.
Aquaporin 9 is a gap junction network gene that is vital to heart function. It is reported that AQP9 is also related to acute MI 36. Kuiper et al. 37 found that TFEB was expressed in the myocardium of the adult. In this study, we found that AQP9 and TFEB were under the regulation of miR‐330‐3p in blood of MI. It is noted that miR‐330‐3p is up‐regulated in heart but down‐regulated in the plasma of patients with chronic heart failure 38.
In addition, we also found several DEGs (such as IRS2, GRB2, FASLG, and LIMS1) with a high degree in the PPI network. IRS2 plays a key role in cardiac homeostasis regulation 39. Zawada et al. 40 also found that GRB2 plays an important role in the signaling pathway for cardiac hypertrophy. Herein, we found both IRS2 and GRB2 were regulated by miR‐200a. It is demonstrated that miR‐200a is involved in the cardiovascular differentiation 41.
Fas ligand (also called TNFSF6) is a member of the TNF family and the main activator of the extrinsic apoptotic pathway that binds the TNF receptor to induce apoptosis during MI 42. LIMS1 (also called PINCH1) has been suggested to be associated with left‐sided congenital heart disease 43. In this study, FASLG and LIMS1 were under the regulation of miR‐520c‐3p. It is found that treatment with miR‐520c will increase MMP‐9 expression, which regulates remodeling of the left ventricle after MI and is tightly linked to the inflammatory response 44.
It is reported that MAPK is a key signal pathway in MI 45. According to KEGG pathway enrichment analysis in MI, MAPK signal pathway was found covered the most DEGs, such as HSPA6 and MAPKAPK2. HSPA6 is found to be a regulated protein in planned MI patient samples 46. MAPKAPK2 is the substrate for p38‐MAPK and less abundant in failing heart 47, 48. In the present study, we found that HSPA6 and MAPKAPK2 were regulated by miR‐31* and miR‐1291, respectively. It is worth mentioning that HSPA6 and miR‐31* had a great diagnose value for MI. MiR‐1291 has been identified as a potential diagnosis biomarker for acute MI 49.
Clinically, HCM is defined in the presence of left ventricular hypertrophy in the absence of hypertension and valve disease. In this study, HCM was found to be the most enriched signal pathway, which involved several genes such as TPM3. TPM3 is found to be a regulated protein in planned MI patient samples 46. Herein, we found that TPM3 was regulated by miR‐139‐5p, and both miR‐139‐5p and TPM3 had a great diagnose value for MI. In human autopsy samples, miR‐139‐5p is down‐regulated earlier, within just 7 days following MI 11.
Beside miR‐27a, miR‐31*, and miR‐139‐5p, we also found that miR‐204 and miR‐375 had the diagnose value for MI. MiR‐204 is an autophagy‐modulating miRNA that was related to cardiovascular disease 50. It is reported that the expression of miR‐375 is remarkably up‐regulated in heart tissue of MI and circulating miR‐375 is a potential diagnostic biomarker for MI 51, 52. In this study, we found both miR‐204 and miR‐375 had a great diagnose value for MI.
To analyze the expression of TFEB, IRS2, GRB2, FASLG, LIMS1, CX3CR1, HSPA6, TPM3, LAT2, CEBPD, AQP9, and MAPKAPK2 in the early stage of MI and further study the association between these genes with MI recovery, the datasets of http://www.ncbi.nlm.nih.gov/geo/query/acc.cgi?acc=GSE29532 and http://www.ncbi.nlm.nih.gov/geo/query/acc.cgi?acc=GSE48060 were used for analysis. Our results showed that all these genes were differentially expressed in different blood collection points. Moreover, these genes were associated with the recovery of MI. Therefore, we inferred that these genes may be considered as biomarkers for early stages of MI, as well as for monitoring early MI recovery.
In summary, we found several differentially expressed miRNA and genes in the blood of MI. MiR‐27a, miR‐31*, miR‐1291, miR‐139‐5p, miR‐204, miR‐375, and target genes including CX3CR1, HSPA6, and TPM3 had a great diagnose value for MI. Additionally, MAPK and HCM were important signal pathways in the development of MI. TFEB, IRS2, GRB2, FASLG, LIMS1, CX3CR1, HSPA6, TPM3, LAT2, CEBPD, AQP9, and MAPKAPK2 may regard as biomarkers in MI early stage and recovery. Our study may be helpful in understanding the pathology mechanism of MI and could provide the clues in clinical diagnose and drug design of MI. There are limitations to our study. Firstly, sample size in the qRT‐PCR was small. Larger numbers of blood samples are needed for further research. Secondly, some animal models and cell culture experiments are needed to validate and explore the potential function of identified differentially expressed miRNA and genes in MI.
Author contributions
QuZ conceived and supervised the study; QuZ, KW, and QiZ designed experiments; ZL and NL performed experiments; QX and XL analyzed data; KW and QiZ wrote the manuscript; KW, QiZ, and QuZ made manuscript revisions.
Supporting information
Table S1. All differentially expressed genes.
These authors contributed equally to this paper.
References
- 1. Rodriguez M, Cai WJ, Kostin S, Lucchesi BR and Schaper J (2005) Ischemia depletes dystrophin and inhibits protein synthesis in the canine heart: mechanisms of myocardial ischemic injury. J Mol Cell Cardiol 38, 723–733. [DOI] [PubMed] [Google Scholar]
- 2. Yamada Y, Ichihara S and Nishida T (2008) Molecular genetics of myocardial infarction. Genom Med 2, 7–22. [DOI] [PMC free article] [PubMed] [Google Scholar]
- 3. Swirski FK and Nahrendorf M (2013) Leukocyte behavior in atherosclerosis, myocardial infarction, and heart failure. Science 339, 161–166. [DOI] [PMC free article] [PubMed] [Google Scholar]
- 4. Weinberger T and Schulz C (2015) Myocardial infarction: a critical role of macrophages in cardiac remodeling. Front Physiol 6, 107. [DOI] [PMC free article] [PubMed] [Google Scholar]
- 5. Goldberger JJ, Bonow RO, Cuffe M, Liu L, Rosenberg Y, Shah PK, Smith SC Jr and Subacius H (2015) Effect of beta‐blocker dose on survival after acute myocardial infarction. J Am Coll Cardiol 66, 1431–1441. [DOI] [PMC free article] [PubMed] [Google Scholar]
- 6. Liu N and Olson EN (2010) MicroRNA regulatory networks in cardiovascular development. Dev Cell 18, 510–525. [DOI] [PMC free article] [PubMed] [Google Scholar]
- 7. Vickers KC, Rye KA and Tabet F (2014) MicroRNAs in the onset and development of cardiovascular disease. Clin Sci (Lond) 126, 183–194. [DOI] [PMC free article] [PubMed] [Google Scholar]
- 8. Porrello ER (2013) microRNAs in cardiac development and regeneration. Clin Sci (Lond) 125, 151–166. [DOI] [PubMed] [Google Scholar]
- 9. Wen Z, Zheng S, Zhou C, Yuan W, Wang J and Wang T (2012) Bone marrow mesenchymal stem cells for post‐myocardial infarction cardiac repair: microRNAs as novel regulators. J Cell Mol Med 16, 657–671. [DOI] [PMC free article] [PubMed] [Google Scholar]
- 10. Meder B, Keller A, Vogel B, Haas J, Sedaghat‐Hamedani F, Kayvanpour E, Just S, Borries A, Rudloff J, Leidinger P et al (2011) MicroRNA signatures in total peripheral blood as novel biomarkers for acute myocardial infarction. Basic Res Cardiol 106, 13–23. [DOI] [PubMed] [Google Scholar]
- 11. Bostjancic E, Zidar N and Glavac D (2009) MicroRNA microarray expression profiling in human myocardial infarction. Dis Markers 27, 255–268. [DOI] [PMC free article] [PubMed] [Google Scholar]
- 12. Liang H, Zhang C, Ban T, Liu Y, Mei L, Piao X, Zhao D, Lu Y, Chu W and Yang B (2012) A novel reciprocal loop between microRNA‐21 and TGFbetaRIII is involved in cardiac fibrosis. Int J Biochem Cell Biol 44, 2152–2160. [DOI] [PubMed] [Google Scholar]
- 13. Shan ZX, Lin QX, Fu YH, Deng CY, Zhou ZL, Zhu JN, Liu XY, Zhang YY, Li Y, Lin SG et al (2009) Upregulated expression of miR‐1/miR‐206 in a rat model of myocardial infarction. Biochem Biophys Res Commun 381, 597–601. [DOI] [PubMed] [Google Scholar]
- 14. Shi B, Guo Y, Wang J and Gao W (2010) Altered expression of microRNAs in the myocardium of rats with acute myocardial infarction. BMC Cardiovasc Disord 10, 11. [DOI] [PMC free article] [PubMed] [Google Scholar]
- 15. Deleon‐Pennell KY, Altara R, Yabluchanskiy A, Modesti A, Lindsey ML (2015) The circular relationship between matrix metalloproteinase‐9 and inflammation following myocardial infarction. IUBMB Life 67, 611–618. [DOI] [PMC free article] [PubMed] [Google Scholar]
- 16. Alpert JS, Thygesen K, Antman E and Bassand JP (2000) Myocardial infarction redefined – A consensus document of The Joint European Society of Cardiology/American College of Cardiology Committee for the Redefinition of Myocardial Infarction Eur Heart J 2000 21 1502 1513 10973764. J Am Coll Cardiol 36, 959–969. [DOI] [PubMed] [Google Scholar]
- 17. Luchner A, Hengstenberg C, Lowel H, Trawinski J, Baumann M, Riegger GA, Schunkert H and Holmer S (2002) N‐terminal pro‐brain natriuretic peptide after myocardial infarction: a marker of cardio‐renal function. Hypertension 39, 99–104. [DOI] [PubMed] [Google Scholar]
- 18. de Winter RJ, Koster RW, Sturk A and Sanders GT (1995) Value of myoglobin, troponin T, and CK‐MBmass in ruling out an acute myocardial infarction in the emergency room. Circulation 92, 3401–3407. [DOI] [PubMed] [Google Scholar]
- 19. Wang GK, Zhu JQ, Zhang JT, Li Q, Li Y, He J, Qin YW and Jing Q (2010) Circulating microRNA: a novel potential biomarker for early diagnosis of acute myocardial infarction in humans. Eur Heart J 31, 659–666. [DOI] [PubMed] [Google Scholar]
- 20. Long G, Wang F, Duan Q, Chen F, Yang S, Gong W, Wang Y, Chen C and Wang DW (2012) Human circulating microRNA‐1 and microRNA‐126 as potential novel indicators for acute myocardial infarction. Int J Biol Sci 8, 811–818. [DOI] [PMC free article] [PubMed] [Google Scholar]
- 21. Yao XL, Lu XL, Yan CY, Wan QL, Cheng GC and Li YM (2015) Circulating miR‐122‐5p as a potential novel biomarker for diagnosis of acute myocardial infarction. Int J Clin Exp Pathol 8, 16014–16019. [PMC free article] [PubMed] [Google Scholar]
- 22. Zhong J, He Y, Chen W, Shui X, Chen C and Lei W (2014) Circulating microRNA‐19a as a potential novel biomarker for diagnosis of acute myocardial infarction. Int J Mol Sci 15, 20355–20364. [DOI] [PMC free article] [PubMed] [Google Scholar]
- 23. Marot G, Foulley JL, Mayer CD and Jaffrezic F (2009) Moderated effect size and P‐value combinations for microarray meta‐analyses. Bioinformatics 25, 2692–2699. [DOI] [PubMed] [Google Scholar]
- 24. Reiner‐Benaim A (2007) FDR control by the BH procedure for two‐sided correlated tests with implications to gene expression data analysis. Biom J 49, 107–126. [DOI] [PubMed] [Google Scholar]
- 25. Benjamini Y and Hochberg Y (1995) Controlling the false discovery rate ‐ a practical and powerful approach to multiple testing. J Roy Stat Soc 57, 289–300. [Google Scholar]
- 26. Smoot ME, Ono K, Ruscheinski J, Wang PL and Ideker T (2011) Cytoscape 2.8: new features for data integration and network visualization. Bioinformatics 27, 431–432. [DOI] [PMC free article] [PubMed] [Google Scholar]
- 27. Huang CC, Lloyd‐Jones DM, Guo X, Rajamannan NM, Lin S, Du P, Huang Q, Hou L and Liu K (2011) Gene expression variation between African Americans and whites is associated with coronary artery calcification: the multiethnic study of atherosclerosis. Physiol Genomics 43, 836–843. [DOI] [PMC free article] [PubMed] [Google Scholar]
- 28. Zgheib C, Kurdi M, Zouein FA, Gunter BW, Stanley BA, Zgheib J, Romero DG, King SB, Paolocci N and Booz GW (2012) Acyloxy nitroso compounds inhibit LIF signaling in endothelial cells and cardiac myocytes: evidence that STAT3 signaling is redox‐sensitive. PLoS ONE 7, e43313. [DOI] [PMC free article] [PubMed] [Google Scholar]
- 29. Galindo CL, Skinner MA, Errami M, Olson LD, Watson DA, Li J, McCormick JF, McIver LJ, Kumar NM, Pham TQ et al (2009) Transcriptional profile of isoproterenol‐induced cardiomyopathy and comparison to exercise‐induced cardiac hypertrophy and human cardiac failure. BMC Physiol 9, 23. [DOI] [PMC free article] [PubMed] [Google Scholar]
- 30. Ladd AN, Taffet G, Hartley C, Kearney DL and Cooper TA (2005) Cardiac tissue‐specific repression of CELF activity disrupts alternative splicing and causes cardiomyopathy. Mol Cell Biol 25, 6267–6278. [DOI] [PMC free article] [PubMed] [Google Scholar]
- 31. Wang GS, Kearney DL, De Biasi M, Taffet G and Cooper TA (2007) Elevation of RNA‐binding protein CUGBP1 is an early event in an inducible heart‐specific mouse model of myotonic dystrophy. J Clin Invest 117, 2802–2811. [DOI] [PMC free article] [PubMed] [Google Scholar]
- 32. Schulte C and Zeller T (2015) microRNA‐based diagnostics and therapy in cardiovascular disease‐Summing up the facts. Cardiovasc Diagn Ther 5, 17–36. [DOI] [PMC free article] [PubMed] [Google Scholar]
- 33. Lavergne E, Labreuche J, Daoudi M, Debre P, Cambien F, Deterre P, Amarenco P and Combadiere C (2005) Adverse associations between CX3CR1 polymorphisms and risk of cardiovascular or cerebrovascular disease. Arterioscler Thromb Vasc Biol 25, 847–853. [DOI] [PubMed] [Google Scholar]
- 34. Romaine SP, Tomaszewski M, Condorelli G and Samani NJ (2015) MicroRNAs in cardiovascular disease: an introduction for clinicians. Heart 101, 921–928. [DOI] [PMC free article] [PubMed] [Google Scholar]
- 35. Devaux Y, Vausort M, McCann GP, Kelly D, Collignon O, Ng LL, Wagner DR and Squire IB (2013) A panel of 4 microRNAs facilitates the prediction of left ventricular contractility after acute myocardial infarction. PLoS ONE 8, e70644. [DOI] [PMC free article] [PubMed] [Google Scholar]
- 36. Maciejak A, Kiliszek M, Michalak M, Tulacz D, Opolski G, Matlak K, Dobrzycki S, Segiet A, Gora M and Burzynska B (2015) Gene expression profiling reveals potential prognostic biomarkers associated with the progression of heart failure. Genome Med 7, 26. [DOI] [PMC free article] [PubMed] [Google Scholar]
- 37. Kuiper RP, Schepens M, Thijssen J, Schoenmakers EF and van Kessel AG (2004) Regulation of the MiTF/TFE bHLH‐LZ transcription factors through restricted spatial expression and alternative splicing of functional domains. Nucleic Acids Res 32, 2315–2322. [DOI] [PMC free article] [PubMed] [Google Scholar]
- 38. Li H, Fan J, Yin Z, Wang F, Chen C and Wang DW (2016) Identification of cardiac‐related circulating microRNA profile in human chronic heart failure. Oncotarget 7, 33–45. [DOI] [PMC free article] [PubMed] [Google Scholar]
- 39. Qi Y, Xu Z, Zhu Q, Thomas C, Kumar R, Feng H, Dostal DE, White MF, Baker KM and Guo S (2013) Myocardial loss of IRS1 and IRS2 causes heart failure and is controlled by p38alpha MAPK during insulin resistance. Diabetes 62, 3887–3900. [DOI] [PMC free article] [PubMed] [Google Scholar]
- 40. Zawada AM, Rogacev KS, Hummel B, Grün OS, Friedrich A, Rotter B, Winter P, Geisel J, Fliser D and Heine GH (2012) SuperTAG methylation‐specific digital karyotyping reveals uremia‐induced epigenetic dysregulation of atherosclerosis‐related genes. Cir Cardiovasc Genet 5, 611. [DOI] [PubMed] [Google Scholar]
- 41. Zaccagnini G, Martelli F, Fasanaro P, Magenta A, Gaetano C, Di Carlo A, Biglioli P, Giorgio M, Martin‐Padura I, Pelicci PG et al (2004) p66ShcA modulates tissue response to hindlimb ischemia. Circulation 109, 2917–2923. [DOI] [PubMed] [Google Scholar]
- 42. Lee P, Sata M, Lefer DJ, Factor SM, Walsh K and Kitsis RN (2003) Fas pathway is a critical mediator of cardiac myocyte death and MI during ischemia‐reperfusion in vivo . Am J Physiol Heart Circ Physiol 284, H456–H463. [DOI] [PubMed] [Google Scholar]
- 43. Hitz MP, Lemieux‐Perreault LP, Marshall C, Feroz‐Zada Y, Davies R, Yang SW, Lionel AC, D'Amours G, Lemyre E, Cullum R et al (2012) Rare copy number variants contribute to congenital left‐sided heart disease. PLoS Genet 8, e1002903. [DOI] [PMC free article] [PubMed] [Google Scholar]
- 44. Deleon‐Pennell KY, Altara R, Yabluchanskiy A, Modesti A and Lindsey ML (2015) The circular relationship between matrix metalloproteinase‐9 and inflammation following myocardial infarction. IUBMB Life 67, 611–618. [DOI] [PMC free article] [PubMed] [Google Scholar]
- 45. Wang P, Haiying FU, Cui J and Chen X (2016) Differential lncRNA‐mRNA co‐expression network analysis revealing the potential regulatory roles of lncRNAs in myocardial infarction. Mol Med Rep 13, 1195. [DOI] [PMC free article] [PubMed] [Google Scholar]
- 46. Keshishian H, Burgess MW, Gillette MA, Mertins P, Clauser KR, Mani DR, Kuhn EW, Farrell LA, Gerszten RE and Carr SA (2015) Multiplexed, quantitative workflow for sensitive biomarker discovery in plasma yields novel candidates for early myocardial injury. Mol Cell Proteomics 14, 2375–2393. [DOI] [PMC free article] [PubMed] [Google Scholar]
- 47. Rouse J, Cohen P, Trigon S, Morange M, Alonso‐Llamazares A, Zamanillo D, Hunt T and Nebreda AR (1994) A novel kinase cascade triggered by stress and heat shock that stimulates MAPKAP kinase‐2 and phosphorylation of the small heat shock proteins. Cell 78, 1027–1037. [DOI] [PubMed] [Google Scholar]
- 48. Kotlo K, Johnson KR, Grillon JM, Geenen DL, deTombe P and Danziger RS (2012) Phosphoprotein abundance changes in hypertensive cardiac remodeling. J Proteomics 77, 1–13. [DOI] [PMC free article] [PubMed] [Google Scholar]
- 49. Peng L, Chun‐guang Q, Bei‐fang L, Xue‐zhi D, Zi‐hao W, Yun‐fu L, Yan‐ping D, Yang‐gui L, Wei‐guo L, Tian‐yong H et al (2014) Clinical impact of circulating miR‐133, miR‐1291 and miR‐663b in plasma of patients with acute myocardial infarction. Diagn Pathol 9, 89. [DOI] [PMC free article] [PubMed] [Google Scholar]
- 50. Skommer J, Rana I, Marques FZ, Zhu W, Du Z and Charchar FJ (2014) Small molecules, big effects: the role of microRNAs in regulation of cardiomyocyte death. Cell Death Dis 5, e1325. [DOI] [PMC free article] [PubMed] [Google Scholar]
- 51. Garikipati VN, Krishnamurthy P, Verma SK, Khan M, Abramova T, Mackie AR, Qin G, Benedict C, Nickoloff E, Johnson J et al (2015) Negative regulation of miR‐375 by interleukin‐10 enhances bone marrow‐derived progenitor cell‐mediated myocardial repair and function after myocardial infarction. Stem Cells 33, 3519–3529. [DOI] [PMC free article] [PubMed] [Google Scholar]
- 52. D'Alessandra Y, Devanna P, Limana F, Straino S, Di Carlo A, Brambilla PG, Rubino M, Carena MC, Spazzafumo L, De Simone M et al (2010) Circulating microRNAs are new and sensitive biomarkers of myocardial infarction. Eur Heart J 31, 2765–2773. [DOI] [PMC free article] [PubMed] [Google Scholar]
Associated Data
This section collects any data citations, data availability statements, or supplementary materials included in this article.
Supplementary Materials
Table S1. All differentially expressed genes.


