

Abstract
Background
Reducing leakage to outside specialists has been promoted as a key strategy for accountable care organizations (ACOs). Many specialty referrals are thought to be unnecessary, and ACOs that leak the most specialty care (primary care groups) have the strongest incentives to reduce specialty care.
Objective
To examine changes in specialty care leakage and use associated with the Medicare Shared Savings Program (MSSP).
Design
Analyses of trends in ACOs from 2010-2014 and quasi-experimental difference-in-difference analyses comparing changes for ACOs vs. local non-ACO providers from before to after the start of ACO contracts, stratified by ACO specialty composition and year of MSSP entry.
Setting
Fee-for-service Medicare.
Patients
20% sample of beneficiaries attributed to ACOs or non-ACO providers.
Measurements
The main beneficiary-level outcome was the annual count of new specialist visits. ACO-level outcomes included the proportion of visits for ACO-attributed patients outside of the ACO (leakage) and proportion of ACO Medicare outpatient revenue devoted to ACO-attributed patients (contract penetration).
Results
Leakage of specialist visits decreased minimally from 2010–2014 among ACOs. Contract penetration also changed minimally but differed substantially by specialty composition (85% for the most primary care-oriented quartile vs. 47% for the most specialty-oriented quartile). For the most primary care-oriented quartile of ACOs in 2 of 3 entry cohorts, MSSP participation was associated with differential reductions in new specialist visits (−0.04 visits/beneficiary in 2014 for the 2012 cohort, or −5.4%; p<0.001). For more specialty-oriented ACOs, differential changes in specialist visits were not statistically significant.
Limitation
Inability to assess clinical appropriateness of specialty visits from claims data.
Conclusions
Leakage of specialty care changed minimally in the MSSP, suggesting ineffective efforts to reduce leakage. MSSP participation was associated with decreases in new specialty visits among primary care-oriented ACOs.
Primary Funding Source
National Institute on Aging of the National Institutes of Health (P01 AG032952) and from the Laura and John Arnold Foundation.
In the Medicare accountable care organization (ACO) programs, provider organizations have incentives to reduce spending and improve quality of care.(1) Specifically, providers share in savings with Medicare if they keep spending for an attributed population of beneficiaries sufficiently below a financial benchmark, with greater shares given to providers performing better on a set of quality measures.
Although ACOs have incentives to lower spending by any means, ACO descriptions and efforts have largely focused on care coordination and management as primary strategies for quality improvement and savings.(1–7) Accordingly, many ACOs have tried to establish control over the full continuum of patients’ care by leveraging ownership structures that encompass primary, specialty, and inpatient care and by minimizing the proportion of care that their patients receive from other providers—commonly called leakage. A sizable industry has grown offering products specifically to help ACOs reduce leakage, in particular by controlling specialty referrals,(8–10) and many ACOs in the Medicare Shared Savings Program (MSSP) have cited leakage reduction as the key to ACO success.(11,12) Limiting leakage may be challenging in the Medicare ACO model because ACO-attributed beneficiaries continue to have unrestricted choice of providers. Whether specialty care leakage has been reduced in ACOs has not been described. ACOs that consist mostly or entirely of primary care providers (PCPs) leak all or almost all specialty care by construction but have successfully lowered Medicare spending as much as or more than other ACOs have, on average.(13) Although these primary care-oriented ACOs cannot provide the full continuum of care, they have stronger incentives than other ACOs to reduce the use of specialty care because shared-savings bonuses from reducing use of specialty services are not offset by foregone fee-for-service profits from providing less specialty care. Because many specialty referrals are thought to be unnecessary and lead to significant downstream spending, they may be a natural focus for cost-cutting efforts by primary care-oriented ACOs.(14–16) Primary care-oriented ACOs also have stronger incentives than more specialty-oriented ACOs to implement system changes that affect all of their patients, because higher shares of their revenue are covered by ACO contracts (i.e., they have higher ACO contract penetration).(17,18)
In contrast, large multispecialty ACOs provide specialty care to many patients who are not covered by the organization’s ACO contracts and would incur substantial fee-for-service losses from systematically reducing referrals to specialists. Likewise, specialty-oriented ACOs may seek to contain leakage to boost fee-for-service revenue for specialty services, rather than to coordinate care, particularly as competing organizations seek to internalize their own referrals or steer patients to lower-priced specialists.
Thus, an ACO’s specialty composition is likely a major determinant of the incentives it faces and the strategies it takes. Using Medicare claims from 2010-2014, we examined trends in leakage of specialty care and contract penetration among ACOs in the MSSP, with a focus on specialty-oriented ACOs to determine if their efforts to redirect patient referrals have been associated with changes in patient care patterns and contract incentives. We also assessed changes in the use of specialist visits associated with MSSP participation, comparing these changes between primary care-oriented vs. more specialty-oriented ACOs.
METHODS
Study Data and Population
We analyzed Medicare claims and enrollment data from 2010-2014 for a random 20% sample of fee-for-service Medicare beneficiaries. For each year, we included beneficiaries who were continuously enrolled in Parts A and B of fee-for-service Medicare in that year (while alive for decedents) and in the prior year.
To examine ACOs entering the MSSP in 2012, 2013, and 2014 (335 ACOs in total), we used the ACO provider-level research identifiable files from the Center for Medicare and Medicaid Services (CMS), which define ACOs as collections of provider taxpayer identification numbers and CMS Certification Numbers (for safety-net providers) and list national provider identifiers for participating physicians as well. Using previously described methods, we attributed each beneficiary in each study year to the ACO or non-ACO taxpayer identification number accounting for the most allowed charges for qualifying outpatient evaluation and management services delivered to the beneficiary by a primary care physician during the year.(13) We limited qualifying services to office visits with primary care physicians, because many ACOs include no or few specialty practices.(13) Beneficiaries with no office visits with a primary care physician were excluded.
Study Variables
ACO Specialty Mix
We assessed the proportion of physicians in each ACO’s set of contract participants (contracting network) that were in primary care specialties (internal medicine, family medicine, general practice, and geriatrics) vs. all other specialties (specialists). We assessed physicians’ primary specialty from specialty codes in Medicare claims. We categorized ACOs into quartiles based on the proportion of ACO physicians who were specialists.
Outpatient Specialty Visits and Associated Diagnoses
For each beneficiary in each year, we assessed the total number of outpatient specialist visits, defined as Current Procedural Terminology (CPT) codes 99201-99205 (new patient visits) or 99211-99215 (established visits) with physicians in non-primary care specialties. As our primary outcome, we focused specifically on new specialist visits because ACOs may be able to curtail use of specialty care or steer patients to different practices more easily when specialty care is first initiated. For ACO-attributed patients, we additionally categorized specialist visits as occurring inside the patient’s ACO if provided by the ACO’s contracting network vs. outside the ACO if not. We also examined the most common primary diagnoses for new specialist visits among ACOs in 2014 to examine patterns of specialty care needs for ACOs.
Contract Penetration
To measure contract penetration for each ACO annually, we first summed annual spending, including coinsurance amounts, for all services delivered in outpatient settings that were billed by an ACO’s set of participating practices. We then calculated the proportion of this spending that was devoted to beneficiaries assigned to the ACO as opposed to other beneficiaries receiving outpatient care from the ACO.
Leakage of Specialty Visits
For each ACO in each year, we calculated the percentage of all outpatient specialty visits provided to beneficiaries attributed to the ACO that were not provided by the ACO’s contracting network.
Stability of Beneficiary Attribution
Because ACO efforts to contain leakage and engage patients may result in attributed populations that are more stable over time, for each year we also assessed the proportion of beneficiaries attributed to each ACO who had been attributed to the same ACO in the previous year.
Patient Covariates
From Medicare Master Beneficiary Summary Files, we assessed the age, sex, race or ethnic group, and Medicaid coverage of beneficiaries, as well as whether disability was the original reason for their Medicare eligibility and whether they had end-stage renal disease.(19) From the Chronic Conditions Data Warehouse (CCW), which draws from diagnoses since 1999 to describe beneficiaries’ accumulated disease burden, we assessed whether beneficiaries had any of 27 conditions in the CCW by the start of each study year.(20) From diagnoses in the preceding year of claims, we also calculated a Hierarchical Condition Category risk score for each beneficiary in each study year.(21) We determined whether beneficiaries were long-term nursing home residents using a validated claims-based algorithm.(22) Finally, from U.S. Census data, we assessed area-level sociodemographic characteristics.(23)
Statistical Analysis
We conducted two sets of analyses, one a set of descriptive analyses among ACO-attributed beneficiaries and the other a set of quasi-experimental analyses that also included beneficiaries attributed to non-ACO providers as a control group. The purpose of the descriptive analyses was to characterize trends in leakage, contract penetration, and stability of attribution from 2010-2014 among ACO-attributed beneficiaries. For analyses of leakage, we focused on the most specialty-oriented ACOs (those with proportions of specialists in the top quartile among ACOs) to characterize levels and trends among ACOs with the greatest opportunity for limiting leakage. In the extreme, ACOs composed entirely of primary care physicians leak 100% of specialty care, therefore examining trends in leakage for such ACOs would be uninformative. We conducted complementary analyses of trends in use of specialist visits inside vs. outside ACOs to describe the source of any changes in leakage. For contract penetration, we stratified ACOs by quartile of specialty-orientation to describe how levels and trends varied across the full spectrum of specialty mix. To determine if changes in care patterns might be due to changes in population of beneficiaries attributed to ACOs, we examined the characteristics of ACO-attributed patients over time.
In our second set of analyses, we used linear regression and a difference-in-differences approach to estimate changes in use of specialist office visits from the pre-contract to post-contract period that differed from concurrent changes in the control group of beneficiaries attributed to non-ACO practices. The regression models adjusted for all patient characteristics, fixed effects for each HRR by year combination to compare ACO-attributed beneficiaries with beneficiaries in the control group living in the same area and to adjust for concurrent regional changes in use of specialist visits occurring in the control group. Models also included fixed effects for each ACO to adjust for pre-contract differences between ACOs and the control group and for any changes in the distribution of ACO-attributed beneficiaries across ACOs over the study period. Thus, this analysis compared utilization in the post-contract period for ACO-attributed patients with utilization that would be expected in the absence of ACO contracts, using local changes in a similar population to establish that counterfactual scenario.
We estimated effects separately for each entry cohort of ACOs, allowing each cohort to have a different pre-contract period (2010-2011 for the 2012 entry cohort, 2010-2012 for the 2013 cohort, and 2010-2013 for the 2014 cohort). We used robust variance estimators to account for clustering of beneficiaries within ACOs (for the ACO group) or HRRs (for the control group). Because ACOs with the fewest specialists have the strongest financial incentives to reduce use of specialty care by their attributed beneficiaries, we estimated effects of MSSP participation separately for ACOs in the lowest quartile of specialty orientation (the most primary care-oriented) vs. all other ACOs by adding interaction terms to difference-in-difference models.
To assess for potential selection bias in our difference-in-differences analyses, we compared trends in use of specialist visits between the ACO and control groups during the pre-contract period to check if trends were already diverging or converging. We also tested whether patients’ sociodemographic and clinical characteristics differentially changed from the pre-contract to post-contract period in the ACO group relative to the control group.
RESULTS
Patterns of Outpatient Care Among ACOs
The characteristics of patients attributed to ACOs were stable over the study period, with minimal changes in each MSSP cohort from before to after the start of ACO contracts (Table 1). The 25 most common primary diagnoses for new specialist visits in all MSSP cohorts in 2014 prominently featured musculoskeletal problems (limb, joint and back pain), common skin conditions (nail dermatophytosis, seborrheic keratosis) and diagnoses often managed primarily by PCPs (hypertension, diabetes mellitus) (Appendix Table 1).
Table 1.
Characteristics of ACO Patients in Year before MSSP Entry and 2014, by MSSP Cohort
| MSSP 2012 cohort | MSSP 2013 cohort | MSSP 2014 cohort | ||||
|---|---|---|---|---|---|---|
| Patient characteristic | Pre-MSSP Year (2011) | 2014 | Pre-MSSP Year (2012) | 2014 | Pre-MSSP Year (2013) | 2014 |
| Mean age, y | 71.7 | 71.6 | 71.8 | 71.8 | 70.9 | 70.9 |
| Female sex, % | 58.4 | 57.6 | 57.3 | 56.7 | 57.9 | 57.6 |
| Race/ethnicity, % | ||||||
| White | 82.2 | 81.4 | 81.5 | 80.9 | 82.2 | 82.0 |
| Black | 8.2 | 8.3 | 8.1 | 8.2 | 9.3 | 9.1 |
| Hispanic | 5.1 | 5.3 | 6.2 | 6.2 | 5.1 | 5.1 |
| Other | 4.4 | 5.0 | 4.2 | 4.7 | 3.4 | 3.7 |
| Medicaid, full or partial dual1,% | 21.3 | 20.6 | 19.6 | 18.6 | 21.4 | 20.9 |
| Disabled,2 % | 23.2 | 23.7 | 22.4 | 22.2 | 25.8 | 25.6 |
| End-stage renal disease, % | 1.1 | 1.2 | 1.0 | 1.1 | 1.2 | 1.2 |
| Nursing-home resident, prior year, % | 1.7 | 1.4 | 1.4 | 1.3 | 1.6 | 1.6 |
| ZCTA-level characteristics, mean | ||||||
| % below FPL | 9.1 | 9.1 | 9.2 | 9.1 | 8.8 | 8.7 |
| % with high school degree | 75.7 | 75.8 | 75.6 | 75.7 | 76.0 | 76.1 |
| % with college degree | 19.2 | 19.2 | 18.7 | 18.9 | 19.1 | 19.2 |
| CCW conditions3 | ||||||
| Total no., mean | 5.81 | 5.94 | 5.90 | 5.97 | 5.87 | 5.87 |
| ≥6 conditions, % | 50.2 | 51.5 | 51.1 | 51.8 | 49.9 | 49.8 |
| ≥9 conditions, % | 20.9 | 22.7 | 21.5 | 22.5 | 22.2 | 22.4 |
| HCC risk score4, mean | 1.25 | 1.26 | 1.25 | 1.26 | 1.27 | 1.27 |
Abbreviations: Accountable care organization (ACO), Chronic Condition Warehouse (CCW), Hierarchical Condition Categories (HCC), Medicare Shared Savings Program (MSSP), ZIP Code tabulation area (ZCTA)
Means adjusted for the beneficiary’s HRR of residence and the ACO to which the beneficiary was attributed to hold constant over time the distribution of ACO-attributed beneficiaries across areas and ACOs.
Medicare and Medicaid dual eligibility defined as “full” or “partial” dual status using the “dual status” variable values 1-5, 6 and 8 as defined by CMS (https://www.resdac.org/cms-data/variables/Dual-Status-Code-occurs-12-times)
Indicates that disability was the original reason for Medicare eligibility
Chronic conditions from the Chronic Conditions Data Warehouse (CCW) included 27 conditions: acute myocardial infarction, Alzheimer’s disease, Alzheimer’s disease and related disorders or senile dementia, anemia, asthma, atrial fibrillation, benign prostatic hyperplasia, chronic kidney disease, chronic obstructive pulmonary disease, depression, diabetes, heart failure, hip/pelvic fracture, hyperlipidemia, hypertension, hypothyroidism, ischemic heart disease, osteoporosis, rheumatoid arthritis/osteoarthritis, stroke/transient ischemic attack, breast cancer, colorectal cancer, endometrial cancer, lung cancer, prostate cancer, cataracts, and glaucoma. Indicators for all 27 conditions were included in models. Counts of conditions included all conditions except cataracts and glaucoma.
Hierarchical Condition Categories (HCC) risk scores are derived from demographic and diagnostic data in Medicare enrollment and claims files, with higher scores indicating higher predicted spending in the subsequent year. For each beneficiary in each study year, we assessed the HCC score based on enrollment and claims data in the prior year.
Contract penetration varied widely by ACO specialty orientation but changed minimally over time (Figure 1). In the 2012 MSSP entry cohort of ACOs for example, contract penetration ranged from 47% in 2014 for the most specialty-oriented quartile of ACOs to 85% for the least specialty-oriented quartile. Thus, for ACOs composed entirely or almost entirely of PCPs, MSSP contracts covered a high proportion of Medicare revenue for outpatient care.
Figure 1.
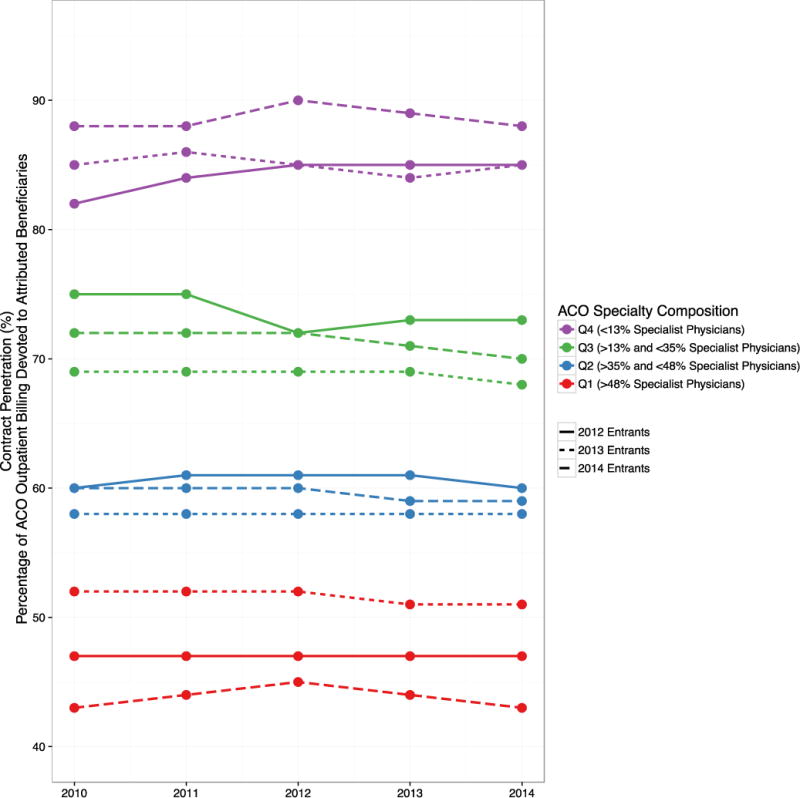
Trends in Contract Penetration, by ACO Specialty Orientation and MSSP Entry Cohort
Abbreviations: Accountable care organization (ACO), Medicare Shared Savings Program (MSSP), ACO specialty orientation quartiles 1-4 (Q1-Q4).
Trends in contract penetration in each MSSP cohort (2012 entrants, solid line; 2013 entrants, dotted line; 2014 entrants, dashed line) are shown for ACOs stratified by their quartile of specialty orientation (quartile 1 [highest specialty orientation] in purple; quartile 2 in green; quartile 3 in blue and quartile 4 [lowest specialty orientation] in red).
Even in the most specialty-oriented quartile of ACOs, leakage of specialist visits outside of ACO contracting networks was high, ranging from 61-72% depending on the year and MSSP cohort (Figure 2). From 2010-2014, leakage decreased slightly in two MSSP cohorts, from 70% to 68% in the 2012 entrants and from 64% to 61% in the 2013 entrants. These changes were driven primarily by rising use of specialist visits within ACOs without concurrent decreases in use of specialist visits outside of ACOs, such that total use of specialist visits rose slightly for ACO-attributed patients over the study period (Figure 2).
Figure 2.
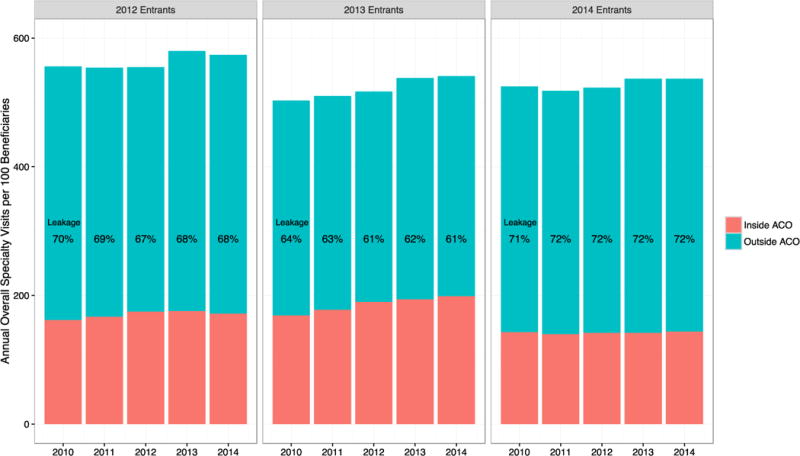
Unadjusted Rates and Leakage of Overall Specialty Visit Use Among Most Specialty-Oriented ACOs
Abbreviations: Accountable care organization (ACO), Medicare Shared Savings Program (MSSP).
Trends in unadjusted new specialist visit rates per 100 beneficiaries in each MSSP cohort are shown for ACOs with the highest specialty orientation with >48% specialist physicians in their contract (1st [highest] quartile of specialty orientation), broken down into inside ACO visits (orange) and outside ACO visits (blue). “Leakage” is defined as the proportion of inside ACO visits over all new specialty visits in a given year.
For new specialist visits, trends in leakage were similar except that modest reductions in leakage occurred in all three MSSP cohorts (Figure 3). The largest decline in leakage of new specialist visits occurred in the 2013 cohort, from 66% in 2010 to 62% in 2014. As with total specialist visits, reductions in leakage of new specialist visits were largely driven by increased use inside of ACOs.
Figure 3.
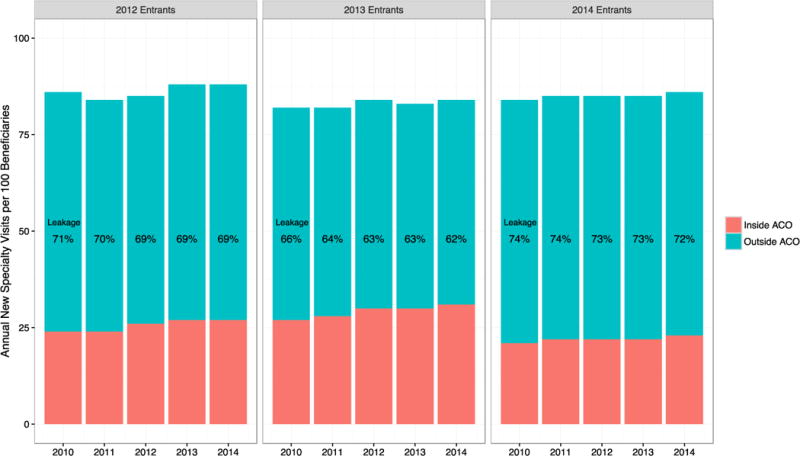
Unadjusted Rates and Leakage of New Specialty Visits Among the Most Specialty-oriented ACOs
Abbreviations: Accountable care organization (ACO), Medicare Shared Savings Program (MSSP)
Trends in unadjusted overall specialist visit rates per 100 beneficiaries in each MSSP cohort are shown for ACOs with the highest specialty orientation with >48% specialist physicians in their contract (1st [highest] quartile of specialty orientation), broken down into inside ACO visits (orange) and outside ACO visits (blue). “Leakage” is defined as the proportion of inside ACO visits over all overall specialty visits in a given year.
For both overall specialist visit use and new specialist visit use, the modest reductions in leakage began prior to entry into the MSSP, without clear acceleration after entry (Figure 2). Rates of leakage were higher for ACOs with lower proportions of specialists but trends were generally similar (Appendix Figures 1-4).
Stability of beneficiary attribution to ACOs changed minimally across all three MSSP cohorts (Appendix Table 2). For example, in the 2012 cohort of ACOs, the average proportion of beneficiaries who were assigned to the same ACO as in the previous year was 77.2% in 2010 and 75.3% in 2014.
Association Between MSSP Participation and Changes in Use of Specialist Visits
Tests of key assumptions supported inferences from difference-in-differences analyses. For each MSSP cohort, the characteristics of attributed patients changed minimally relative to the control group (Appendix Tables 3-5). In the pre-contract period, rates of specialist visit use were generally similar between the MSSP ACO cohorts and the control group, with some small statistically significant differences, and pre-contract annual trends in specialist visit use differed minimally between the ACO and control groups (Appendix Table 6).
For the most primary care-oriented quartile of ACOs in the 2012 entry cohort (<13% specialists), MSSP participation was associated with a significant reduction in overall annual use of specialist visits (differential change: −0.10 visits/beneficiary or −2.1% of the pre-contract mean of 4.77 visits/beneficiary; p=0.002) and a more prominent differential reduction in annual use of new specialist visits (−0.037 visits/beneficiary or −5.0% of the pre-contract mean of 0.746 visits/beneficiary; p<0.001) (Table 2). These reductions grew over time from 2013 to 2014 (Appendix Table 7). In contrast, differential changes in use of specialist visits were small and not statistically significant in the 2012 cohort for other ACOs with more specialists.
Table 2.
Differential Changes in Annual Specialty Visit Rates from the Pre- to Post-Contract Periods for ACOs vs. Control Group, by ACO Specialty Orientation
| Mean annual rates of specialist visits per beneficiary | |||||
|---|---|---|---|---|---|
| Utilization measure | Unadj. pre-contract mean | Differential change from pre-contract period to 2014 for ACO vs. control group | Difference in differential changes | ||
| 2012 MSSP Cohort | |||||
| All specialist visits, no. | Average Change [95% CI] | p-value | Average Change [95% CI] | p-value | |
| Primary care-oriented ACOs (<13% specialists) |
4.77 | −0.10 [−0.16, −0.04] |
0.002 | −0.05 [−0.13, 0.04] |
0.32 |
| Other ACOs (13-76% specialists) |
5.31 | −0.05 [−0.12, 0.01] |
0.11 | Ref | – |
| New specialist visits, no. | |||||
| Primary care-oriented ACOs (<13% specialists) |
0.746 | −0.037 [−0.051, −0.024] |
<.001 | −0.030 [−0.046, −0.015] |
<.001 |
| Other ACOs (13-76% specialists) |
0.807 | −0.007 [−0.015, 0.001] |
0.09 | Ref | – |
| 2013 MSSP Cohort | |||||
| All specialist visits, no. | |||||
| Primary care-oriented ACOs (<13% specialists) |
5.15 | −0.03 [−0.09, 0.03] |
0.36 | −0.08 [−0.16, 0.00] |
0.05 |
| Other ACOs (13-76% specialists) |
4.95 | 0.05 [0.00, 0.11] |
0.07 | Ref | – |
| New specialist visits, no. | |||||
| Primary care-oriented ACOs (<13% specialists) |
0.777 | −0.009 [−0.019, 0.002] |
0.12 | −0.011 [−0.027, 0.005] |
0.19 |
| Other ACOs (13-76% specialists) |
0.781 | 0.002 [−0.010, 0.014] |
0.73 | Ref | – |
| 2014 MSSP Cohort | |||||
| All specialist visits, no. | |||||
| Primary care-oriented ACOs (<13% specialists) |
4.83 | 0.00 [−0.06, 0.06] |
0.97 | 0.01 [−0.06, 0.08] |
0.84 |
| Other ACOs (13-76% specialists) |
5.15 | −0.01 [−0.05, 0.03] |
0.653 | Ref | – |
| New specialist visits, no. | |||||
| Primary care-oriented ACOs (<13% specialists) |
0.749 | −0.023 [−0.032, −0.013] |
<.001 | −0.027 [−0.039, −0.014] |
<.001 |
| Other ACOs (13-76% specialists) |
0.798 | 0.004 [−0.004, 0.012] |
0.31 | Ref | – |
Abbreviations: Accountable care organization (ACO), confidence interval (CI), hospital referral region (HRR), Medicare Shared Savings Program (MSSP)
Pre-contract means are shown for all groups (2010-2011 for the 2012 entry cohort, 2010-2012 for the 2013 cohort, and 2010-2013 for the 2014 cohort). Differences in ACO vs. control group trends estimated using linear regression adjusting for all characteristics in Table 1, HRR by year and ACO fixed effects and year fixed effects. All standard errors are clustered at the ACO organization level for ACO-assigned beneficiaries and at the HRR level for the control group. Difference in differential trends estimate the difference-in-difference estimates between primary-care oriented and specialty-oriented ACOs.
In the 2014 cohort, MSSP participation was similarly associated with a differential reduction in use of new specialty visits for primary care-oriented ACOs (−0.023 visits/beneficiary or −3.1% of the pre-contract mean, P<0.001) but not for other, more specialty-oriented ACOs (Table 2). In the 2013 cohort, MSSP participation was associated with modest differential decreases in use of new specialist visits and all specialist visits for primary care-oriented ACOs and with modest differential increases in use for other ACOs, but these differential changes were not statistically significant.
DISCUSSION
In this study of ACOs in the MSSP, leakage of outpatient specialty care decreased slightly in specialty-oriented ACOs over the 2010-2014 period. These small reductions began prior to MSSP entry, however, suggesting that efforts to internalize specialty referrals may have been initiated to increase fee-for-service revenue rather than to better coordinate care in response to ACO contract incentives, though we could not rule out anticipatory positioning by providers expecting to enter the MSSP. Lower rates of leakage could have also been due to expanding specialty capacity among organizations entering the MSSP.(24) Regardless of their cause, the reductions were minimal, particularly during years of MSSP participation, suggesting limited effectiveness of efforts to contain specialty care within ACOs.
For primary-care oriented ACOs, which leak all or almost all specialty care by definition, MSSP participation was consistently associated with decreases in use of specialist visits, ranging from small decreases that were not statistically significant to reductions as large as 5% by 2014 in the case of new specialist visits for patients of the earliest MSSP entrants. In contrast, MSSP participation was not associated with changes in total use of specialist visits or use of new specialist visits for patients of other ACOs with more specialists. These findings are consistent with the stronger incentives that primary care groups have to reduce use of specialty care, as well as with greater effects of ACO efforts to curb use on new specialist visits than on established care with specialists. The greater reductions in specialist visit use among primary care-oriented ACOs challenge the notion that providing the full spectrum of care and containing leakage are keys to achieving more efficient care.
We also found that contract penetration was much lower for specialty-oriented ACOs than for primary care-oriented ACOs and did not change with exposure to ACO incentives. In isolation, reducing leakage should increase the proportion of ACOs’ outpatient revenue devoted to attributed patients, but the decreases in leakage were likely too small to have a measurable impact on contract penetration. The much lower contract penetration among specialty-oriented ACOs makes for much weaker incentives to implement system changes that affect all patients served, particularly when ACO contracts are not established with all payers.(17,18) A lack of such systemic strategies may have contributed to the minimal reductions in specialist visits observed among more specialty-oriented ACOs, though we could not observe specific strategies taken by ACOs. Examples of systemic strategies that ACOs might pursue to limit specialty referrals include physician profiling with feedback on referral patterns, training PCPs to accommodate more of patients’ needs without referral, decision support systems requiring justification for referrals, and creating e-consult systems to obviate the need for some referrals.
For specialty-oriented organizations with a Medicare ACO contract but no or few commercial ACO contracts, serious investment in such strategies would not be financially attractive because they could substantially erode fee-for-service revenue from specialty care for non-ACO commercially insured patients, whereas primary care-oriented would not incur losses from such spillover effects.(18,25) Even when specialty-oriented organizations risk contract with all payers, their low contract penetration means they would still have weak incentives to implement changes that would systematically reduce the intensity of specialty care for patients referred by other providers. The lack of change in contract penetration suggests that weak incentives for systemic reductions in specialty services may be an intractable feature of many specialty-oriented organizations, the most specialty-heavy of which provide over half of their outpatient care in Medicare to non-ACO patients, our findings suggest.
Finally, we found that ACO efforts to engage patients in ACO objectives, through care management programs for example, have not been associated with more stable attribution of beneficiaries to ACOs. Thus, churn in ACOs’ attributed population—with nearly 25% of an ACO’s attributed patients entering or exiting in a given year—continues to diminish possible returns from patient-specific investments, such as improving blood pressure control, teaching self-management of glycemic control, or correcting inappropriately costly care-seeking behavior.
Our study has several limitations. First, we were unable to assess the clinical appropriateness of specialty visits from claims data. However, the primary diagnoses associated with new specialist visits included many conditions that could be managed without involvement of a specialist. Second, our analyses of leakage, contract penetration, and stability of attribution do not support causal inferences about the effects of the MSSP because they were limited to ACOs. Nevertheless, trends in these measures are important because they characterize the direction in which ACOs’ incentives and provision of specialty care are moving.
Third, because the ACO programs are voluntary, participating providers might differ from other providers in ways related to trends in specialty care, thereby offering alternative explanations for findings from our difference-in-differences analyses that are unrelated to MSSP incentives. However, trends in specialist visit use differed minimally between ACO-attributed beneficiaries and the control group in the pre-contract period.
Third, we relied on CMS data describing the providers participating in each ACO contract, but organizations participating in the MSSP may own or be closely affiliated with practices not included in their list of participants.(17) Although we therefore overestimated leakage to some extent, our analysis of leakage focused on changes over time rather than levels of leakage and supported similar conclusions when limited to the most specialty-oriented ACOs.
Conclusion
Our study has important implications for ACO policy in Medicare and delivery system transformation more generally. First, the Medicare ACO model—in which attributed patients have unrestricted choice of providers—likely needs additional features to support patient engagement and control over where patients receive care,(26) such as Medigap plans with networks focused on ACO providers and higher copays for non-ACO providers.(27) To foster patient engagement with a specific ACO may also require a mechanism to share ACO savings with patients.(28)
Second, our findings suggest that continued provider consolidation into larger multispecialty organizations may need to be slowed or reversed to better align incentives under ACO models with system changes by providers. The wide gulf in contract penetration between primary care-oriented and specialty-oriented ACOs suggests that efforts to engage patients and limit leakage would have to have an enormous impact on care patterns to achieve the same change in incentives as a change in organizational structure.
Many strategies that have been promoted as keys to ACO success take the structure of the delivery system as a given, whereas reorganization of the delivery system may be necessary to achieve the goals of ACO-like payment models. A need to redesign the delivery system to support new payment models may not be surprising given that the structure of the current delivery system has evolved in response to fee-for-service payment.
Supplementary Material
Acknowledgments
Supported by grants from the National Institute on Aging of the National Institutes of Health (P01 AG032952) and from the Laura and John Arnold Foundation.
Contributor Information
Michael L. Barnett, Department of Health Policy and Management, Harvard T. H. Chan School of Public Health, Boston, Massachusetts; Division of General Internal Medicine and Primary Care, Department of Medicine, Brigham and Women’s Hospital, Boston, Massachusetts.
J. Michael McWilliams, Department of Health Care Policy, Harvard Medical School, Boston, Massachusetts; Division of General Internal Medicine and Primary Care, Department of Medicine, Brigham and Women’s Hospital, Boston, Massachusetts.
References
- 1.Centers for Medicare and Medicaid Services. ACO Overview [Internet] 2015 [cited 2016 Nov 30]. Available from: https://www.cms.gov/Medicare/Medicare-Fee-for-Service-Payment/ACO/index.html?redirect=/Aco.
- 2.Press MJ, Michelow MD, MacPhail LH. Care coordination in accountable care organizations: moving beyond structure and incentives. Am J Manag Care. 2012 Dec;18(12):778–80. [PubMed] [Google Scholar]
- 3.Accountable Care Organizations. Medicaregov [Internet] [cited 2016 Dec 15]. Available from: https://www.medicare.gov/manage-your-health/coordinating-your-care/accountable-care-organizations.html.
- 4.HealthITInteroperability. Care Coordination Paramount as New ACO Models Roll Out [Internet] HealthITInteroperability; 2016. [cited 2016 Dec 15]. Available from: http://healthitinteroperability.com/news/care-coordination-paramount-as-new-aco-models-roll-out. [Google Scholar]
- 5.Care Coordination. Actionable Analytics Help Monarch HealthCare Achieve Pioneer ACO Savings [Internet] [cited 2016 Dec 5]. Available from: https://www.optum.com/resources/library/care-coordination-actionable-analytics.html.
- 6.No ACOs without coordination [Internet] Healthcare IT News. :2015. [cited 2016 Dec 15]. Available from: http://www.healthcareitnews.com/news/no-acos-without-coordination.
- 7.Department of Health and Human Services. New Report Details Impact of the Affordable Care Act [Internet] HHS.gov. 2016 [cited 2016 Dec 14]. Available from: https://www.hhs.gov/about/news/2016/12/13/new-report-details-impact-affordable-care-act.html.
- 8.Leakage and Referrals Explorer [Internet] Health Catalyst. [cited 2016 Dec 15]. Available from: https://www.healthcatalyst.com/product/leakage-and-referrals/
- 9.Munnangi R. How To Take Charge Of Your Patient Referral Leakage [Internet] Patient Access, Referral Management & E-Consult Software - referraMD. 2016 [cited 2016 Dec 15 ]. Available from: https://getreferralmd.com/2016/06/patient-referral-leakage-how-to-manage/
- 10.LaunchMed Help, My ACO is Leaking Patients! - LaunchMed [Internet] LaunchMed®. 2014 [cited 2016 Dec 15]. Available from: http://www.launch-med.com/resources/blog/help-my-aco-is-leaking-patients.html.
- 11.In-House Analytical Tool for Monitoring Leakage in an ACO - Society for Imaging Informatics in Medicine [Internet] SIIMorg. [cited 2017 Feb 8]. Available from: http://siim.org/?page=15ab_in_house_analyt.
- 12.The strategy many ACOs call the secret to MSSP success [Internet] [cited 2016 Nov 30] Available from: https://www.advisory.com/technology/crimson/crimson-labs/2013/11/the-strategy-many-acos-call-the-secret-to-mssp-success.
- 13.McWilliams JM, Hatfield LA, Chernew ME, Landon BE, Schwartz AL. Early Performance of Accountable Care Organizations in Medicare. N Engl J Med. 2016 Jun 16;374(24):2357–66. doi: 10.1056/NEJMsa1600142. [DOI] [PMC free article] [PubMed] [Google Scholar]
- 14.Clough JD, Patel K, Shrank WH. Variation in Specialty Outpatient Care Patterns in the Medicare Population. J Gen Intern Med. 2016 Nov 1;31(11):1278–86. doi: 10.1007/s11606-016-3745-8. [DOI] [PMC free article] [PubMed] [Google Scholar]
- 15.Mehrotra A, Forrest C, Lin C. Dropping the Baton: Specialty Referrals in the United States. Milbank Q. 2011 Mar 21;89(1):39–68. doi: 10.1111/j.1468-0009.2011.00619.x. [DOI] [PMC free article] [PubMed] [Google Scholar]
- 16.Song Z, Sequist TD, Barnett ML. Patient referrals: A linchpin for increasing the value of care. JAMA. 2014 Aug 13;312(6):597–8. doi: 10.1001/jama.2014.7878. [DOI] [PMC free article] [PubMed] [Google Scholar]
- 17.McWilliams J, Chernew ME, Dalton JB, Landon BE. Outpatient care patterns and organizational accountability in medicare. JAMA Intern Med. 2014 Jun 1;174(6):938–45. doi: 10.1001/jamainternmed.2014.1073. [DOI] [PubMed] [Google Scholar]
- 18.McWilliams JM, Schwartz AL. Focusing on High-Cost Patients — The Key to Addressing High Costs? N Engl J Med. 2017 Mar 2;376(9):807–9. doi: 10.1056/NEJMp1612779. [DOI] [PMC free article] [PubMed] [Google Scholar]
- 19.Zaslavsky AM, Ayanian JZ, Zaborski LB. The validity of race and ethnicity in enrollment data for Medicare beneficiaries. Health Serv Res. 2012 Jun;47(3 Pt 2):1300–21. doi: 10.1111/j.1475-6773.2012.01411.x. [DOI] [PMC free article] [PubMed] [Google Scholar]
- 20.Center for Medicare and Medicaid Services. Chronic Conditions Data Warehouse [Internet] 2014 [cited 2015 Mar 25]. Available from: https://www.ccwdata.org/
- 21.Pope Gregory C, Kautter John, Ingber Melvin J, Freeman Sara, Sekar Rishi, Newhart Cordon. Evaluation of the CMS-HCC Risk Adjustment Model [Internet] 2013 [cited 2017 Apr 12]. Available from: https://www.cms.gov/Medicare/Health-Plans/MedicareAdvtgSpecRateStats/Downloads/Evaluation_Risk_Adj_Model_2011.pdf.
- 22.Yun H, Kilgore ML, Curtis JR, Delzell E, Gary LC, Saag KG, et al. Identifying types of nursing facility stays using medicare claims data: an algorithm and validation. Health Serv Outcomes Res Methodol. 2010 Jul;10(1–2):100–10. [Google Scholar]
- 23.US Census Bureau. American Community Survey 5-year estimates [Internet] [cited 2017 Feb 8]. Available from: http://www.census.gov/programs-surveys/acs/data.html.
- 24.Neprash HT, Chernew ME, McWilliams JM. Little Evidence Exists To Support The Expectation That Providers Would Consolidate To Enter New Payment Models. Health Aff (Millwood) 2017 Feb 1;36(2):346–54. doi: 10.1377/hlthaff.2016.0840. [DOI] [PMC free article] [PubMed] [Google Scholar]
- 25.McWilliams JM. Cost Containment and the Tale of Care Coordination. N Engl J Med. 2016 Dec 8;375(23):2218–20. doi: 10.1056/NEJMp1610821. [DOI] [PMC free article] [PubMed] [Google Scholar]
- 26.Ginsburg PB. Accountable Care Organizations 2.0: Linking Beneficiaries. JAMA Intern Med. 2014 Jun 1;174(6):945–6. doi: 10.1001/jamainternmed.2014.161. [DOI] [PubMed] [Google Scholar]
- 27.4 recommendations to advance Medicare delivery system reform | Brookings Institution [Internet] Brookings. 2017 [cited 2017 Mar 26]. Available from: https://www.brookings.edu/blog/up-front/2017/02/10/4-recommendations-to-advance-medicare-delivery-system-reform/
- 28.Sinaiko AD, Rosenthal MB. Patients’ Role in Accountable Care Organizations. N Engl J Med. 2010 Dec 30;363(27):2583–5. doi: 10.1056/NEJMp1011927. [DOI] [PubMed] [Google Scholar]
Associated Data
This section collects any data citations, data availability statements, or supplementary materials included in this article.