. 2018 May 29;7:e31034. doi: 10.7554/eLife.31034

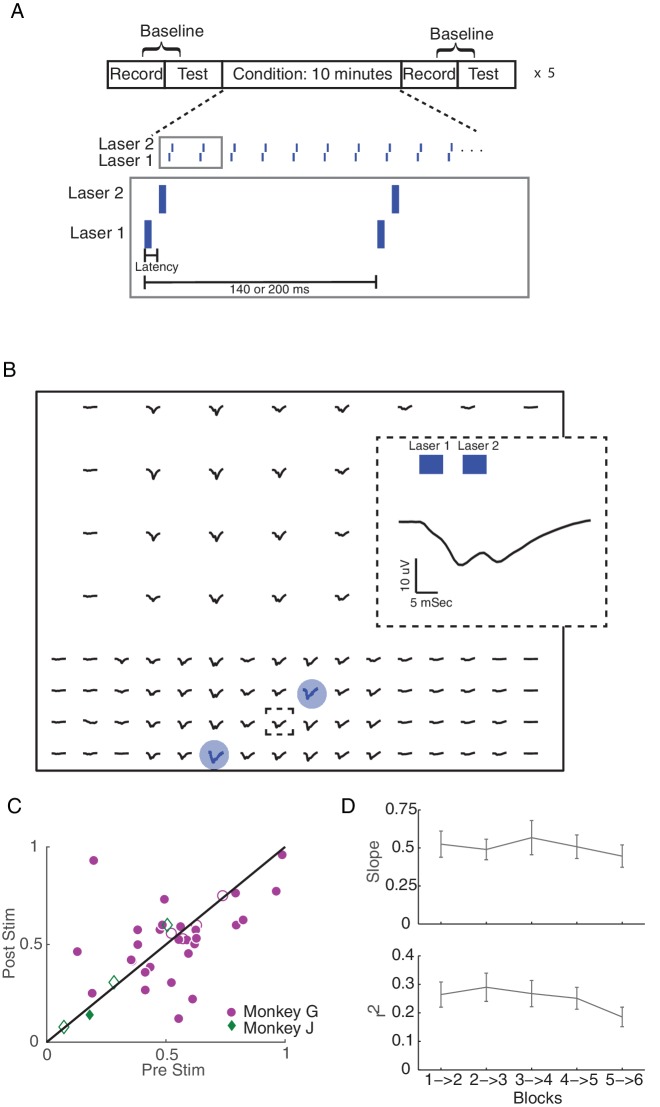
Figure 7. Hebbian plasticity models explain fine-scale network connectivity changes driven by complex spatio-temporal stimulation patterns.

(A) Same stimulation protocol as described in 4A. However, here we reduced the latency between to the two lasers to 10 ms or 30 ms, creating a more complicated pattern of stimulation. (B) An example of the stimulus-evoked activity across the array from Monkey G. Blue circles show the locations of stimulation. The inset shows the enlarged pattern of evoked response at the framed electrode, which is located close to both lasers. (C) Summary of inter-area theta coherence changes for all interference experiments across both monkeys. (D) Summary of regression parameters across all interference experiments. Errorbars show standard error.

Figure 7—source code 1. Coherence measurements and regression parameters for short-latency stimulation sessions.
DOI: 10.7554/eLife.31034.034
Figure 7—source data 1. Coherence measurements and regression parameters for short-latency stimulation sessions.
DOI: 10.7554/eLife.31034.035

Figure 7.

Figure 7—figure supplement 1. Short-latency example showing the relationship between input coherence and change in baseline coherence.

Figure 7—figure supplement 1.

(A) An example showing similarity between the input coherence (right panel) and the change in baseline coherence (left panel) in monkey J. Same as Figure 6A. (B) Linear regression between input coherence and the change in baseline coherence for the example session shown in A.
Figure 7—figure supplement 1—source code 1. Comparing pairwise coherence measurements for example session and regression parameters for all sessions by experimental condition.
DOI: 10.7554/eLife.31034.029
Figure 7—figure supplement 1—source data 1. Pairwise coherence measurements for example session and regression parameters for all sessions by experimental condition.
DOI: 10.7554/eLife.31034.030
Figure 7—figure supplement 2. Comparing the effects of stimulation on network connectivity between stimulation and controls.
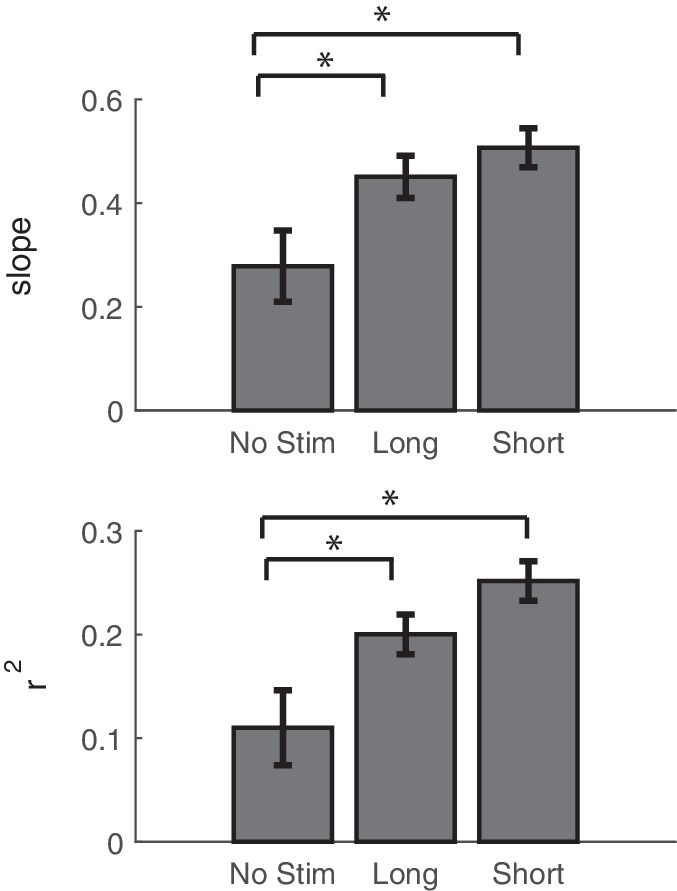
Figure 7—figure supplement 2.

Summary of regression fits of the change in theta coherence vs. the stimulus-evoked theta coherence. Slope and r2 values are reported as averages across stimulation blocks for non-interference stimulation (also reported in Figure 6C), interference-stimulation (also reported in Figure 7D), and control sessions. Error bars show standard error.
Figure 7—figure supplement 2—source code 1. Plot regression parameters for all sessions by experimental condition.
DOI: 10.7554/eLife.31034.032
Figure 7—figure supplement 2—source data 1. Regression parameters for all sessions by experimental condition.
DOI: 10.7554/eLife.31034.033