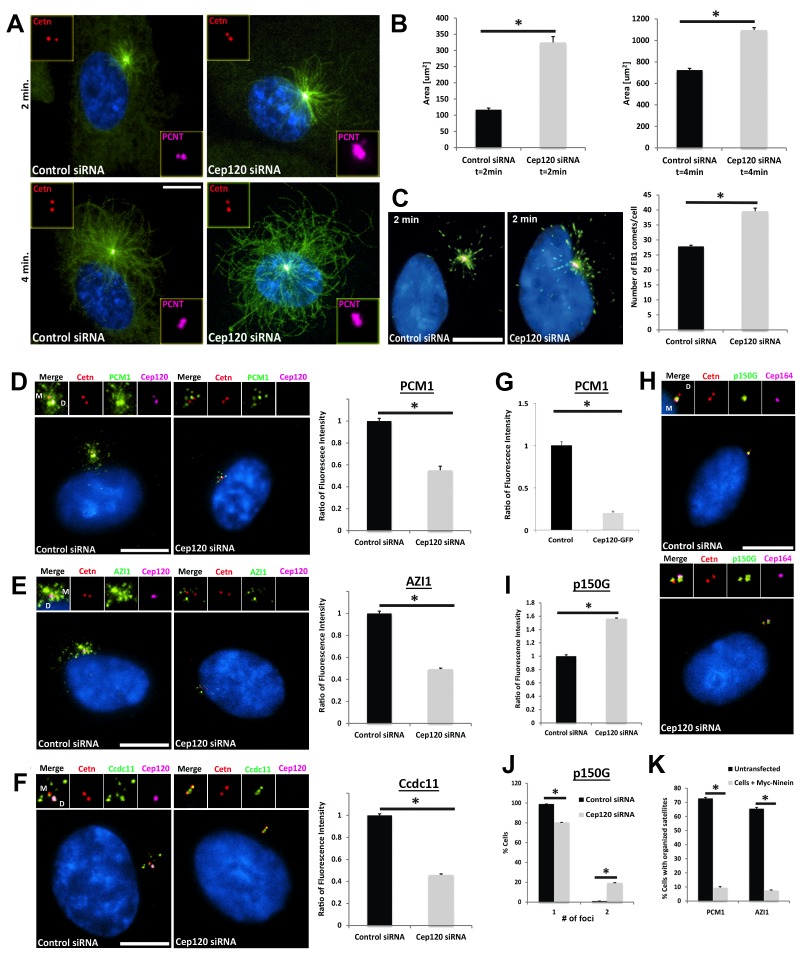
Figure 6. Increased microtubule nucleation and dispersal of centriolar satellites in Cep120-depleted cells.
(A) MEFs transfected with control or Cep120-siRNA for 48 hr were incubated with 0.1 μg/mL nocodazole on ice for 1 hr, washed and incubated with warm (37°C) media for the indicated times, fixed and stained for centrin (centrioles), pericentrin (PCM), α-tubulin (microtubules), and DAPI (DNA). (B) Quantification of microtubule aster size during regrowth. N = 400 (control) and 400 (Cep120) siRNA. (C) Cells at 2 min of regrowth were fixed and stained for α-tubulin (red), EB1 (green) and DAPI (blue). Graph denotes average number of EB1-positive foci at each centrosome. N = 300 (control) and 240 (Cep120) siRNA. (D–F) Loss of Cep120 causes mislocalization (dispersal) of centriolar satellites. Graphs show quantification of the fluorescence intensity for each satellite protein, normalized to control cells. (D) PCM-1: N = 375 (control) and 275 (Cep120) siRNA. (E) Azi-1: N = 215 (control) and 175 (Cep120) siRNA. (F) Ccdc11: N = 130 (control) and 134 (Cep120) siRNA. (G) Overexpression of exogenous Cep120 disrupts centriolar satellite localization. MEF cells were transfected with plasmid expressing Cep120-GFP, serum-starved for 24 hr, fixed and stained for GFP, centrin (centrioles) and PCM-1. Graph shows the fraction of cells with organized satellite protein localization at the centrosome. N = 200 cells per sample. Results are averages of two independent experiments; *p<0.05. (H–J) Loss of Cep120 results in accumulation of p150Glued at the centrosome. N = 315 (control) and 285 (Cep120) siRNA. Results are averages from three independent experiments; *p<0.05. Scale bars = 10 μm. (K) Overexpression of exogenous ninein disrupts centriolar satellite localization. MEF cells were transfected with plasmid expressing Myc-ninein, serum-starved for 24 hr, fixed and stained for Myc, centrin (centrioles), and the satellite proteins PCM-1 and Azi-1. Graph shows the fraction of cells with organized satellite protein localization at the centrosome. PCM-1: N = 300 (control untransfected) and 100 (Myc-ninein). Azi-1: N = 300 (control untransfected) and 100 (Myc-ninein). Results are averages of three independent experiments; *p<0.05. Scale bars = 10 μm.

