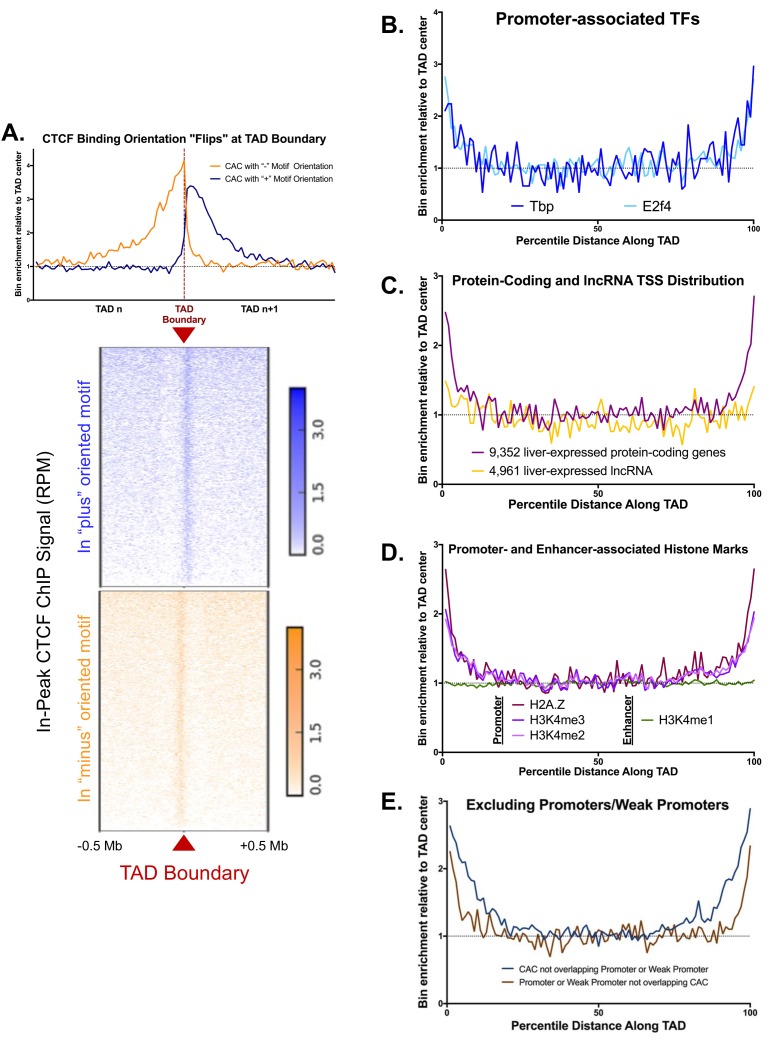
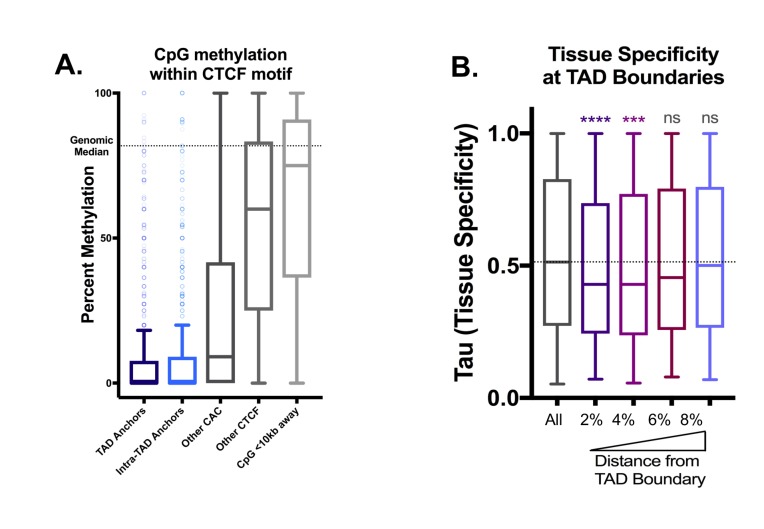
Figure 1. Features of TAD boundaries and TAD insulator function.
Profiles in A-E represent a normalized aggregate count of peaks or features along the length of all TADs, sub-divided into 100 equally-sized bins per TAD, where bin #1 is the 5’ start of the TAD and bin #100 is at the TAD 3’ end. Normalization was performed to allow comparison of multiple groups with variable peak numbers in a single figure. The y-axis displays the enrichment within a given bin versus the average of the five center bins (bins #48–52). In A-C, the number of binding sites in each group is shown in parenthesis. (A) Cohesin-and-CTCF (CAC) sites are enriched at TAD boundaries, while cohesin-non-CTCF (CNC) sites are weakly depleted. As the cohesin (Coh) complex is a multi-protein complex, the darker color within each group represents a stricter overlap between cohesin subunits (Rad21, Stag1 and Stag2). (B) In both mouse liver and MEFs, cohesin binding sites that are resistant to knockdown (KD) or knockout (KO) of cohesin component subunits (~40% of cohesin binding sites for liver) are strongly enriched for TAD boundaries. Cohesin sites that are sensitive to loss following KD or KO (~60% of sites for liver) are not enriched at TAD boundaries. (C) CTCF binding sites in liver that are deeply-shared across other ENCODE tissues (≥12 out of 15 other tissues examined) are strongly enriched at liver TAD boundaries, while those that are either unique to liver or shared in only one other tissue are not enriched at TAD boundaries. (D) TAD boundaries show greater hypomethylation than the TAD interior. The most hypomethylated CpGs are enriched at TAD boundaries, which likely represents a combination of hypomethylation at gene promoters and hypomethylation at CTCF binding sites. CpG methylation states, determined by liver whole genome bisulfite sequence analysis were subdivided into 10 bins based on the degree of methylation (0–10% methylated, 10–20%, etc.) prior to TAD distribution analysis. (E) 10 liver-expressed TFs are not enriched at TAD boundaries. These profiles are representative of the vast majority of the >50 publically available ChIP peak lists for liver-expressed TFs. Notable exceptions, related to promoter-associated features, marks, and transcription factors, are shown in Figure 1—figure supplement 1B,D. (F) Shown is a heat map of the distribution of the indicated activating and repressive marks and other features determined for male mouse liver across a 1 Mb window around each TAD boundary. TAD clusters, numbered at the left, were defined using k means clustering (k = 4). The boundaries between TADs transition from active to inactive chromatin compartments (or vice versa) for TAD clusters 2 and 3. In downstream analyses based on these results, a TAD was considered active if the boundary at the start of a TAD fell into clusters 1 or 2 and the boundary at the end of the same TAD fell into clusters 1 or 3; inactive TADs are those whose boundaries begin in clusters 3 or 4 and end in clusters 2 or 4 (see Materials and methods). See Supplementary file 1A for a full listing of the 3538 autosomal TADs analyzed and their active/inactive status. (G) UCSC browser screenshot for a transitional TAD boundary on chromosome 13 from TAD cluster 3 in Figure 1F. Arrows at bottom indicate CTCF motif orientation. (H) Box plots showing liver gene expression (RNA-seq) for 12,258 genes in 1930 active TADs and 4643 genes in 1000 inactive TADs (Supplementary file 1A). 939 genes in 473 of the inactive TADs are expressed at >1 FPKM (Supplementary file 1E). Genes found in active compartment TADs are more highly expressed, with the majority of genes showing >1 FPKM, than genes found in inactive TAD compartments. Genes in weakly active and weakly inactive TADs were excluded from these analyses. (I) Genes whose TSS are located in inactive TADs (‘B compartments’) are more tissue specific in their expression pattern than genes found in active TADs (‘A compartments’). The top GO category for expressed genes in the A compartment is RNA binding, while the top category for expressed genes in the B compartment is monooxygenase activity (not shown).


