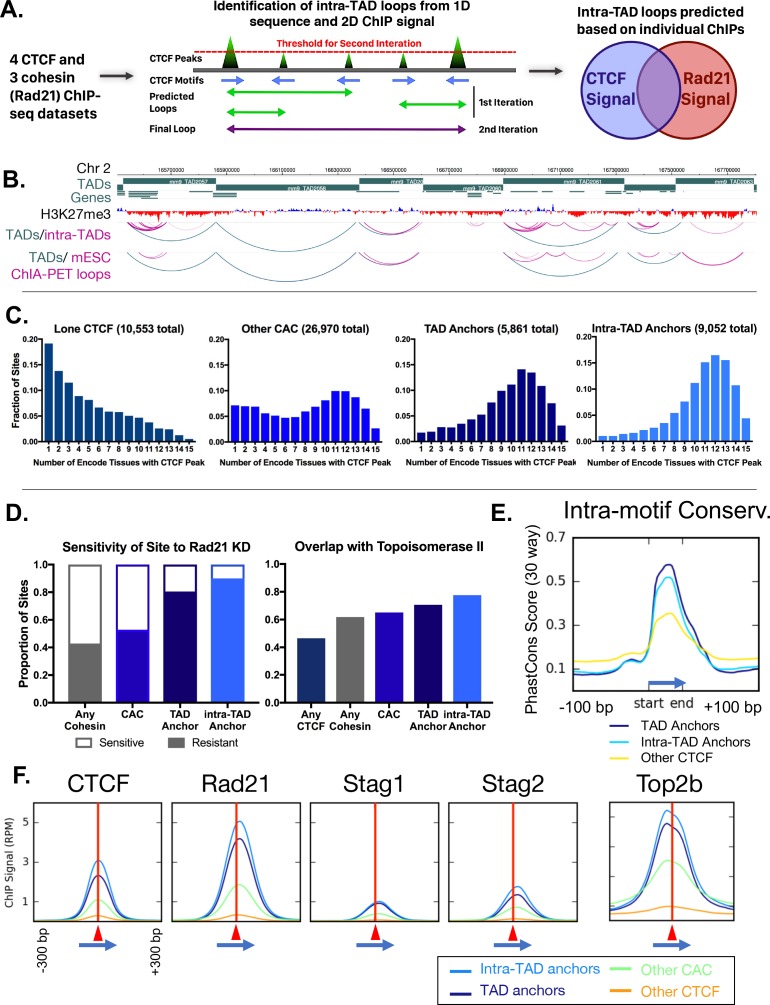
Figure 2. Predicted intra-TAD loop anchors share many properties of TAD anchors.
(A) Diagram illustrating intra-TAD loop prediction based on CTCF motif orientation and CTCF and cohesin (Rad21) ChIP-seq binding strength data. Iteration was conducted until 20,000 loops were predicted per sample, prior to filtering and intersection across samples, as detailed in Materials and methods. (B) Shown is a 2 Mb segment of mouse chromosome 2 indicating TAD loops (blue) and intra-TAD loops (pink) in relation to genes. Also shown are cohesin interaction loops identified experimentally in mouse ESC by Smc1 ChIA-PET (Dowen et al., 2014). (C) TAD and predicted intra-TAD loop anchors are more tissue ubiquitous than other categories of CTCF/CAC sites. Each of the four CTCF site subgroups was defined in mouse liver as detailed in Supplementary file 1C. The x-axis indicates the number of ENCODE tissues out of 15 tissues examined that also have CTCF bound, where a higher value indicates more tissue-ubiquitous CTCF binding. These data are shown for ‘lone’ CTCF binding sites (10,553), non-anchor cohesin-and-CTCF sites (‘Other CAC’; 26,970), TAD anchors (5,861), and intra-TAD loop anchors (9,052, which excludes those at a TAD loop anchor). While ‘Other CAC’ sites tend to be weaker (Figure 2F, below), 93% are bound by CTCF in at least one other mouse tissue, and 66% were verified in at least six other tissues. Similarly, for ‘Lone CTCF’, 81% of sites were bound by CTCF in at least one other mouse tissue, and 39% were verified in at least six other tissues (not shown). (D) TAD and intra-TAD loop anchors are more resistant to the knockdown effects of Rad21 ±haploinsufficency than other CAC sites or cohesin-bound regions. A larger fraction is also bound by the novel extrusion complex factor Top2b (Supplementary file 1C). (E) Loop anchors show greater intra-motif conservation than other CTCF-bound regions. Shown are the aggregate PhastCons score for oriented core motifs within either TAD (dark blue) or intra-TAD (light blue) anchors as compared to other CTCF peaks with motifs (yellow). (F) Cohesin interacts with the COOH terminus of CTCF (Xiao et al., 2011), which resulting in a shift of ~20 nt in cohesin ChIP signal relative to the CTCF summit (c.f. shift to the right of vertical red line) regardless of category of CTCF binding site (anchor/non-anchor). Blue arrows indicate the CTCF motif orientation and red triangles and vertical lines indicate position of the CTCF signal summit.


