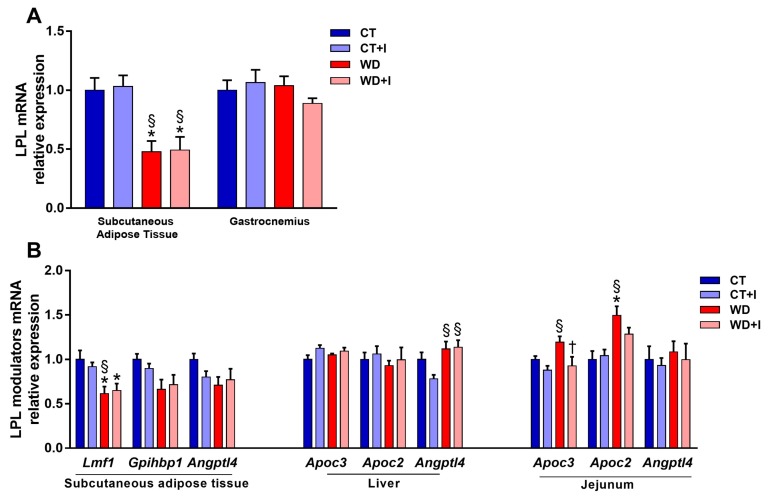
Figure 5.
Lpl mRNA expression in the muscle and subcutaneous adipose tissue (A). Level of mRNA expression of post-translational regulators of LPL activity (B). Data are presented as mean ± SEM and analyzed with two-way ANOVA followed by Tukey post hoc tests. * p < 0.05 versus CT, § p < 0.05 versus CT + I, † p < 0.05 versus WD.

