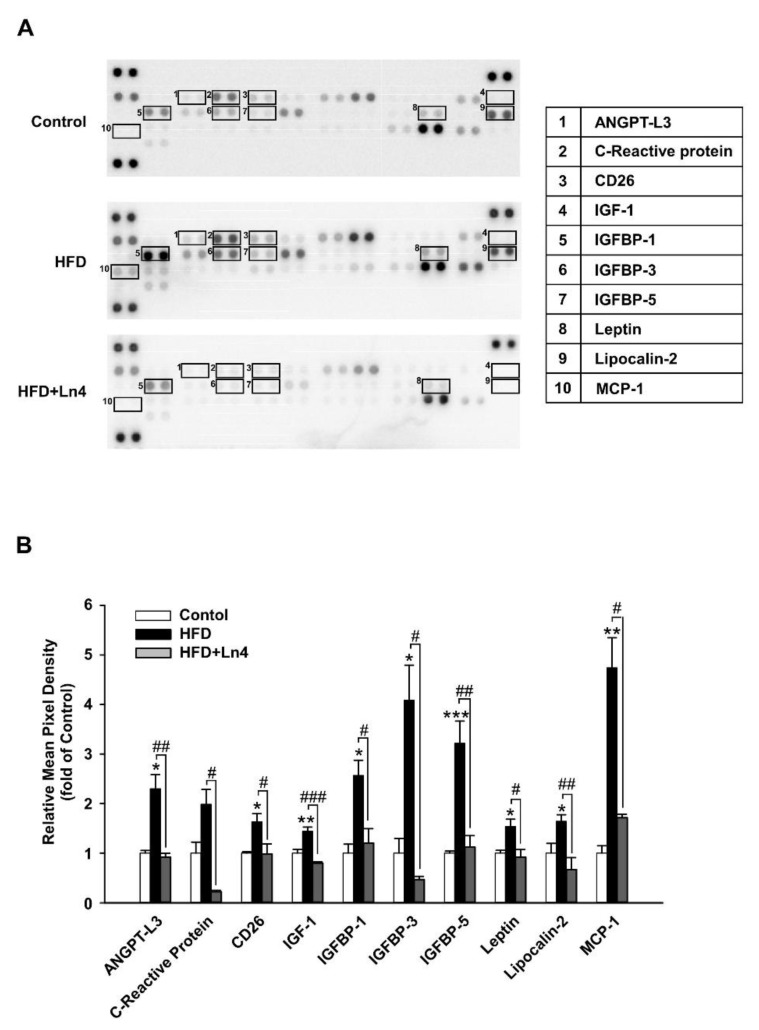
Figure 3.
Adipokine array analysis of white adipose tissue from mice. (A) Epidydimal fat tissues from mice (n = 4) were prepared as described in Materials & Method section. Representative proteins identified are marked as square, and each number presents different proteins described in the table on the right side. (B) Protein array membranes were quantified using Image J software. Selected proteins showing statistical group difference between HFD and HFD+Ln4 (#, p < 0.05; ##, p < 0.01; ###, p < 0.001, ANOVA, followed by Tukey’s test) are presented as mean ± SEM. * p < 0.05, ** p < 0.01, *** p < 0.001, significant differences compared with Control. ANGPTL3, angiopoietin-like 3; CD26, dipeptidyl peptidase-4; IGF, insulin-like growth factor; IGFBP, IGF-binding protein; MCP-1, monocyte chemoattractant protein 1.

