Abstract
Polycomb group (PcG) protein BMI1 is an important regulator of oncogenic phenotype and is often overexpressed in several human malignancies including breast cancer. Aberrant expression of BMI1 is associated with metastasis and poor prognosis in cancer patients. At present, therapy reagents that can efficiently inhibit the expression of BMI1 are not very well known. Here, we report that Timosaponin A-III (TA-III), a steroidal saponin obtained from the rhizomes of an herb, Anemarrhena asphodeloides, strongly inhibits expression of BMI1 in breast cancer cells. Treatment of breast cancer cells with TA-III resulted in inhibition of oncogenic phenotypes such as proliferation, migration and invasion, and induction of cellular senescence. Inhibition of these oncogenic phenotypes was accompanied by downregulation of BMI1 expression and histone posttranslational modification activity of PRC1. The mechanistic analysis of TA-III-induced inhibition of oncogenic activity and BMI1 expression suggests that downregulation of c-Myc mediates TA-III effect on BMI1. We further show that exogenous BMI1 overexpression can overcome TA-III-induced inhibition of oncogenic phenotypes. We also show that TA-III induces expression of tumor suppressive miR-200c and miR-141, which are negatively regulated by BMI1. In summary, our data suggest that TA-III is a potent inhibitor of BMI1 and that it can be successfully used to inhibit the growth of tumors where PcG protein BMI1 and PcG activities are upregulated.
Keywords: Breast Cancer, Timosaponin A-III, Cellular Senescence, Polycomb group proteins, BMI1, Tumor Suppressors, miR-200c, miR-141
Introduction
Polycomb group (PcG) proteins are a family of proteins that act as transcriptional repressors and play an important role in the regulation of many biological processes during development [1,2]. These processes include cell fate and lineage decisions, cellular memory, stem cell function, and tissue homeostasis [1,2]. Abnormal overexpression of PcGs, in particular BMI1 (B lymphoma Mo-MLV Insertion region 1) and EZH2 (Enhancer of Zeste Homolog 2) has been associated with the development of several different malignancies such as leukemia, and breast, prostate and lung cancers [3–14]. As a result of this overexpression, cellular senescence is bypassed in malignant cells, and their replicative lifespan is extended [15–18]. PcG proteins form multi-subunit complexes called polycomb repressive complexes (PRCs), which maintain chromatin in a transcriptionally inactive state and repress expression of tumor suppressors [1,2]. BMI1 is main constituent of PRC1, which catalyzes the mono-ubiquitination of histone H2A at lysine 119 (H2AUb), while PRC2 catalyzes the trimethylation of histone H3 at lysine 27 (H3K27me3) [1]. Inhibition of activity of either complex or their constituents is very likely to activate expression of tumor suppressors that are repressed by PcGs or inhibit expression of oncogenic factors that act downstream of PRCs. While many known inhibitors of EZH2 and therefore PRC2 such as DZNep, GSK126 and GSK343 are in preclinical and clinical trials [19], at present, very little is known about therapeutic reagents that can effectively target PcG protein BMI1 or PRC1 activity.
Timosaponin A-III, a steroidal saponin derived from the rhizomes of an herb Anemarrhena asphodeloides, is used in traditional Chinese medicine, primarily for its proposed anti-inflammatory and anti-pyretic effects [20,21]. Recently, there has been increasing evidence that saponins are able to inhibit tumor cell proliferation and act as chemotherapeutic agents [20,21]. Timosaponin A-III is thought to induce autophagy and subsequent mitochondrial-dependent apoptotic cell death, mediated by increased production of reactive oxygen species (ROS), and related mitochondrial dysfunction [21,22]. Timosaponin A-III mediated cell death may also involve the disruption of the mTOR pathway [23]. The detailed mechanism of TA-III induced inhibition of cell proliferation and oncogenic phenotypes is poorly understood. It is also not clear whether TA-III may induce other notable tumor suppressive phenotypes such as cellular senescence [24].
BMI1 is overexpressed in many cancers and known to upregulate oncogenic phenotypes including cancer stem cell (CSC) phenotype [25–27]. BMI1 is also known to regulate cellular senescence via regulation of p16INK4a [16], and p16INK4a-independent targets including WNT inhibitors and certain tumor suppressive miRNAs [28–30]. We hypothesized that TA-III may inhibit BMI1 expression and/or PRC1 activity, which may result in inhibition of cancer growth by TA-III. Here we studied the regulation of BMI1 expression and modulation of BMI1 induced oncogenic phenotypes by TA-III in breast cancer cells. Breast cancer is a heterogenous disease that consists of distinct subtypes based on the molecular profiles [31]. The most aggressive subtype known as triple negative breast cancer (TNBC) is characterized by the absence of estrogen, progesterone and Her2/neu receptors, and is refractory to the receptor blocking therapies [32]. At present, very little is known about the TNBC targeting therapeutics [32]. Hence, we studied the growth inhibitory effect of TA-III in both non-TNBC and TNBC cell lines. We report that TA-III strongly inhibits BMI1 expression, and that inhibition of BMI1 by TA-III mediates its tumor suppressive activities in both TNBC and non-TNBC cells. BMI1 is transcriptionally regulated by well-known oncogenic factor c-Myc [33]. Our studies further suggest that TA-III likely targets c-Myc expression resulting in downregulation of BMI1 expression. Recently, we reported that tumor suppressive miR-200c/141 locus is a target of PcG protein BMI1 and that a reciprocal relationship exists between the expression of miR200c/miR-141 cluster and BMI1 [30], suggesting that TA-III induced BMI1 inhibition may induce upregulation of miR200c/141 and consequently cellular senescence.
Materials and Methods
Cell Culture and Reagents
MDA-MB-231 and MCF7 cells were procured from American Type Culture Collection (ATCC) (Manassas, VA) and cultured in Dulbecco’s Modified Eagle’s Medium (DMEM) with 5% Fetal Bovine Serum (FBS), 2mM L-Glutamine, 1mM sodium pyruvate (Corning Cellgro), and 1% MEM nonessential amino acids. Cells were cultured at 37°C and 5% CO2 [28,29]. Timosaponin A-III (TA-III) was obtained from Sigma Aldrich (St. Louis, MO), dissolved in DMSO (dimethyl sulfoxide), and added to the cell culture medium as needed.
Antibodies and Western Blot Analysis
The BMI1 mouse monoclonal antibody (mAb) and a β-actin mAb were obtained from Invitrogen (Carlsbad, CA) and Sigma-Aldrich (St Louis, MO), respectively. Rabbit polyclonal antibodies (pAbs) against H3 and H2A were obtained from Cell Signaling Technology (Danvers, MA). H3K27me3 and H2AK119Ub pAbs were obtained from Millipore (Billerica, MA). MDA-MB-231 and MCF7 cells were plated on 100 mm dishes and treated with mock, 2 µM, or 4 µM of Timosaponin A-III. 72 hours after treatment, cells were lysed with Radio Immunoprecipitation Assay (RIPA) buffer, sonicated, and quantified using BCA protein assay kit (Thermo Scientific). 50 µg of whole cell lysate was run on 12% SDS-PAGE gel to determine the expression of BMI1, c-Myc and β-actin by Western blot analysis. Histone H2A and H2AK119Ub were analyzed by Western blot as described [29,30].
Expression vectors, promoter-reporters, transient transfections, retrovirus and lentivirus production, and luciferase assays
Stable MDA-MB-231 cell line expressing BMI1 was generated by expressing BMI1 using pBabe-puro retroviral vector overexpressing wild type BMI1 as described previously [28,29]. Wild type and E-box mutant version of BMI1 promoter-reporter has been described previously [33]. The promoter-reporter constructs were transiently transfected into 293T cells using calcium phosphate method, cells were then treated with TA-III, and promoter-reporter assays were performed using Dual-Luciferase® Reporter Assay System (Promega, Madison, WI) as described [28,29].
ChIP and qRT-PCR assays, and miRNA Analysis
The ChlP Assay was carried out using a kit from Millipore (Burlington, MA). Briefly, cells were treated with 1% formaldehyde for 20 min at room temperature. The cross-linked chromatin was isolated and sonicated to yield 200–500 bp fragments. Immunoprecipitations (IPs) were carried out using a c-Myc antibody (9E10) (Millipore, Burlington, MA), and a control IgG. The c-Myc and IgG- bound chromatin were amplified by quantitative real-time PCR (qPCR) as described using the primers (5’ ACGGGCCTGACTACACCGACACT 3’ and 5’ CTGAAGGCAGAGTGGAAACTGACAC 3’) that flank the c-Myc binding site of the BMI1 promoter [33]. The expression levels of BMI1 mRNA were determined by quantitative real-time PCR (qRT-PCR) with the QuantiTect SYBR® Green RT-PCR kit from Qiagen. Total RNA was extracted using TRIZOL RNA Isolation Protocol according to the manufacturer’s protocol (Invitrogen). cDNA was synthesized with an oligo dT primer mix using 1.0µg of total RNA. The cDNA was PCR amplified with primers specific for BMI1 and GAPDH. The qRT-PCR was run as follows; an initial activation at 50°C for 2 minutes, 95°C for 20 seconds, followed by 40 cycles of 95°C for 1 second and 60°C for 20 seconds. qRT-PCR was conducted in a Step One Plus Real-Time PCR system from Applied Biosciences. The comparative CT (ΔΔ CT) method was used to determine mRNA expression. GAPDH was used as a control. For miRNA analysis, total small non-coding RNA was extracted using a Qiagen kit, and used to prepare cDNA with a miRNA cDNA synthesis kit. The miRNA cDNA synthesis kit as well as miR-141, miR-200c, and RNU6B specific primers were obtained from Quanta Biosciences. The PCR amplification was carried out as described previously [29,30].
Proliferation, Migration Invasion, and wound healing Assays
The effect of Timosaponin A-III on proliferation was determined by an MTT assay. Migration and Invasion assays were carried out as described [29,30]. Briefly, MDA-MB-231 and MCF7 cells were plated in 24-well Corning Transwell Migration and BioCoat Matrigel® Invasion chambers, treated with Timosaponin A-III for 72 hours. 50,000 cells in 0.2 ml medium were added to the top chambers, and 1 ml DMEM was added to the bottom wells. After incubating overnight at 37°C, cells were fixed with methanol at −20°C, and stained with Diff-Quik stain (Dade Behring, Deerfield, IL). Unmigrated cells were removed from the top of the well, migrated cells were counted, and images were taken in multiple fields with a Nikon Eclipse Ti microscope under 10× magnification. For wound healing assay, MDA-MB-231 cells were cultured to confluence in 6 well plates and wound was made using a pipette tip and images were taken. Cells were either mock treated or treated with Timosaponin A-III (2 and 4 µM) and imaged again after 12 hr and 24 hr using a Nikon Eclipse Ti microscope under 10× magnification.
Senescence Associated β-galactosidase assay and EdU Co-staining
MDA-MB-231 and MCF7 cells were treated with Timosaponin A-III, and after 48 hours, EdU (5′ ethynyl -2′-deoxyuridine, a thymidine analog) and SA-β-Gal (Senescence Associated beta galactosidase) co-staining was performed as described [34,35]. Images were taken, and cells were counted with a Nikon Eclipse Ti microscope under 10× magnification.
Statistical Analysis
All experiments were performed in triplicates for each cell type and treatment, and all results are presented as the mean ±S.D. The statistical Significance was determined by the Student’s t test, and p < 0.05 was considered significant.
Results
Timosaponin A-III inhibits oncogenic phenotypes and induces premature senescence
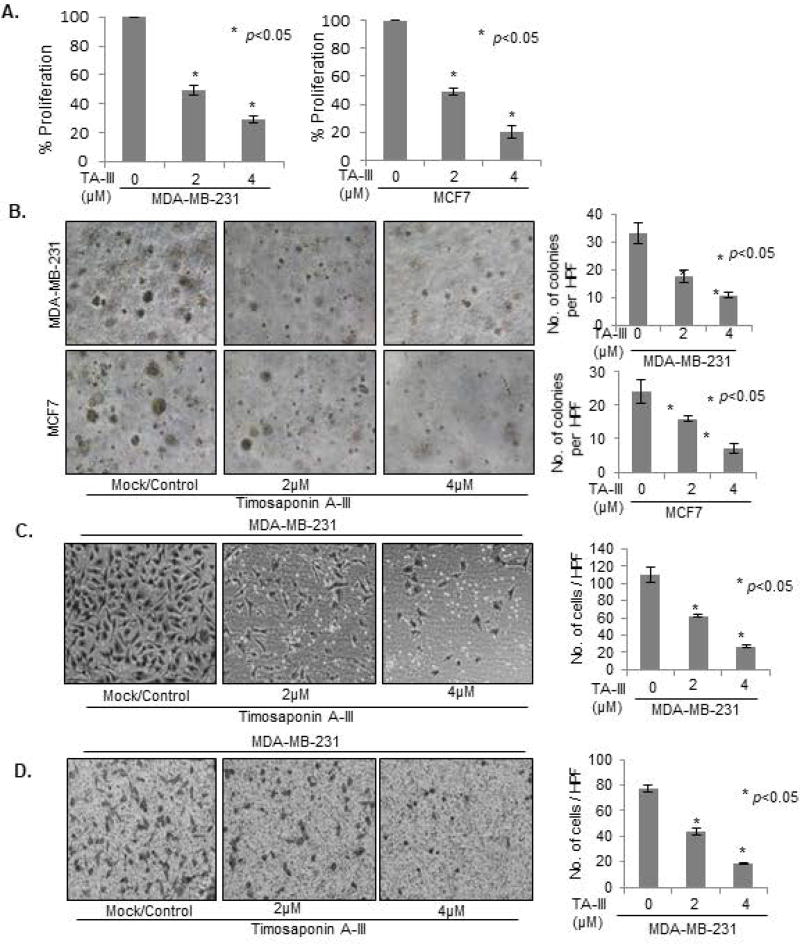
It has been reported that TA-III is cytotoxic and that it can inhibit cell growth of certain types of cancer cells [20,21,36]. To determine whether TA-III can inhibit growth of breast cancer cells, we used both TNBC (MDA-MB-231) and non-TNBC (MCF7) cells. Based on receptors and keratin profiles, these breast cancer cell lines are also classified as basal (MDA-MB-231) and luminal (MCF7). First, we determined the IC50 of TA-III in both of these cell lines. Using a dose-response experiment, the IC50 of TA-III in these cell lines was determined to be 2 µM (Suppl. Fig. 1). Next, cells were treated with 2 and 4 µm TA-III for 48 hr, and cell proliferation was measured using MTT assay (Fig. 1A). The results showed that TA-III strongly decreased cell proliferation of both cell lines in a dose-dependent manner (Fig. 1A). Next, we examined whether TA-III inhibits oncogenic/transformed phenotypes such as growth in soft-agar, migration and invasion of breast cancer cells.
Figure 1. Timosaponin A-III inhibits cell proliferation and oncogenic phenotypes in breast cancer cells.
(A). MDA-MB-231 and MCF7 cells were treated with indicated dose of TA-III for 48 hrs, and cell proliferation measured using MTT assay as described in Methods. (B). MDA-MB-231 and MCF7 cells were plated on top of soft agar and treated with TA-III for 7 days. Colonies were photographed using a Nikon inverted light microscope. (C). MDA-MB-231 cells were plated, treated with Timosaponin A-III at indicated dose for 24 hrs in the Transwell chambers. The cells were then fixed in cold methanol and stained with Diff-Quik. The images were taken under a Nikon Eclipse- Ti microscope under 10× magnification, and the number of migrated cells were counted and plotted as described in Methods. (D). Effects of TA-III on cell invasion in MDA-MB-231 cells was determined by plating cells in Invasion chambers and invaded cells were stained, counted and plotted as described above. The experiments were done in triplicates. Error bars represent ±S.D. * p <0.05.
First, we examined the ability of control and TA-III-treated MDA-MB-231 and MCF7 cells to form colonies in soft agar. The cells were plated on soft-agar and were either mock-treated or treated with TA-III as described in the Methods section. The results showed that TA-III strongly inhibits ability of breast cancer cells to form colonies in soft-agar (Fig. 1B). Next, we determined the effects of TA-III-treatment on migration and invasion of MDA-MB-231 cells, which are known to be highly invasive and migratory. The assays were performed as described [30]. The number of migrated and invaded cells were counted per high power field (HPF), and images were captured (Fig. 1C, 1D). The results show that TA-III strongly inhibits both migration and invasion of MDA-MB-231 cells in a dose-dependent manner. The inhibitory effect of TA-III on migration was further confirmed by wound healing assay (Suppl. Fig. 2). The assay further showed that TA-III effect on migration is noticeable even at 12 hr of treatment. Thus, TA-III is able to inhibit multiple oncogenic phenotypes of breast cancer cells.
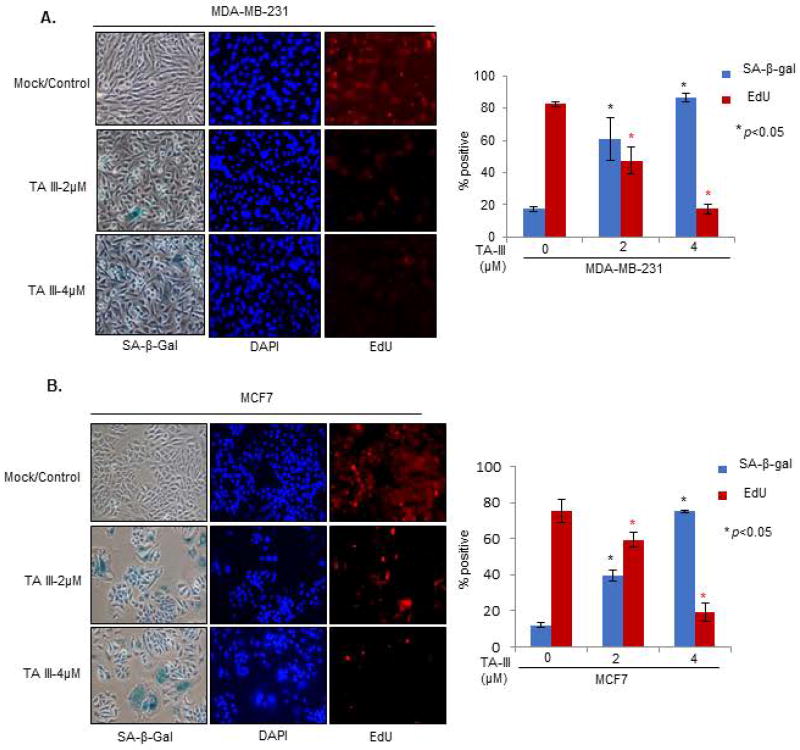
Induction of replicative or premature cellular senescence is considered a strong tumor-suppressive growth response [24]. To determine whether TA-III can induce premature senescence, we treated MDA-MB-231 and MCF7 cells with TA-III and performed senescence-associated-beta galactosidase (SA-β-gal) assay together with EdU (5′ ethynyl -2′-deoxyuridine, a thymidine analog) co-staining as described [34,35]. MDA-MB-231 and MCF7 cells were treated with TA-III for 48 hours, and co-stained with SA-β-gal and EdU, and nuclei were stained with DAPI (4',6-diamidino-2-phenylindole). The number of the stained cells were then counted and plotted (Fig. 2). The results indicate that TA-III strongly induces senescence in both MDA-MB-231 and MCF7 cells.
Figure 2. Timosaponin A-III induces premature senescence in breast cancer cells.
MDA-MB-231 (A) and MCF7 (B) cells were treated with TA-III for 48 hours and co-stained with SA-β-gal and EdU to determine induction of premature cell senescence as described in the Methods section. The number of SA-β-gal positive cells and EdU positive cells were counted and plotted as a graph. The experiment was done in triplicates. The error bars represent ±S.D. * p <0.05.
Timosaponin A-III downregulates expression of PcG protein BMI1
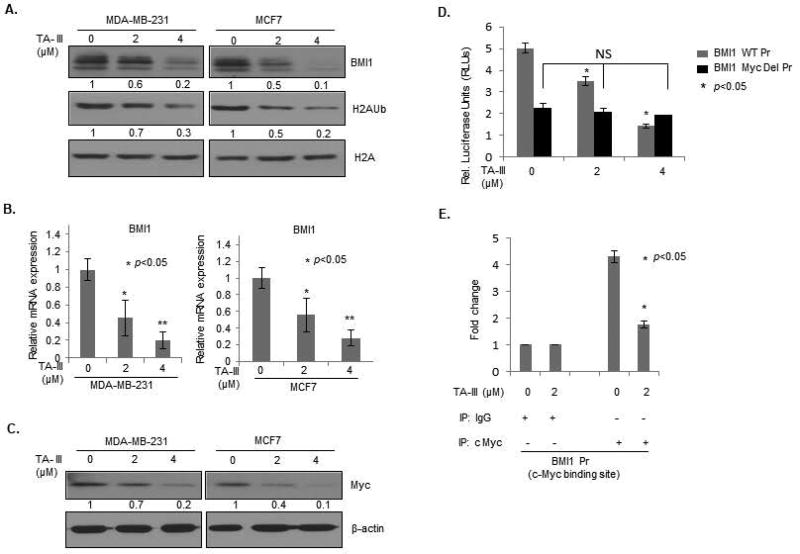
PcG protein BMI1 is known to promote cell proliferation and important oncogenic phenotypes such as migration, invasion, breast cancer stem cell (BCSC) characteristics and metastasis, and inhibit cellular senescence [8,16,25,27,30]. Hence, we examined the possibility that TA-III may inhibit expression of BMI1 and H2A ubiquitination activity of PRC1 associated with BMI1. First, we performed a Western blot analysis of mock and TA-III treated MDA-MB-231 and MCF7 breast cancer cells. The data indicated that indeed TA-III strongly inhibits expression of BMI1 and H2AUb in a dose-dependent manner indicating that TA-III may inhibit oncogenic phenotypes via downregulation of PRC1 activity (Fig. 3A).
Figure 3. Timosaponin A-III inhibits expression of BMI1.
(A). MDA-MB-231 (left panel) and MCF7 (right panel) cells were treated with indicated doses of TA-III. Cell lysates were prepared 48 hours after treatment, and the Western blot analysis was performed to detect the expression of BMI1, H2AK119Ub, total H2A using specific antibodies as described in the Methods section. (B). The expression of BMI1 in mock and TA-III treated MCF7 and MDA-MB-231 cells was determined by qRT-PCR analysis as described in the Methods section. The error bars represent ±S.D. * p <0.05. (C). MDA-MB-231 (left panel) and MCF7 (right panel) cells were treated with indicated doses of TA-III. Cell lysates were prepared 48 hours after treatment, and the expression of c-Myc and β-actin was determined by the Western blot analysis using specific antibodies as described in the Methods section. (D). 293T cells were transiently transfected with either wild type BMI1 promoter-reporter (pGL4.8-BMI1 WT Pr) or E-Box mutant BMI1 promoter-reporter (pGL4.8-BMI1 Mut Pr) and pTK-Luc plasmids, after 24 hrs cells were treated with TA-III with indicated doses for 48 hrs, and normalized relative luciferase activity was determined and plotted using a dual luciferase kit as described in the Methods section. The experiments were done in triplicates and the error bars represent ±S.D., * p <0.05. (E). ChIP assay was performed to determine in vivo binding activity of c-Myc in control and TA-III-treated cells. MDA-MB-231 cells were treated with 0 (mock) and 2 µM TA-III for 48 hr, cross linked chromatin prepared and immunoprecipitated either with IgG or c-Myc mAb, and PCR amplified as described in the Methods.
Next, to determine the possible mechanism of BMI1 downregulation by TA-III, we examined expression of BMI1 gene at the transcription level by qRT-PCR analysis of mock and TA-III-treated breast cancer cells. The results indicated that TA-III downregulated mRNA levels of BMI1 (Fig. 3B). The c-Myc oncoprotein, a b-HLH transcription factor is known to positively regulate expression of BMI1 at the transcription level [33]. Hence, we hypothesized that TA-III may inhibit BMI1 expression via downregulation of c-Myc in breast cancer cells. To examine this hypothesis, we analyzed expression of c-Myc in mock- and TA-III treated breast cancer cells using a Western blot analysis. The data indicated that indeed TA-III inhibits expression of c-Myc in a dose-dependent manner suggesting that TA-III may inhibit BMI1 expression via downregulation of c-Myc (Fig. 3C).
Next, to examine the possibility of TA-III regulating expression of BMI1 via c-Myc downregulation, we performed BMI1 promoter-reporter and ChIP (chromatin immunoprecipitation-linked PCR) assays. We have previously shown that c-Myc regulates transcription of BMI1 gene via an E-box (c-Myc binding site) in its promoter [33]. We analyzed luciferase activity of a wild type BMI1 promoter- reporter in TA-III- and mock- treated breast cancer cells. We also analyzed luciferase activity of BMI1 mutant promoter-driven reporter, in which c-Myc binding site (E-box) has been mutated [33]. The results indicated that while wild type BMI1 promoter activity is decreased by TA-III treatment in a dose-dependent manner, the activity of the mutant promoter is not altered by TA-III treatment (Fig. 3D). The ChIP assay was performed as described in the Methods section. The cross-linked chromatin from control and TA-III- treated cells was prepared and imumunoprecipitated using c-Myc mAb or IgG control as described in the Methods section. The primer set flanking c-Myc binding site of the BMI1 promoter, and a control primer set, which does not flank any c-Myc binding were used in PCR amplification of the Myc or IgG immunoprecipitated cross-linked chromatin. The ChIP analysis confirmed that TA-III treatment downregulated c-Myc binding to the E-box of the BMI1 promoter (Fig. 3E). Collectively, these data suggest that TA-III inhibits BMI1 expression via downregulation of c-Myc.
BMI1 overexpression overcomes inhibitory effects of Timosaponin A-III
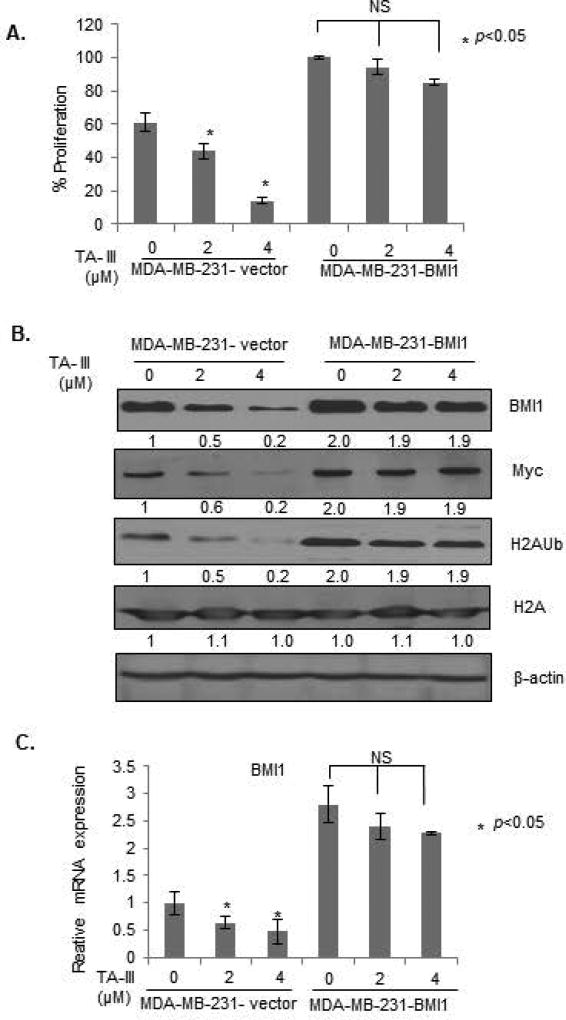
As BMI1 appears to be the transcriptional target of the TA-III inhibition via c-Myc downregulation, we hypothesized that the BMI1 overexpression using a heterologous promoter may overcome TA-III inhibition as such promoter would not be inhibited by TA-III, and still express BMI1 regardless of TA-III induced Myc downregulation. Hence, in order to define the role of BMI1 in TA-III-induced inhibition of oncogenic phenotypes, and induction of premature senescence by TA-III, we generated MDA-MB-231 cells overexpressing an exogenous BMI1 using retroviral expression. MDA-MB-231 cells were infected with pBabe-puro or pBabe-BMI1 retroviral vectors and stable cell lines were generated. The control (MDA-MB-231-B0) and BMI1 overexpressing (MDA-MB-231-BMI1) cells were analyzed for the expression of BMI1, c-Myc, total H2A and H2AUb expression after mock- or TA-III treatment. In parallel, cell proliferation was determined using MTT assay. The results indicated that TA-III had no significant effect on the proliferation in exogenous BMI1 overexpressing MDA-MB-231 cells, while proliferation of control B0 cells was inhibited as expected (Fig. 4A). The Western blot analysis indicated that there was no downregulation of c-Myc by TA-III in exogenous BMI1 overexpressing cells. There was no significant downregulation of BMI1 and H2AUb in exogenous BMI1 overexpressing cells, while control cells exhibited significant dose-dependent downregulation of c-Myc, BMI1 and H2AUb by TA-III treatment (Fig. 4B). We also analyzed effect of TA-III on BMI1 mRNA in control B0 and exogenous BMI1 overexpressing cells. Consistent with Western blot analysis, control but not BMI1 overexpressing cells exhibited downregulation of BMI1 (Fig. 4C). The slight downregulation of BMI1 mRNA in BMI1-overexpressing cells likely reflect TA-III effect on endogenous BMI1.
Figure 4. Exogenous BMI1 overcome Timosaponin A-III effects on cell proliferation.
(A). The control (B0) and exogenous BMI1 overexpressing (BMI1) MDA-MB-231 cells were generated using infection of pBabe-puro vector and pBabe-BMI1 retroviruses followed by selection of cells in puromycin as described in the Methods section. The cells were treated with TA-III, and cell proliferation was determined by the MTT assay as described in Fig. 1A. (B). Expression of BMI1, c-Myc, H2AK119Ub, total H2A and β-actin was determined in MDA-MB-231 -B0 (control) and MDA-MB-231-BMI1 cells by Western Blot analysis after the treatment with TA-III as described in Fig. 3A. (C). Expression of BMI1 in MDA-MB-231 -B0 (control) and MDA-MB-231-BMI1 cells was determined by qRT-PCR analysis using specific primers for BMI1 as described in Fig. 3B.
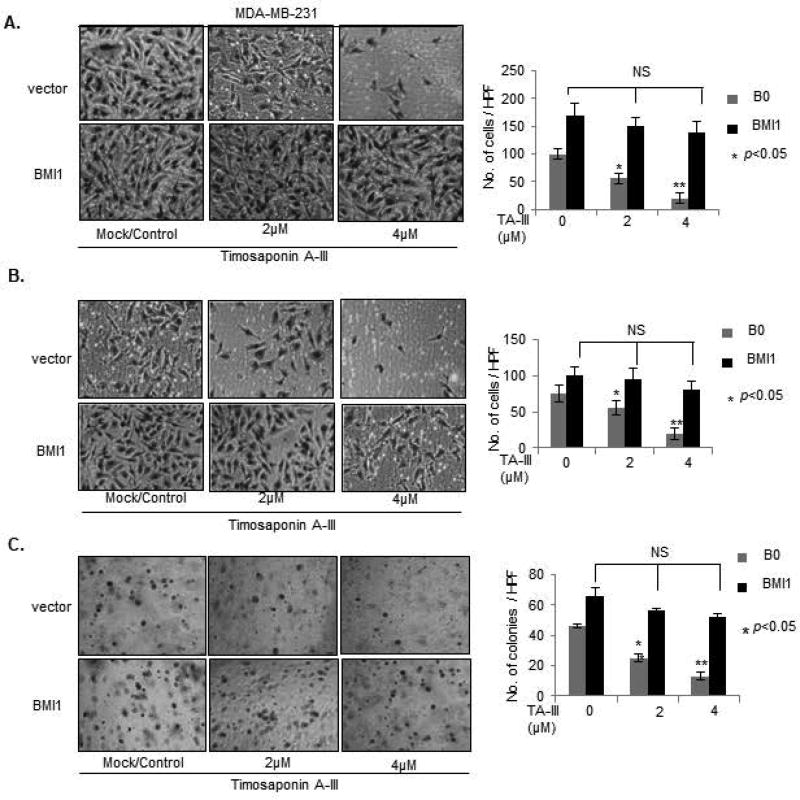
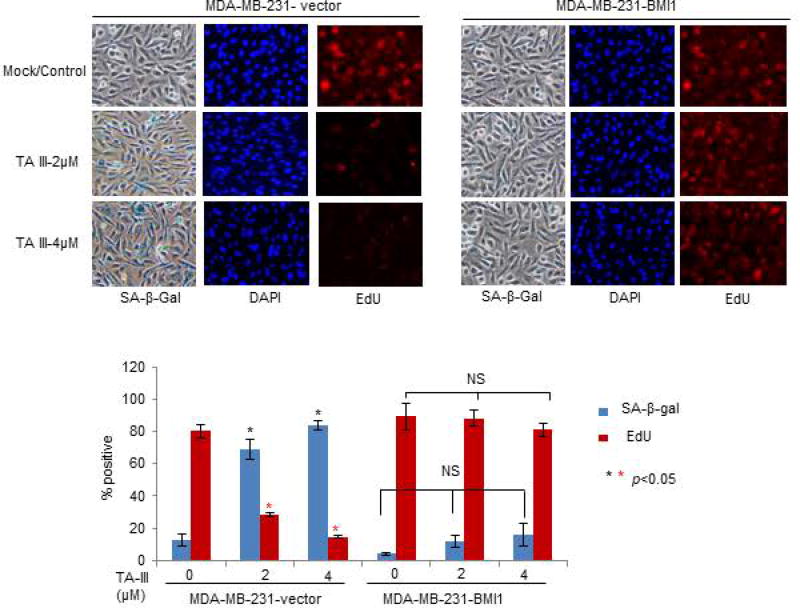
Next, we examined whether exogenous BMI1 overexpression can overcome the inhibitory effect of TA-III on the oncogenic phenotypes in MDA-MB-231 cells (Fig. 5). The results on migration, invasion and soft-agar colony formation assays showed that as expected TA-III strongly inhibits these phenotypes in control cells, but there is no inhibitory effect of TA-III on these oncogenic phenotypes in exogenous BMI1 overexpressing MDA-MB-231 cells (Fig. 5A, 5B, 5C). We also examined premature senescence induction by TA-III in control and exogenous BMI1 overexpressing MDA-MB-231 cells using SA-β-gal assay and EdU co-staining. The results indicated that there is no significant induction of senescence in exogenous BMI1 overexpressing cells as determined by counting the number of either SA-β-gal or EdU positive cells by TA-III treatment in MDA-MB-231-BMI1 cells. However, TA-III treatment resulted in increase in number of SA-β-gal positive and corresponding decrease in EdU positive cells in MDA-MB-231-B0 (control) cells (Fig. 6). Based on these results, we conclude that TA-III primarily inhibits oncogenic phenotypes and promotes cellular senescence in cancer cells via downregulation of PcG protein BMI1 and inhibition of the PRC1 activity.
Figure 5. Exogenous BMI1 overcomes inhibitory effects of Timosaponin A-III on oncogenic phenotypes.
Migration (A), Invasion (B) and Soft agar colony formation (C), assays using MDA-MB-231-B0 (control) and MDA-MB-231-BMI1 cells, mock or TA-III-treated, were carried out as described in Fig. 1B–Fig.1D.
Figure 6. Exogenous BMI1 inhibits premature senescence induction by Timosaponin A-III in breast cancer cells.
MDA-MB-231-B0 (control) and MDA-MB-231-BMI1 cells were mock- or TA-III treated, and the induction of premature senescence was determined by SA-β-gal and EdU co-staining as described in Fig. 3.
Timosaponin A-III induces expression of miR-141/200c cluster
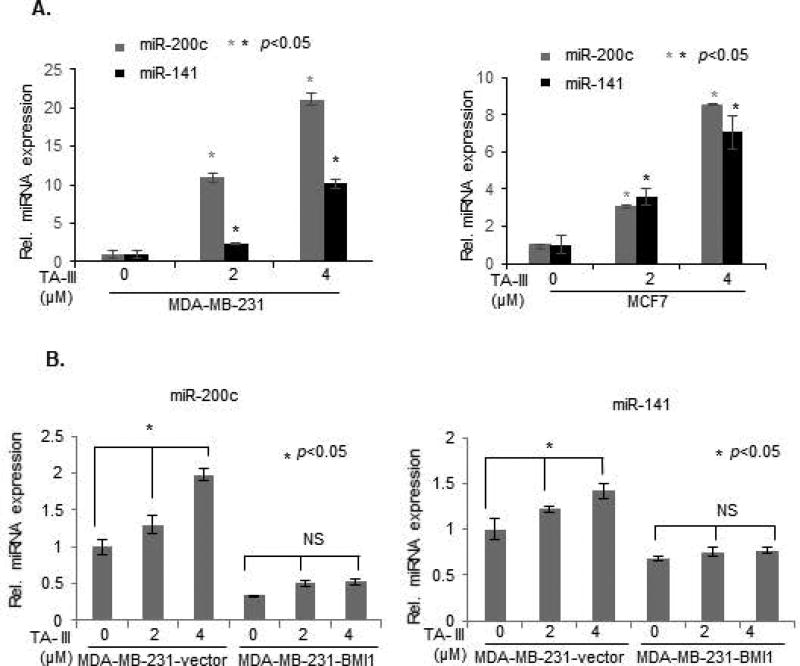
Recently, several studies have established oncogenic and tumor suppressive role of various miRNAs. One of the well-known tumor suppressive miRNA cluster, miR-141/200c, which encodes miR141 and miR200c is known to regulate oncogenic phenotypes such as migration, invasion, EMT, cancer stem cell phenotype and metastasis [30,37]. We and others have recently shown that BMI1 represses the expression of miR-141/200c locus [30], and that repression of miR-141 and miR200c contributes to oncogenic activities of BMI1 [29,30]. Hence, here we determined whether TA-III, which downregulates BMI1 modulates the expression of miR-141/200c cluster. MDA-MB-231 and MCF7 breast cancer cells were treated with different doses of TA-III and the expression of miR-141 and miR-200c was examined by qRT-PCR. The results show that in both breast cancer cell types, TA-III strongly induces miR-141 and miR-200c (Fig. 7A). We also determined whether exogenous BMI1 overexpression, which can overcome anti-oncogenic effects of TA-III can attenuate the induction of miR-200c and miR-141 by TA-III. To test this possibility, control and exogenous BMI1 overexpressing MDA-MB-231cells were treated with TA-III and the expression of miR-200c and miR-141 was determined by qRT-PCR analysis. The data showed that there was no induction of miR-141 and miR-200c in exogenous BMI1 overexpressing MDA-MB-231 cells (Fig. 7B). Thus, our data strongly suggest that BMI1 overexpression attenuates induction of miR-200c and miR-141 by TA-III in breast cancer cells. In summary, TA-III exhibits strong anti-cancer effects, which is mediated by its inhibitory effect on the expression of PcG protein BMI1 and its targets miRNAs, in particular miR-141 and miR-200c.
Figure 7. Timosaponin A-III induces expression of miR-200c and miR-141, and exogenous BMI1 inhibits induction of miR200c/141 cluster by TA-III.
(A). MDA-MB-231 and MCF7 cells were treated with different doses of TA-III for 48 hrs., and expression of mir-200c and miR-141 was examined by qRT-PCR analysis as described in the Methods section. (B). Expression of miR-200c (left panel), and miR-141 (right panel) was determined by qRT-PCR analysis in MDA-MB-231-B0 (control) and MDA-MB-231-BMI1 cells that were either mock- or TA-III- treated as indicated. The experiments were done in triplicates and the error bars represent ±S.D., * p <0.05.
Our results can be summarized in a schematic representation depicted in Figure 8. TA-III appears to strongly inhibit c-Myc expression and its binding activity. The exact mechanism of c-Myc inhibition by TA-III remains to be explored, which may involve transcriptional or posttranscriptional regulation. By inhibiting c-Myc expression, TA-III downregulates BMI1, which is positively regulated by c-Myc at the transcription level. As described above, BMI1 downregulation results in derepression of miR-200c/141 locus, which is known to act as a tumor suppressor locus. Upregulation of miR-200c and miR-141 likely mediate the induction of known tumor suppressive activities, such as inhibition of migration, invasion and proliferation, and induction of senescence by TA-III (Fig. 8). Interestingly, miR-200c and miR-141 are known to inhibit BMI1 expression by a posttranscriptional feedback mechanism, which should result in further BMI1 downregulation. Thus, the tumor suppressive activities of TA-III are further augmented by upregulation of miR200c and miR-141, and additional inhibition of BMI1 by these miRNAs.
Figure 8. Schematic representation of mechanism of TA-III induced tumor suppressive activity in breast cancer cells.
TA-III treatment inhibits c-Myc expression, which results in induction of tumor suppressive phenotypes via BMI1-miR-200c/141 pathway in breast cancer cells.
Conclusion
PRCs and their constituent PcG proteins are important players of epigenetic regulation in higher organisms (2, 6). It has been very well established that these proteins, in particular BMI1 and EZH2 are overexpressed in cancer cells, and that their overexpression regulates various oncogenic phenotypes. Aberrant expression of BMI1 also enables cells to bypass cellular senescence, an important growth inhibitory phenotype involved in tumor suppression [8,16,25,27,30]. Because of its overexpression in cancer cells, and its functional role in promoting oncogenic phenotypes, BMI1 is clearly an important therapeutic target of cancer prevention and treatment. There are very few reagents known that can efficiently inhibit BMI1 expression. We are interested in exploring the potential BMI1-inhibitory activity of chemopreventive and traditional medicinal compounds. Timosaponin A-III is a steroidal saponin derived from the rhizomes of a herb A. asphodeloides, that has been shown to specifically inhibit tumor cell proliferation and oncogenic phenotype [20,21]. In this study, we examined the ability of TA-III to induce senescence and control the oncogenic phenotypes of breast cancer cells by down regulation of BMI1. Consistent with published data, we found that TA-III strongly inhibited proliferation of breast cancer cells and various oncogenic phenotypes such as migration, invasion and ability to form colonies in soft agar.
Although TA-III is known to induce autophagy and cell death [20,21], and these properties of the TA-III may account for some of the anti-oncogenic or tumor suppressor activity of the TA-III, we reasoned that it may also induce premature cell senescence, which is a well-known tumor suppressor phenotype [24]. Furthermore, it has been shown that TA-III induces mitochondrial reactive oxygen species (mtROS) [20,21], which can also result in cell senescence. Hence, we reasoned that TA-III may function to inhibit oncogenic activities via induction of cell senescence in breast cancer cells. Indeed, our data show that TA-III strongly induces cell senescence in MDA-MB-231 and MCF7 breast cancer cells. Because TA-III can induce senescence in both triple negative breast cancer cell (TNBC) type (MDA-MB-231) and non-TNBC cell type (MCF7), TA-III induced inhibition of oncogenic phenotypes and induction of cell senescence appears to be independent of ER and PR, two important growth receptors associated with breast cancer. Furthermore, while MCF7 are p53 positive cells, MDA-MB-231 cells express mutant p53, hence senescence induction by TA-III is also independent of p53 in breast cancer cells. We have previously shown that inhibition of BMI1 either by RNA interference (RNAi) or treatment with HDACs strongly induces senescence in breast cancer cells regardless of p53 or receptor status [38]. Hence, the PcG protein BMI1 appears to be a logical target of TA-III in cancer cells. Our studies confirmed that TA-III strongly inhibits expression of BMI1.
Further mechanistic studies suggest that the BMI1 inhibition by TA-III is transcriptional and likely mediated by downregulation of c-Myc, which is an important oncogenic factor. Although it is possible that BMI1 can regulate oncogenic phenotypes via non-PRC mechanisms, most of the BMI1 epigenetic regulation depends on PRC1 activity. Consistent with this notion, and published literature, we found that TA-III inhibits PRC1 activity. The downstream targets of BMI1 include known tumor suppressors such p16INK4a, p21, p14ARF, and WNT inhibitors [16,28]. Another important category of downstream targets of BMI1 are non-coding RNAs (ncRNAs) such as miRNA-141 and miRNA-200c [29,30]. These miRNAs also regulate oncogenic phenotypes and act as tumor suppressive miRNAs [29,30]. As the INK4a/ARF locus is deleted or methylated in most breast tumors and breast cancer cells that are studied in cell culture including MCF7 and MDA-MB-231 cells that are being used in our study, the miRNA targets of BMI1 are likely to be much more relevant for breast cancer therapy. Hence, here we focused on miR-141/200c cluster and found that TA-III induced expression of both miR-141 and miR-200c as a consequence of BMI1 inhibition by TA-III. Collectively, our data show that TA-III inhibits expression of c-Myc, BMI1 and PRC1 activity, and BMI1 inhibition by TA-III leads to inhibition of oncogenic phenotypes, and induction of cellular senescence. Based on our results, we suggest that TA-III exhibits strong tumor suppression activity via modulation of Myc-BMI1-miR-200c/141 pathway (Fig. 8), which is highly relevant to breast cancer development. BMI1 and c-Myc are important therapeutic targets of strong interest to cancer researchers and oncology clinicians. Studies presented here may help in developing new range of pharmacological inhibitors of c-Myc and BMI1 based on TA-III and related phytochemicals and their derivatives.
Supplementary Material
Acknowledgments
This work was supported in part by R03 CA184331 and R03 CA223946 (MD) from the National Cancer Institute, NIH.
References
- 1.Di Croce L, Helin K. Transcriptional regulation by Polycomb group proteins. Nat Struct Mol Biol. 2013;20(10):1147–1155. doi: 10.1038/nsmb.2669. [DOI] [PubMed] [Google Scholar]
- 2.Valk-Lingbeek ME, Bruggeman SW, van Lohuizen M. Stem cells and cancer; the polycomb connection. Cell. 2004;118(4):409–418. doi: 10.1016/j.cell.2004.08.005. [DOI] [PubMed] [Google Scholar]
- 3.Abdouh M, Facchino S, Chatoo W, Balasingam V, Ferreira J, Bernier G. BMI1 sustains human glioblastoma multiforme stem cell renewal. J Neurosci. 2009;29(28):8884–8896. doi: 10.1523/JNEUROSCI.0968-09.2009. [DOI] [PMC free article] [PubMed] [Google Scholar]
- 4.Bruggeman SW, Hulsman D, Tanger E, et al. Bmi1 controls tumor development in an Ink4a/Arf-independent manner in a mouse model for glioma. Cancer Cell. 2007;12(4):328–341. doi: 10.1016/j.ccr.2007.08.032. [DOI] [PubMed] [Google Scholar]
- 5.Dovey JS, Zacharek SJ, Kim CF, Lees JA. Bmi1 is critical for lung tumorigenesis and bronchioalveolar stem cell expansion. Proc Natl Acad Sci U S A. 2008;105(33):11857–11862. doi: 10.1073/pnas.0803574105. [DOI] [PMC free article] [PubMed] [Google Scholar]
- 6.Duss S, Andre S, Nicoulaz AL, et al. An oestrogen-dependent model of breast cancer created by transformation of normal human mammary epithelial cells. Breast Cancer Res. 2007;9(3):R38. doi: 10.1186/bcr1734. [DOI] [PMC free article] [PubMed] [Google Scholar]
- 7.Fan C, He L, Kapoor A, et al. Bmi1 promotes prostate tumorigenesis via inhibiting p16(INK4A) and p14(ARF) expression. Biochimica et biophysica acta. 2008;1782(11):642–648. doi: 10.1016/j.bbadis.2008.08.009. [DOI] [PubMed] [Google Scholar]
- 8.Glinsky GV, Berezovska O, Glinskii AB. Microarray analysis identifies a death-from-cancer signature predicting therapy failure in patients with multiple types of cancer. J Clin Invest. 2005;115(6):1503–1521. doi: 10.1172/JCI23412. [DOI] [PMC free article] [PubMed] [Google Scholar]
- 9.Kim JH, Yoon SY, Jeong SH, et al. Overexpression of Bmi-1 oncoprotein correlates with axillary lymph node metastases in invasive ductal breast cancer. Breast (Edinburgh, Scotland) 2004;13(5):383–388. doi: 10.1016/j.breast.2004.02.010. [DOI] [PubMed] [Google Scholar]
- 10.Kim JH, Yoon SY, Kim CN, et al. The Bmi-1 oncoprotein is overexpressed in human colorectal cancer and correlates with the reduced p16INK4a/p14ARF proteins. Cancer letters. 2004;203(2):217–224. doi: 10.1016/j.canlet.2003.07.009. [DOI] [PubMed] [Google Scholar]
- 11.Martinez-Romero C, Rooman I, Skoudy A, et al. The epigenetic regulators Bmi1 and Ring1B are differentially regulated in pancreatitis and pancreatic ductal adenocarcinoma. The Journal of pathology. 2009;219(2):205–213. doi: 10.1002/path.2585. [DOI] [PubMed] [Google Scholar]
- 12.Raaphorst FM, Meijer CJ, Fieret E, et al. Poorly differentiated breast carcinoma is associated with increased expression of the human polycomb group EZH2 gene. Neoplasia. 2003;5(6):481–488. doi: 10.1016/s1476-5586(03)80032-5. [DOI] [PMC free article] [PubMed] [Google Scholar]
- 13.Raaphorst FM, van Kemenade FJ, Blokzijl T, et al. Coexpression of BMI-1 and EZH2 polycomb group genes in Reed-Sternberg cells of Hodgkin's disease. The American journal of pathology. 2000;157(3):709–715. doi: 10.1016/S0002-9440(10)64583-X. [DOI] [PMC free article] [PubMed] [Google Scholar]
- 14.Sasaki M, Yamaguchi J, Itatsu K, Ikeda H, Nakanuma Y. Over-expression of polycomb group protein EZH2 relates to decreased expression of p16 INK4a in cholangiocarcinogenesis in hepatolithiasis. The Journal of pathology. 2008;215(2):175–183. doi: 10.1002/path.2345. [DOI] [PubMed] [Google Scholar]
- 15.Dimri GP, Martinez JL, Jacobs JJ, et al. The Bmi-1 oncogene induces telomerase activity and immortalizes human mammary epithelial cells. Cancer research. 2002;62(16):4736–4745. [PubMed] [Google Scholar]
- 16.Itahana K, Zou Y, Itahana Y, et al. Control of the replicative life span of human fibroblasts by p16 and the polycomb protein Bmi-1. Molecular and cellular biology. 2003;23(1):389–401. doi: 10.1128/MCB.23.1.389-401.2003. [DOI] [PMC free article] [PubMed] [Google Scholar]
- 17.Jacobs JJ, Kieboom K, Marino S, DePinho RA, van Lohuizen M. The oncogene and Polycomb-group gene bmi-1 regulates cell proliferation and senescence through the ink4a locus. Nature. 1999;397(6715):164–168. doi: 10.1038/16476. [DOI] [PubMed] [Google Scholar]
- 18.Song LB, Zeng MS, Liao WT, et al. Bmi-1 is a novel molecular marker of nasopharyngeal carcinoma progression and immortalizes primary human nasopharyngeal epithelial cells. Cancer research. 2006;66(12):6225–6232. doi: 10.1158/0008-5472.CAN-06-0094. [DOI] [PubMed] [Google Scholar]
- 19.Kim KH, Roberts CW. Targeting EZH2 in cancer. Nature medicine. 2016;22(2):128–134. doi: 10.1038/nm.4036. [DOI] [PMC free article] [PubMed] [Google Scholar]
- 20.Kang YJ, Chung HJ, Nam JW, et al. Cytotoxic and antineoplastic activity of timosaponin A-III for human colon cancer cells. Journal of natural products. 2011;74(4):701–706. doi: 10.1021/np1007735. [DOI] [PubMed] [Google Scholar]
- 21.Sy LK, Yan SC, Lok CN, Man RY, Che CM. Timosaponin A-III induces autophagy preceding mitochondria-mediated apoptosis in HeLa cancer cells. Cancer research. 2008;68(24):10229–10237. doi: 10.1158/0008-5472.CAN-08-1983. [DOI] [PubMed] [Google Scholar]
- 22.Nho KJ, Chun JM, Kim HK. Induction of mitochondria-dependent apoptosis in HepG2 human hepatocellular carcinoma cells by timosaponin A-III. Environmental toxicology and pharmacology. 2016;45:295–301. doi: 10.1016/j.etap.2016.06.012. [DOI] [PubMed] [Google Scholar]
- 23.King FW, Fong S, Griffin C, et al. Timosaponin AIII is preferentially cytotoxic to tumor cells through inhibition of mTOR and induction of ER stress. PloS one. 2009;4(9):e7283. doi: 10.1371/journal.pone.0007283. [DOI] [PMC free article] [PubMed] [Google Scholar]
- 24.Dimri GP. What has senescence got to do with cancer? Cancer Cell. 2005;7(6):505–512. doi: 10.1016/j.ccr.2005.05.025. [DOI] [PMC free article] [PubMed] [Google Scholar]
- 25.Datta S, Hoenerhoff MJ, Bommi P, et al. Bmi-1 cooperates with H-Ras to transform human mammary epithelial cells via dysregulation of multiple growth-regulatory pathways. Cancer research. 2007;67(21):10286–10295. doi: 10.1158/0008-5472.CAN-07-1636. [DOI] [PMC free article] [PubMed] [Google Scholar]
- 26.Guo WJ, Zeng MS, Yadav A, et al. Mel-18 acts as a tumor suppressor by repressing Bmi-1 expression and down-regulating Akt activity in breast cancer cells. Cancer research. 2007;67(11):5083–5089. doi: 10.1158/0008-5472.CAN-06-4368. [DOI] [PMC free article] [PubMed] [Google Scholar]
- 27.Hoenerhoff MJ, Chu I, Barkan D, et al. BMI1 cooperates with H-RAS to induce an aggressive breast cancer phenotype with brain metastases. Oncogene. 2009;28(34):3022–3032. doi: 10.1038/onc.2009.165. [DOI] [PMC free article] [PubMed] [Google Scholar]
- 28.Cho JH, Dimri M, Dimri GP. A positive feedback loop regulates the expression of polycomb group protein BMI1 via WNT signaling pathway. The Journal of biological chemistry. 2013;288(5):3406–3418. doi: 10.1074/jbc.M112.422931. [DOI] [PMC free article] [PubMed] [Google Scholar]
- 29.Dimri M, Carroll JD, Cho JH, Dimri GP. microRNA-141 regulates BMI1 expression and induces senescence in human diploid fibroblasts. Cell Cycle. 2013;12(22):3537–3546. doi: 10.4161/cc.26592. [DOI] [PMC free article] [PubMed] [Google Scholar]
- 30.Dimri M, Kang M, Dimri GP. A miR-200c/141-BMI1 autoregulatory loop regulates oncogenic activity of BMI1 in cancer cells. Oncotarget. 2016;7(24):36220–36234. doi: 10.18632/oncotarget.8811. [DOI] [PMC free article] [PubMed] [Google Scholar]
- 31.Perou CM, Sorlie T, Eisen MB, et al. Molecular portraits of human breast tumours. Nature. 2000;406(6797):747–752. doi: 10.1038/35021093. [DOI] [PubMed] [Google Scholar]
- 32.Bianchini G, Balko JM, Mayer IA, Sanders ME, Gianni L. Triple-negative breast cancer: challenges and opportunities of a heterogeneous disease. Nature reviews Clinical oncology. 2016;13(11):674–690. doi: 10.1038/nrclinonc.2016.66. [DOI] [PMC free article] [PubMed] [Google Scholar]
- 33.Guo WJ, Datta S, Band V, Dimri GP. Mel-18, a polycomb group protein, regulates cell proliferation and senescence via transcriptional repression of Bmi-1 and c-Myc oncoproteins. Mol Biol Cell. 2007;18(2):536–546. doi: 10.1091/mbc.E06-05-0447. [DOI] [PMC free article] [PubMed] [Google Scholar]
- 34.Dimri GP, Lee X, Basile G, et al. A biomarker that identifies senescent human cells in culture and in aging skin in vivo. Proc Natl Acad Sci U S A. 1995;92(20):9363–9367. doi: 10.1073/pnas.92.20.9363. [DOI] [PMC free article] [PubMed] [Google Scholar]
- 35.Itahana K, Itahana Y, Dimri GP. Colorimetric detection of senescence-associated beta galactosidase. Methods Mol Biol. 2013;965:143–156. doi: 10.1007/978-1-62703-239-1_8. [DOI] [PMC free article] [PubMed] [Google Scholar]
- 36.Chen JR, Jia XH, Wang H, Yi YJ, Wang JY, Li YJ. Timosaponin A-III reverses multi-drug resistance in human chronic myelogenous leukemia K562/ADM cells via downregulation of MDR1 and MRP1 expression by inhibiting PI3K/Akt signaling pathway. International journal of oncology. 2016;48(5):2063–2070. doi: 10.3892/ijo.2016.3423. [DOI] [PubMed] [Google Scholar]
- 37.Burk U, Schubert J, Wellner U, et al. A reciprocal repression between ZEB1 and members of the miR-200 family promotes EMT and invasion in cancer cells. EMBO reports. 2008;9(6):582–589. doi: 10.1038/embor.2008.74. [DOI] [PMC free article] [PubMed] [Google Scholar]
- 38.Bommi PV, Dimri M, Sahasrabuddhe AA, Khandekar J, Dimri GP. The polycomb group protein BMI1 is a transcriptional target of HDAC inhibitors. Cell Cycle. 2010;9(13):2663–2673. doi: 10.4161/cc.9.13.12147. [DOI] [PMC free article] [PubMed] [Google Scholar]
Associated Data
This section collects any data citations, data availability statements, or supplementary materials included in this article.


