Abstract
Lafora disease (LD) is a fatal neurodegenerative disorder caused mostly by mutations in either of two genes encoding laforin and malin. LD is characterized by accumulation of a poorly-branched form of glycogen in the cytoplasm of neurons and other cells. We previously reported dysfunctional mitochondria in different LD models. Now, using mitochondrial uncouplers and respiratory chain inhibitors, we have investigated with human fibroblasts a possible alteration in the selective degradation of damaged mitochondria (mitophagy) in LD. By flow cytometry of MitoTracker labelled cells and measuring the levels of various mitochondrial proteins by Western blot, we found in LD fibroblasts a partial impairment in the increased mitochondrial degradation produced by these treatments. In addition, colocalization of mitochondrial and lysosomal markers decreased in LD fibroblasts. All these results are consistent with a partial impairment in the induced autophagic degradation of dysfunctional mitochondria in LD fibroblasts. However, canonical recruitment of Parkin to mitochondria under these conditions remained unaffected in LD fibroblasts, and also in SH-SY5Y cells after malin and laforin overexpression. Neither mitochondrial localization nor protein levels of Bcl-2-like protein 13, another component of the mitophagic machinery that operates under these conditions, were affected in LD fibroblasts. In contrast, although these treatments raised autophagy in both control and LD fibroblasts, this enhanced autophagy was clearly lower in the latter cells. Therefore, the autophagic degradation of altered mitochondria is impaired in LD, which is due to a partial defect in the autophagic response and not in the canonical mitophagy signalling pathways.
Keywords: Lafora disease, mitophagy, autophagy, mitochondria, human fibroblasts
Graphical abstract
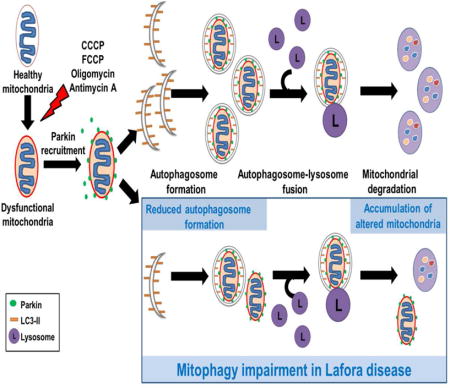
The degradation of altered mitochondria (mitophagy) after treatment with uncouplers or inhibitors of the mitochondrial respiratory chain is partially impaired in fibroblasts derived from Lafora disease patients. This impairment is not due to a defect in the canonical parkin-dependent mitophagy signalling pathway but to a diminished formation of the autophagosomes that degrade those mitochondria.
INTRODUCTION
Lafora progressive myoclonus epilepsy, also called Lafora disease (LD, OMIM 254780), is a rare, fatal, autosomal and recessive neurodegenerative disorder. It starts between the ages of 8 and 18 years with tonic-clonic seizures, myoclonus, absences, drop attacks and visual hallucinations, which rapidly drive the patient to a cognitive decline with dementia, apraxia, aphasia and visual loss. Finally, death follows, usually about ten years after onset of the first symptoms of the disease ([1], [2]). LD occurs worldwide, but most commonly in southern Europe, northern Africa, India and the Middle East. A hallmark of LD is the presence of distinctive inclusions called Lafora bodies (LBs, see [3] for a review). They are present in the cytoplasm of brain neurons, but also in cells from different peripheral tissues, especially those with high glucose metabolism such as liver, heart and skeletal muscle. LBs are mainly made up of polyglucosans, which are an abnormal, heavily phosphorylated and poorly branched form of glycogen that resembles amylopectin [4].
Although there is also evidence of a third minor locus [5], LD is caused mainly (more than 90% of all cases) by mutations in either of two different genes. The first, EPM2A [6], encodes a 38 kDa (331 amino acids) dual-specificity phosphatase called laforin, which is the most frequently mutated protein in LD. The second, EPM2B [7], encodes a 42 kDa (395 amino acids) RING type E3-ubiquitin ligase called malin, which polyubiquitinates different substrates, such as laforin [8], glycogen synthase [9], glycogen debranching enzyme [10], protein targeting to glycogen [11] and AMP-activated protein kinase [12].
It has been found that laforin and malin form a complex, which has been suggested to degrade proteins involved in the regulation of glycogen metabolism [9], and to also clear misfolded proteins via the ubiquitin-proteasome system [13]. Laforin, through its capacity to dephosphorylate polysaccharides [14], can prevent the excessive phosphorylation of glycogen that leads to its aggregation in the form of polyglucosans [15]. Therefore, LD could be caused by the accumulation of misfolded proteins and/or could result from an error of carbohydrate metabolism. In any case, patients with mutated laforin or malin are clinically indistinguishable and both proteins appear to be involved in a same pathway that produces the disease. However, the pathogenic mechanism of LD remains unclear despite extensive studies.
Mitochondrial dysfunction has been frequently associated with several neurodegenerative disorders because of the high dependence of neurons on oxidative energy metabolism [16]. In fact, our own studies conducted in various LD models have described mitochondrial alterations, including decreases in both mitochondrial membrane potential and ATP levels, as well as oxidative stress due to increased ROS production and aggravated by an impaired antioxidant response ([17], [18]). Here, to further define the sequence of alterations in LD, we tested if a defect in the degradation of dysfunctional mitochondria exists. We investigated if the selective autophagic degradation of altered mitochondria (i.e., mitophagy) is affected in human malin- or laforin-deficient fibroblasts after treating the cells with various uncouplers and inhibitors that alter mitochondrial function while leaving intact other organelles, such as peroxisomes [19]. To this end, we used first, with similar results, carbonyl cyanide m-chlorophenylhydrazone (CCCP) and p-trifluoromethoxyphenylhydrazone (FCCP). Although CCCP and FCCP are the most widely used compounds to study mitophagy, it has been described that, besides causing mitochondrial membrane depolarization, they may also depolarize the cell membrane ([20], [21]). Therefore in these studies, we also used a combination of oligomycin, which inhibits mitochondrial complex V (ATP synthase), and antimycin A, which inhibits mitochondrial complex III [22]. We found that the selective autophagic degradation of altered mitochondria induced by any of these poisons was partially impaired in both laforin- and malin-deficient fibroblasts and that this is due to a general defect in the autophagic mechanism and not in the canonical parkin-dependent signalling to mitophagy of defective mitochondria.
RESULTS
Mitophagy is defective in fibroblasts from LD patients
We started these experiments analyzing in human fibroblasts the effects of CCCP, an uncoupler of mitochondrial oxidative phosphorylation, on mitochondrial morphology. As expected [23], this treatment changed the interconnected tubular network of mitochondria observed in the human fibroblasts labelled with MitoTracker Red (Fig. 1A) so that its appearance became more fragmented (Fig. 1B). This is indicative of the specific alteration in mitochondrial function induced by this reagent. Similar results were obtained using another mitochondrial uncoupling reagent, FCCP [21] (Fig. 1C), or a combination of the respiratory chain inhibitors oligomycin and antimycin A [22] (Fig. 1D). All the following experiments were carried out by treating cells independently with all these reagents, and essentially the same results were obtained.
Figure 1. Effects of CCCP, FCCP or oligomycin plus antimycin A on mitochondrial morphology in human fibroblasts.
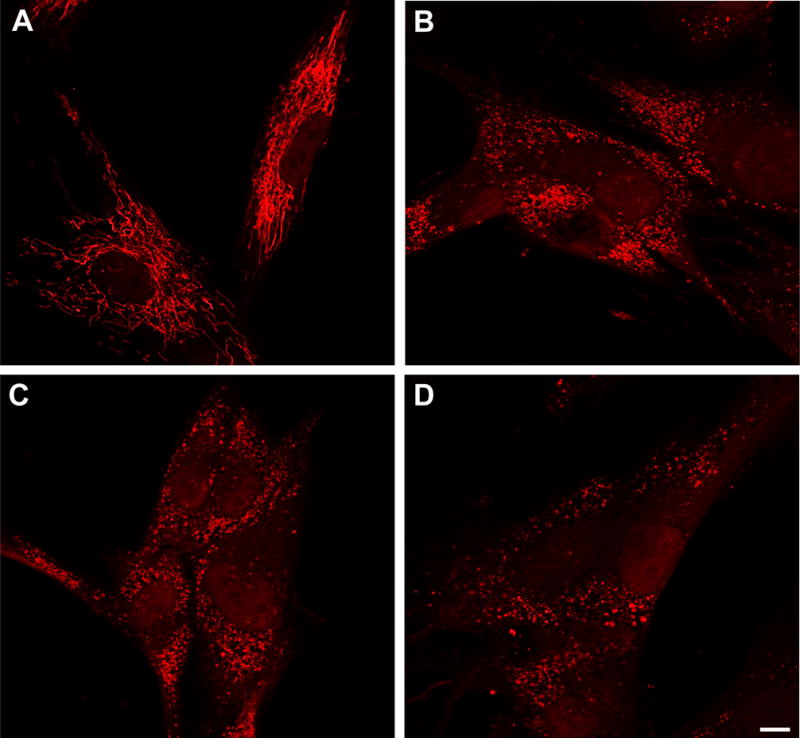
Control fibroblasts were stained with 100 nM MitoTracker Red for 30 min at 37 °C and then incubated for 18 h in the absence (A) or in the presence of 10 μM CCCP (B), 10 μM FCCP (C) or 10 μM oligomycin plus 1 μM antimycin A (D). Cells were observed by fluorescence microscopy. The tubular mitochondrial network of untreated cells (A) is fragmented after all these treatments (B-D). Bar: 10 μm.
Next, we assessed the selective degradation of altered mitochondria (mitophagy) in LD fibroblasts after the above mentioned treatments. A widely employed method to analyse whole mitochondrial degradation is to measure, by flow cytometry, the decrease in the fluorescence intensity of MitoTracker Red stained cells ([24], [25]). As shown in Figure 2, we incubated the fibroblasts from the controls (A-C), laforin- (D-F) and malin-deficient (G-I) patients with MitoTracker Red for 30 min at 37°C and measured, by flow cytometry, the fluorescence intensity of the probe after 18 h of growth in the presence (Fig. 2B, E and H), or not (Fig. 2A, D and G), of 10 μM CCCP, or as a control, with 10 μM CCCP plus 10 mM 3-methyladenine (Fig. 2C, F and I), an inhibitor of autophagy ([26], [27]). Since CCCP has been described to not affect the mitochondrial retention of the Mitotracker stain [24], loss of fluorescence in the presence of this compound should correspond to degradation of mitochondria. We found (Fig. 2J) that the decrease in MitoTracker Red fluorescence after CCCP treatment was significantly lower in the fibroblasts from LD patients (reduction of 33.7±1.6% and 33.1±2.1%, respectively, in laforin- and malin-deficient fibroblasts) than in their controls (reduction of 47.7±1.9%). These results also showed that the specific degradation of damaged mitochondria was reduced to an almost identical extent in the laforin- and malin-deficient fibroblasts.
Figure 2. Fluorescence microscopy and analysis by flow cytometry of control and LD fibroblasts stained with MitoTracker Red in the presence or absence of mitochondrial inhibitors/uncouplers.
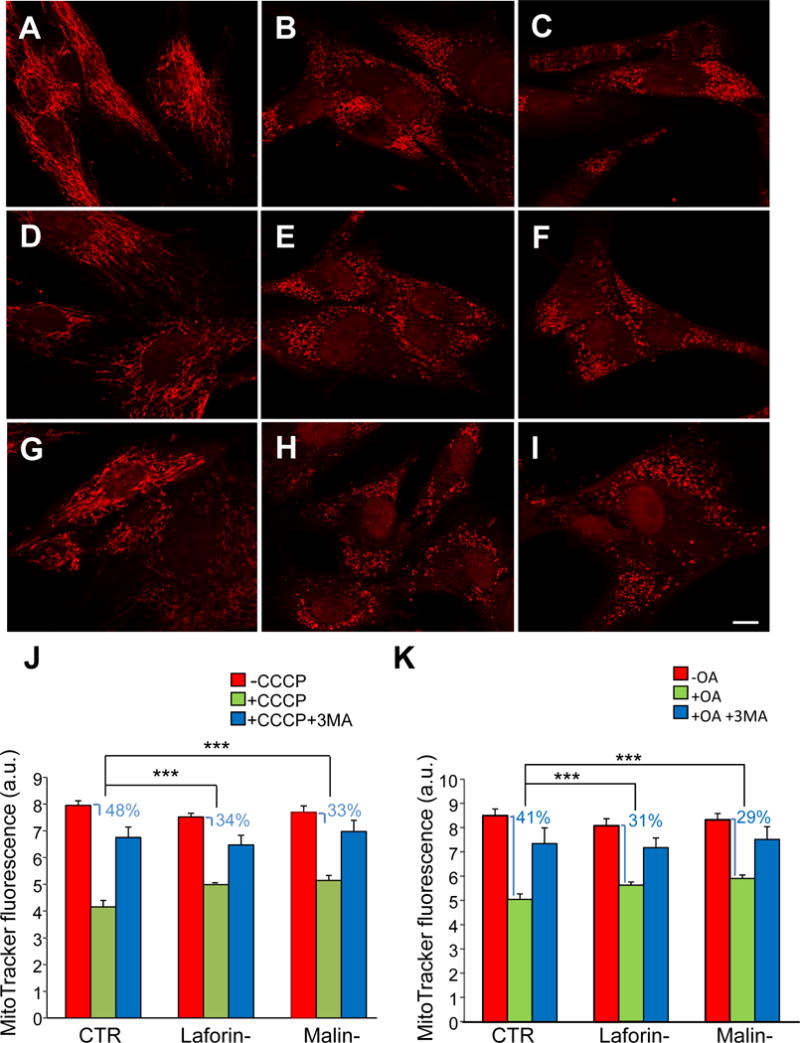
Fibroblasts from controls (A, B and C) and patients with LD, laforin- (D, E and F) and malin-deficient (G, H and I), were incubated first for 30 min at 37 °C with MitoTracker Red and then for 18 h in full medium without (A, D and G) or with 10 μM CCCP (B, E and H) or 10 μM CCCP plus 10 mM 3-methyladenine (C, F and I). Representative fluorescence microscopy images of control (C-1), laforin- (L-2) and malin-deficient (M-1) fibroblasts are shown (A-I). A slightly lower MitoTracker Red fluorescence was consistently observed in untreated LD fibroblasts (D and G) when compared to controls (A), most probably due to the decrease in mitochondrial membrane potential described by us in fibroblasts from LD patients [17]. Bar: 10 μm. Cells were analysed by flow cytometry (J and K, for CCCP and oligomycin plus antimycin A treatment, respectively) and results expressed as means of arbitrary units (a.u.) and standard deviations from three different experiments. CTR: mean values from C-1 and C2 cells; Laforin-: mean values from L-1 and L-2 cells; Malin-: M-1 cells. Red bars (-CCCP or -OA): untreated cells; green bars (+CCCP or +OA): cells treated with 10 μM CCCP or 10 μM oligomycin and 1 μM antimycin; blue bars (+CCCP+3MA or +OA+3MA): cells treated with 10 μM CCCP or 10 μM oligomycin and 1 μM antimycin plus 10 mM 3-methyladenine. The decrease in fluorescence produced by CCCP or OA is also indicated in percentage. Differences were found to be statistically significant at ***P<0.0001. No significant differences were observed between laforin- and malin-deficient fibroblasts.
Similar results were obtained with oligomycin plus antimycin A (Fig. 2K) or with FCCP (data not shown). Finally as expected, the decrease in fluorescence produced by CCCP, FCCP and oligomycin plus antimycin A was strongly abolished when 3-methyladenine was added in combination with these reagents (Fig. 2).
To confirm these results we investigated, by Western blot, the degradation of proteins from different mitochondrial compartments, induced in various cells by all these treatments. The following mitochondrial proteins were herein analyzed in the treated and untreated cells: the voltage-dependent anion-selective channel (VDAC1) from the outer membrane, dynamin like GTPase OPA1 and subunit A of the succinate dehydrogenase complex (SDHA) from the inner membrane, and glutamate dehydrogenase (GDH) and pyruvate dehydrogenase (PDH) from the mitochondrial matrix. To discard a possible defect in the import of mitochondrial proteins encoded by the nuclear genome, we also analysed a protein encoded by the mitochondrial genome, namely cytochrome c oxidase, subunit 4 (COX IV) from the inner membrane. In these experiments, the cells were incubated in full medium as before (Fig. 2), and also in a starvation medium (KH) to increase the autophagic response. In addition, and because the treatments employed here do not affect peroxisomes [19], catalase was also included as a negative control and tubulin was used as loading control. Figure 3 shows an example of these experiments. In control cells, the levels of all mitochondrial proteins decreased after 18 h of CCCP treatment, independently of whether they were cultured during the last 4 h in full (Fig. 3A and C) or in KH (Fig. 3B and D) media. However, this decrease was always less severe in laforin- and malin-deficient fibroblasts compared to controls. In contrast and under the same conditions, no drop in the levels of the peroxisomal protein catalase was found. This indicates that the observed decrease in the levels of the mitochondrial proteins produced by the CCCP treatment was not due to a general degradation of all cell proteins, but to a specific degradation of the mitochondria altered by these treatments and of their proteins. Similar results were obtained incubating the cells with FCCP (data not shown) or oligomycin plus antimycin A (Fig. 4).
Figure 3. Degradation of mitochondrial proteins in control and in LD fibroblasts in the presence or absence of CCCP.
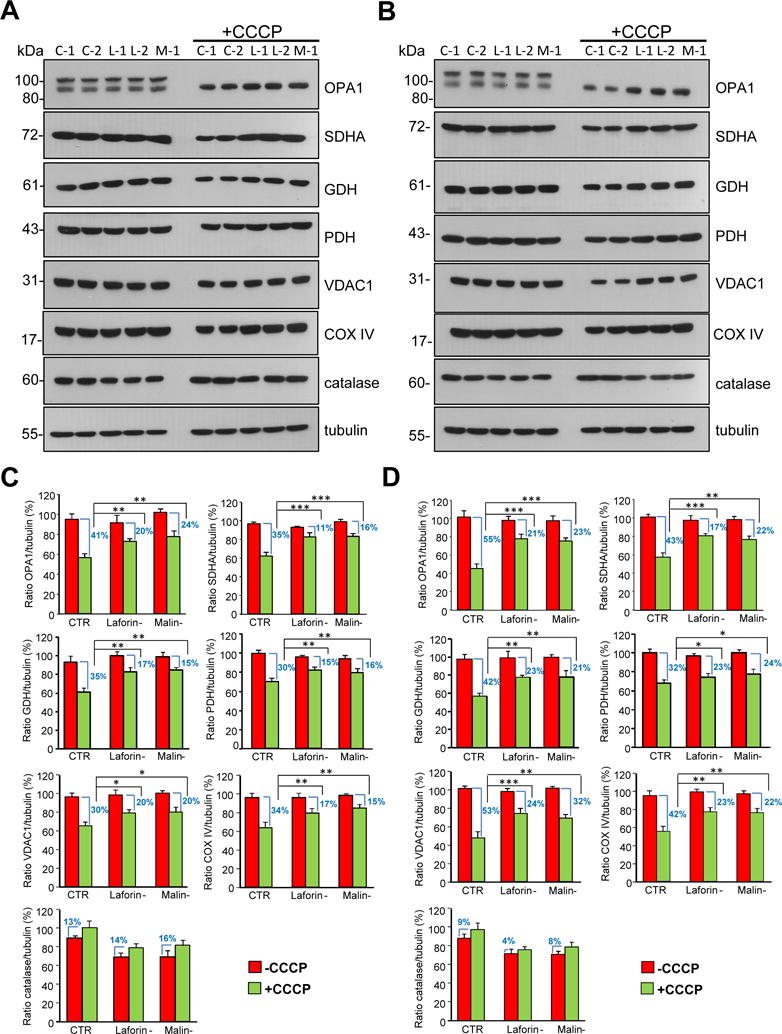
Fibroblasts from controls (C-1 and C-2) and patients with LD, laforin- (L-1 and L-2) and malin-deficient (M-1), were incubated for 18 h in full medium without or with (+CCCP) 10 μM CCCP, as indicated. For the last 4 h, fibroblasts were incubated in full (A) or in KH (B) media with and without CCCP as corresponds. Cellular extracts (75 μg protein) were analysed by Western blot using specific antibodies towards the following mitochondrial proteins: OPA1, SDHA, GDH, PDH, VDAC1 and COX IV. Antibodies towards catalase and tubulin were also used as negative and loading controls, respectively. Notice in the OPA1 blots that CCCP induces a proteolytic processing of the heavy molecular weight band leading to its disappearance, in agreement with results from others [49]. The histograms (C and D) show the densitometric quantifications of the band intensities of the indicated proteins relative to tubulin from control (CTR: mean values from C-1 and C2 cells), laforin- (Laforin-: mean values from L-1 and L-2 cells) and malin-deficient (Malin-: M-1 cells) fibroblasts treated (+CCCP, green bars) or not (-CCCP, red bars) as above and incubated during the last 4 h of the 18 h incubation in full (C) or in KH (D) media. Results are the mean and standard deviation from three independent experiments and are shown as percentage of the highest control value of each protein ratio. The difference in the levels of the corresponding proteins produced by the CCCP treatment in the various cells is also indicated as percentage. Differences were found to be statistically significant at *P<0.01, **P<0.001 and ***P<0.0001. No significant differences were observed between laforin- and malin-deficient fibroblasts.
Figure 4. Degradation of mitochondrial proteins in control and in LD fibroblasts in the presence or absence of oligomycin plus antimycin A.
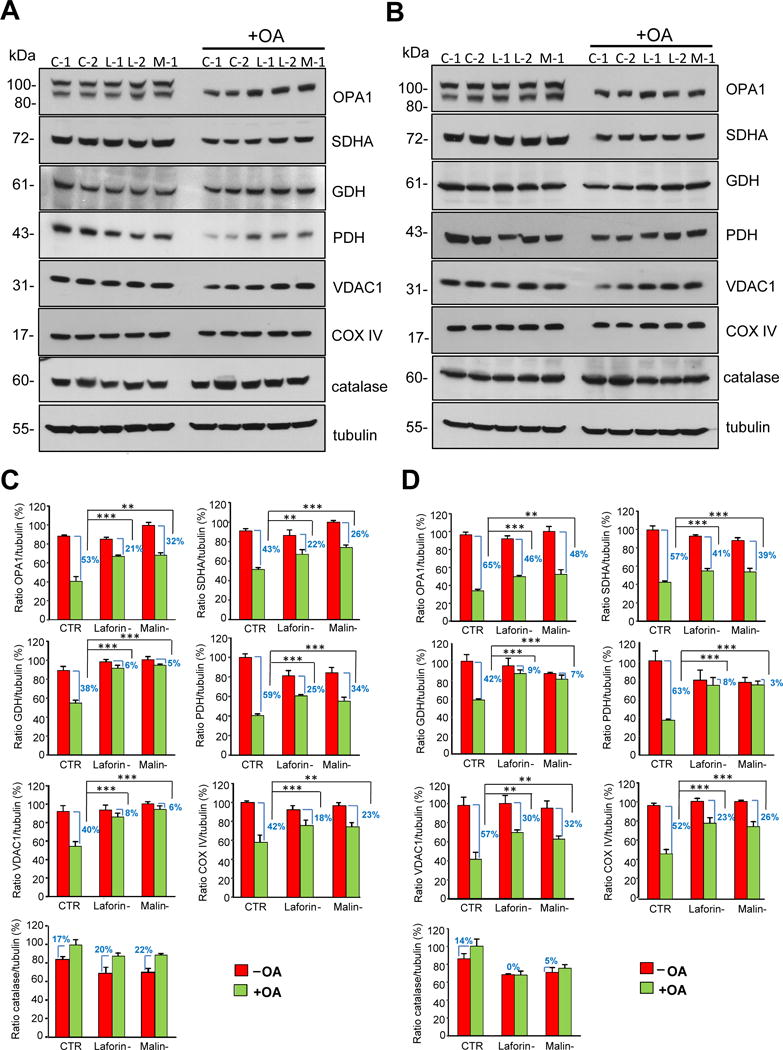
Fibroblasts from controls (C-1 and C-2) and patients with LD, laforin- (L-1 and L-2) and malin-deficient (M-1), were incubated for 18 h in full medium without or with (+OA) 10 μM oligomycin plus 1 μM antimycin A, as indicated. For the last 4 h fibroblasts were incubated in full (A) or in KH (B) media with and without oligomycin plus antimycin A as corresponds. Cellular extracts (75 μg protein) were analysed by Western blot using specific antibodies towards the following mitochondrial proteins: OPA1, SDHA, GDH, PDH, VDAC1 and COX IV. Antibodies towards catalase and tubulin were also used as negative and loading controls, respectively. The histograms below (C and D) show the densitometric quantifications of the band intensities of the indicated proteins relative to tubulin from control (CTR: mean values from C-1 and C2 cells), laforin- (Laforin-: mean values from L-1 and L-2 cells) and malin-deficient (Malin-: M-1 cells) fibroblasts treated (+OA, green bars) or not (-OA, red bars) as above and incubated during the last 4 h of the 18 h incubation in full (C) or in KH (D) media. Results are the mean and standard deviation from three independent experiments and are shown as percentage of the highest control value of each protein ratio. The difference in the levels of the corresponding proteins produced by the oligomycin plus antimycin A treatment in the various cells is also indicated as percentage. Differences were found to be statistically significant at **P<0.001 and ***P<0.0001. No significant differences were observed between laforin- and malin-deficient fibroblasts.
In summary, the MitoTracker Red and the Western blot results well agree and indicate that: i) the degradation of the altered mitochondria induced by all these treatments is partially impaired in the laforin- and malin-deficient fibroblasts, and ii) this impairment occurs to a similar extent in both types of LD fibroblasts.
Another way to analyse mitophagy is to investigate, by fluorescence microscopy, the colocalization of mitochondria and lysosomes, after inhibition of lysosomal activity to prevent the degradation of mitochondria within lysosomes (Fig. 5). To stain the mitochondria and lysosomes we first used MitoTracker Red and anti-LAMP2 antibody (a marker of the lysosomal membrane) respectively. When the cells were treated with CCCP, we observed a significant reduction (Fig. 5E) in the colocalization of both stains in fibroblasts from the LD patients (Fig. 5C and D) compared to their controls (Fig. 5A and B). Moreover, no differences were found between the laforin- and malin-deficient fibroblasts in this colocalization. Similar results were obtained with FCCP (data not shown) or after oligomycin plus antimycin A treatment (Fig. 6), and also when a different mitochondrial marker (anti-TOM20 antibody) was used. These results once again support the notion that in LD fibroblasts, the selective degradation of altered mitochondria by lysosomes (mitophagy) is impaired to a great extent. Therefore, we next attempted to determine the mechanisms by which this impairment occurs.
Figure 5. Colocalization of mitochondrial and lysosomal markers in control and LD fibroblasts in the presence or absence of CCCP.
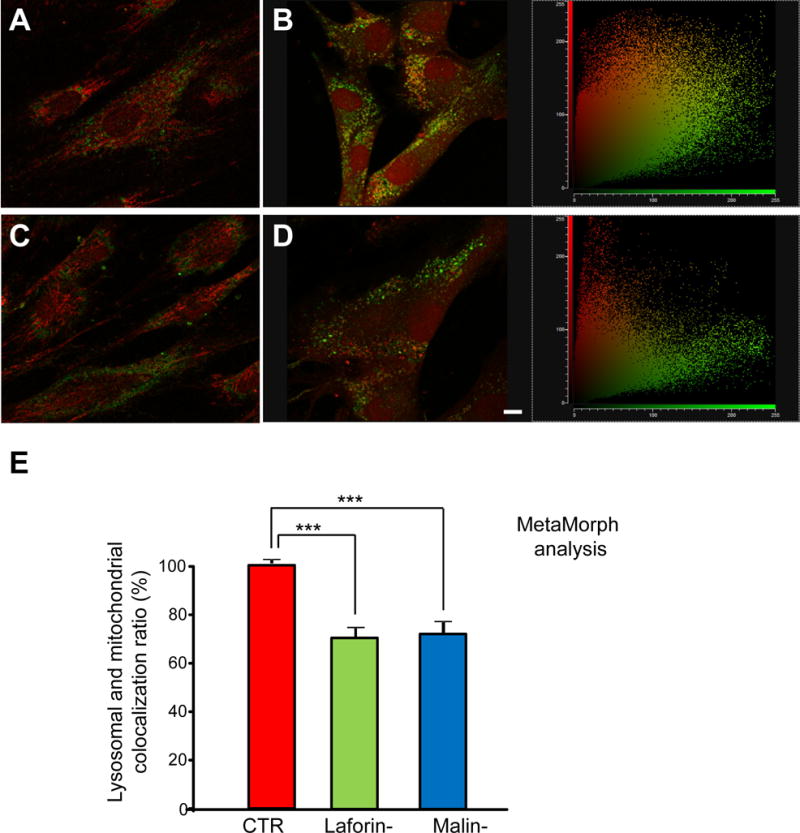
Fibroblasts from controls and laforin- and malin-deficient patients were stained with 100 nM MitoTracker Red for 30 min at 37 °C, washed and then treated or not with 10 μM CCCP in full medium for 18 h. Lysosomal inhibitors (100 μM leupeptin and 1 μM pepstatin A) were added for the last 2 h of the 18 h incubation period. Then, fibroblasts were immunostained with anti-LAMP2. Representative fluorescence microscopy images of control (C-1, A and B) and LD (L-2, C and D) fibroblasts, treated (B and D) or not (A and C) with CCCP. Two-dimensional scatter plots corresponding to red (mitochondria) and green (lysosomes) pixel intensities from B and D are shown on their rights. Bar: 10 μm. The histogram (E) shows the quantification (mean and standard deviation as percentage of the highest control value) of MitoTracker Red and LAMP2 colocalization after CCCP treatment in the different cells using MetaMorph software (CTR: mean values from C-1 and C2 cells; Laforin-: mean values from L-1 and L-2 cells; Malin-: M-1 cells). The colocalization of mitochondria with lysosomes is reduced in LD fibroblasts (Laforin-, green bars and Malin-, blue bars) compared to controls (CTR, red bars). Experiments were performed in duplicate, analysing 40 cells for each cell line. Differences were found to be statistically significant at ***P<0.0001. No significant differences were observed between laforin- and malin-deficient fibroblasts.
Figure 6. Colocalization of mitochondrial and lysosomal markers in control and LD fibroblasts in the presence or absence of oligomycin plus antimycin A.
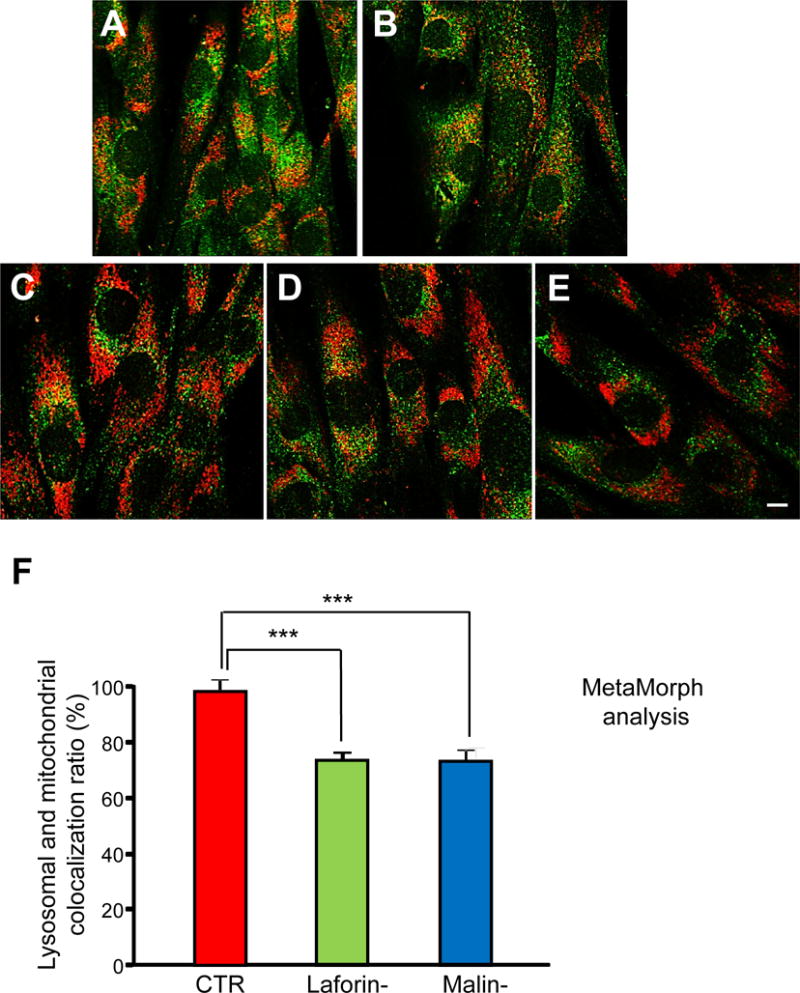
Fibroblasts from controls (C-1 and C-2, A and B, respectively), and laforin- (L-1 and L-2, C and D, respectively) and malin-deficient (M-1, E) patients were treated with 10 μM oligomycin plus 1 μM antimycin A in full medium for 18 h. Lysosomal inhibitors (100 μM leupeptin and 1 μM pepstatin A) were added for the last 2 h of the 18 h incubation period. Then, fibroblasts were immunostained with anti-LAMP2 (green) and anti-TOM20 (red). Representative fluorescence microscopy images are shown. Bar: 10 μm. The histogram (F) shows the quantification (mean and standard deviation as percentage of the highest control value) of TOM20 and LAMP2 colocalization after oligomycin plus antimycin A treatment in the different cells using MetaMorph software. The colocalization of mitochondria with lysosomes is reduced in LD fibroblasts (Laforin-, green bars, and Malin-, blue bars) compared to controls (CTR, red bars). Experiments were performed in duplicate, analysing 40 cells for each cell line. Differences were found to be statistically significant at ***P<0.0001. No significant differences were observed between laforin- and malin-deficient fibroblasts.
Recruitment of Parkin to altered mitochondria is not affected in fibroblasts from LD patients or in SH-SY5Y cells after laforin and malin overexpression
As LD fibroblasts would appear to be unable to properly degrade dysfunctional mitochondria after the CCCP, FCCP or oligomycin plus antimycin A treatments, we first investigated if mitophagy signalling is defective in LD fibroblasts. The E3-ubiquitin ligase Parkin participates in the canonical and main mechanism to selectively recognize and remove damaged mitochondria by macroautophagy, and it has been shown that the mitochondria damaged by a CCCP treatment recruit Parkin [28]. Therefore, we investigated a possible defect in LD fibroblasts in the recognition of the altered mitochondria by Parkin. As shown in Figure 7A, the treatment of the different fibroblasts with CCCP produced a strong recruitment of EGFP-Parkin to mitochondria, identified with an anti-CYTC antibody (see the merge of the fluorescent images after the CCCP treatment). The translocation of EGFP-Parkin to mitochondria occurred in both types of LD fibroblasts, and showed no significant differences from the control fibroblasts (Fig. 7B). The same results were obtained after treatment with oligomycin plus antimycin A or with FCCP (data not shown). Therefore, it would appear that in the fibroblasts from LD patients lacking laforin or malin, Parkin is normally recruited to dysfunctional mitochondria.
Figure 7. Parkin is recruited to mitochondria upon CCCP treatment in fibroblasts from LD patients lacking laforin or malin.
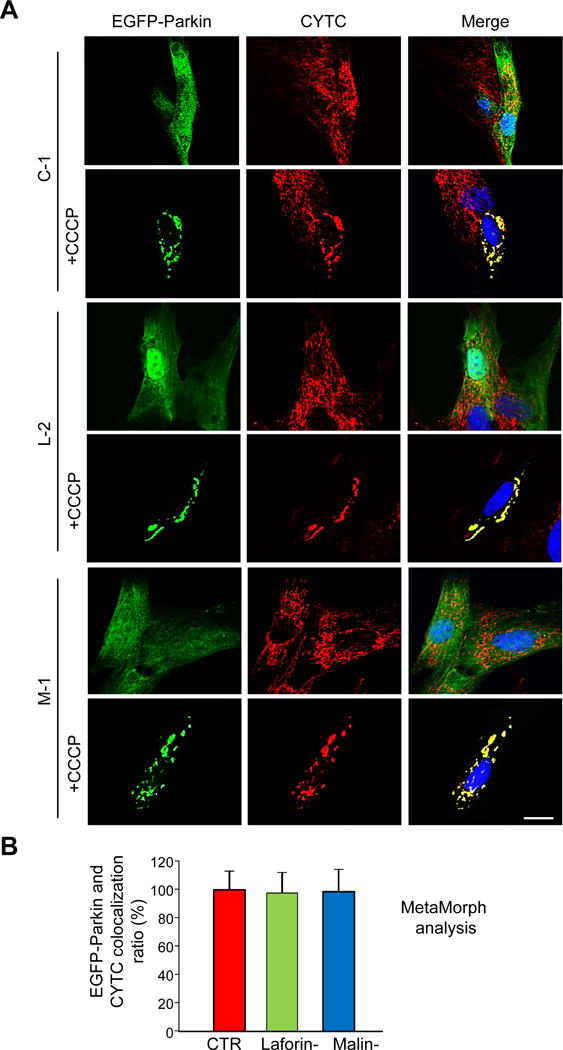
Fibroblasts from controls (CTR: C-1 and C-2) and laforin- (Laforin-: L-1 and L-2) and malin-deficient (Malin-: M-1) patients were transfected for 24 h with pEGFP-Parkin and then treated (+CCCP) or not with 10 μM CCCP in full medium for 4 h. Proteins were localized either by direct fluorescence (EGFP-Parkin, first column of images) or by immunofluorescence using anti-CYTC (second column). Cell nuclei were stained with DAPI and the third column shows the corresponding merge images. Representative images of control (C-1) and laforin- (L-2) and malin-deficient (M-1) fibroblasts are shown (A). Bar: 20 μm. The histogram (B) shows the quantification (mean and standard deviation as percentage of the highest control value) of EGFP-Parkin and CYTC colocalization after CCCP treatment in the different cells using MetaMorph software. No significant differences were found in the colocalization of EGFP-Parkin and CYTC in LD fibroblasts (Laforin-, mean values from L-1 and L-2, green bars; Malin-, M-1 cells, blue bars) compared to controls (CTR, mean values from C-1 and C2 cells, red bars).
We also used neuroblastoma SH-SY5Y cells to check the effects of laforin and malin on the localization of Parkin upon these treatments. In these cells we found that silencing of laforin using siRNA (Fig. 8B) or overexpressing laforin and malin (Fig. 8C) did not modify the Parkin translocation induced by CCCP (Fig. 8A). Moreover, after overexpression of laforin and malin, none of these proteins colocalized with mitochondria in CCCP-treated or untreated cells (Fig. 9). Therefore, it was not possible to explain the alteration observed in the LD fibroblasts of the mitochondrial degradation induced by CCCP and by the other treatments with a defect in the recruitment and recognition of the damaged mitochondria by Parkin. Although this is the main mechanism of mitophagy signalling under the conditions used in these experiments, we also analyzed an alternative pathway of mitophagy that involves BCL2L13 (Fig. 10). Once again, we obtained the same results with the control and LD fibroblasts, treated or not with CCCP. Therefore, the canonical mitophagy signaling pathway that operates under the conditions used herein is not affected in the fibroblasts from LD patients.
Figure 8. Parkin translocation to mitochondria is neither affected by laforin silencing nor by overexpression of laforin and malin.
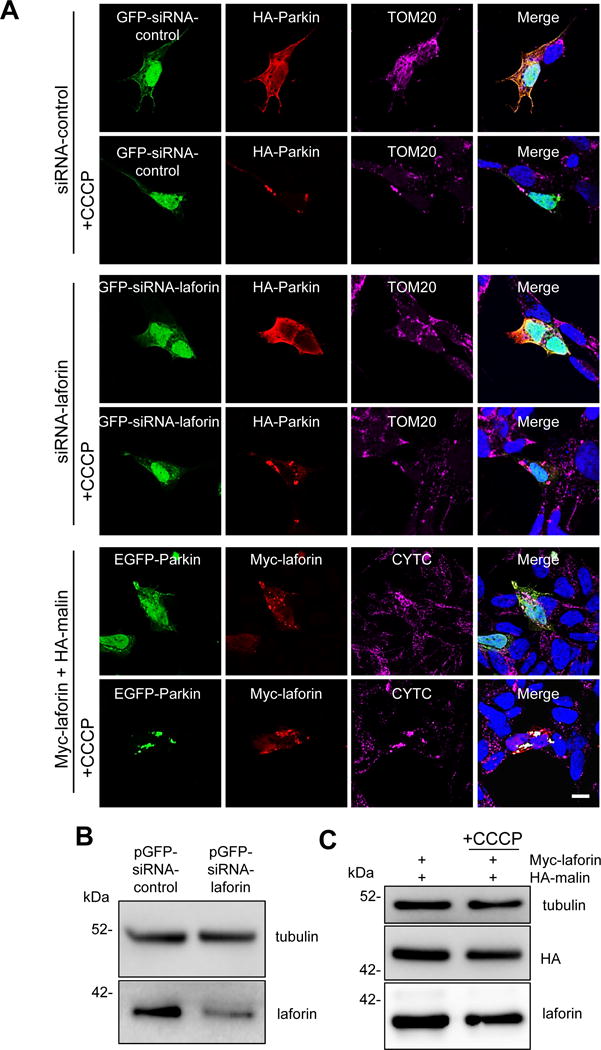
SH-SY5Y cells were transfected for 24 h with pGFP-siRNA-control and HA-Parkin plasmids (first and second rows of images), with pGFP-siRNA-laforin (to silence laforin expression) and HA-Parkin plasmids (third and fourth rows) or with pEGFP-Parkin and Myc-laforin and HA-malin plasmids (fifth and six rows). Then, they were treated (+CCCP) or not with 10 μM CCCP in full medium for 4 h. Proteins were localized either by direct fluorescence (GFP-expressing plasmids) or by immunofluorescence using anti-HA, anti-Myc, anti-TOM20 or anti-CYTC as indicated. Cell nuclei were stained with DAPI and the fourth column shows the corresponding merge images. A representative image is presented in each case (A). Bar: 10 μm. To test the laforin silencing, SH-SY5Y cells were transfected with pGFP-siRNA-control and pGFP-siRNA-laforin plasmids. After 24 h of transfection, cellular extracts were prepared and the levels of endogenous laforin were analysed by Western blot using anti-laforin antibody and also anti-tubulin antibody as loading control (B). We found around 60% reduction in the levels of endogenous laforin. To check the overexpression levels, cellular extracts were prepared and the levels of laforin and malin were analysed by Western blot using anti-laforin and anti-HA antibodies, respectively (C). Tubulin was used as loading control. No differences were found in cells treated or not with CCCP.
Figure 9. Subcellular localization of overexpressed laforin and malin in SH-SY5Y cells.
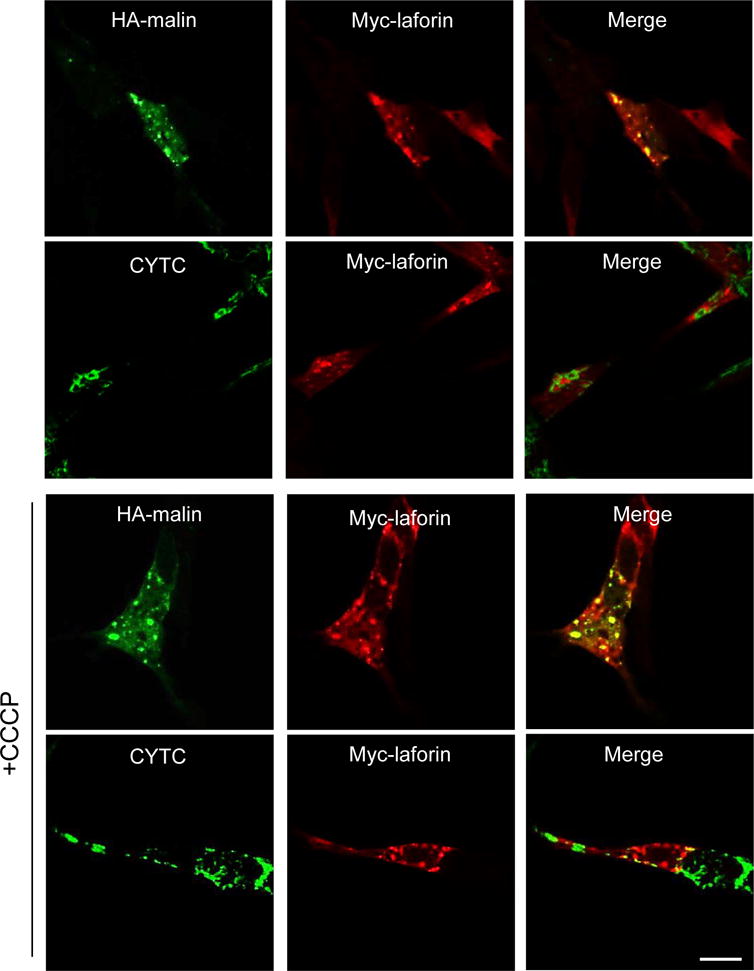
Cells were transfected with a combination of plasmids expressing Myc-laforin and HA-malin. 24 h later, cells were treated or not with 10 μM CCCP for 4 h. Then, subcellular localization of the different proteins was assessed by immunofluorescence using anti-HA, anti-Myc or anti-CYTC antibodies. Fluorescence associated to the corresponding proteins was analysed by confocal microscopy. The third column shows the corresponding merge images. Laforin and malin do not translocate to mitochondria upon CCCP treatment. Bar: 10 μm.
Figure 10. Effect of CCCP treatment on the detection of BCL2L13 in control and in LD fibroblasts.
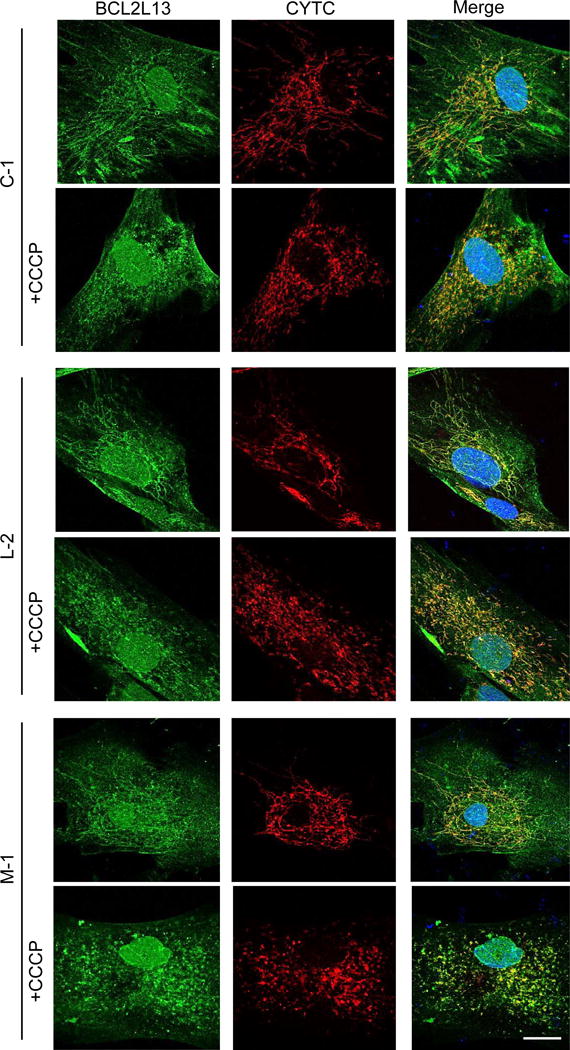
Control (CTR: C-1 and C-2), laforin- (Laforin-: L-1 and L-2) and malin-deficient (Malin-: M-1) fibroblasts were treated (+CCCP) or not with 10 μM CCCP in full medium for 4 h. The endogenous localization of BCL2L13 (first column) and CYTC (second column) proteins were compared by immunofluorescence using anti-BCL2L13 and anti-CYTC. Representative images of control (C-1) and laforin- (L-2) and malin-deficient (M-1) fibroblasts are shown. Cell nuclei were stained with DAPI and the third column shows the corresponding merge images. Bar: 20 μm.
The defective degradation of altered mitochondria in fibroblasts from LD patients can be explained by a partial impairment in autophagosome formation
Essentially and in short, the results presented so far indicate reduced lysosomal degradation of mitochondria and their proteins in LD fibroblasts which cannot be explained by defects in canonical Parkin- and BCL2L13-dependent mitophagy. Therefore, we assessed if the second step in the mitophagy of the Parkin-signalled mitochondria, namely the autophagic engulfment and degradation of the altered mitochondria, was affected in LD fibroblasts after the different treatments (CCCP, FCCP or oligomycin plus antimycin A) herein employed.
Although there are various procedures to monitor autophagy, it is widely accepted that changes in the levels of lipidated LC3 (LC3-II) in the presence of lysosomal inhibitors accurately reflect alterations in autophagosome formation ([29], [30]). Therefore, the control and LD fibroblasts were incubated, or not, with CCCP, FCCP or oligomycin plus antimycin A for 18 h as before (in full and KH media) and lysosomal inhibitors were added in the last 2 h of the treatments. As shown in Figure 11 (for CCCP treatment) and in the Figure 12 (for oligomycin plus antimycin A treatment), these treatments strongly increased the LC3-II levels in the fibroblasts incubated both in full (Fig. 11A and C and Fig. 12A and C) and in KH (Fig. 11B and D, and Fig. 12B and D) media. These results agree with the previously described induction of macroautophagy by CCCP [31]. However, in the case of LD fibroblasts grown either in full or KH media, we observed lower LC3-II levels under all conditions, compared to the corresponding control fibroblasts (Fig. 11 and Fig. 12). These results were also supported by immunofluorescence studies using anti-LC3 and counting the number of LC3 puncta per cell, which are believed to correspond to the number of autophagosomes [29]. These numbers markedly increased in the presence of CCCP in full (Fig. 13A and C) or in KH (Fig. 13B and D) media, but they were always lower in laforin- and malin-deficient fibroblasts. Similar results were obtained using FCCP or a combination of oligomycin plus antimycin A (data not shown). Note that in all these experiments, no significant differences in LC3-II levels were seen between the laforin- or malin-deficient cells, which indicates that the defect in autophagy, like the impairment in the degradation of mitochondria and their proteins (see Figs. 2–6), occurs to the same extent in EPM2A and in EPM2B mutated fibroblasts. Therefore, all these results suggest that a defect in the formation of autophagic vacuoles is responsible for the reduced mitophagy observed in the laforin- and malin-deficient fibroblasts.
Figure 11. LC3-II levels in control and in LD fibroblasts in the presence or absence of CCCP.
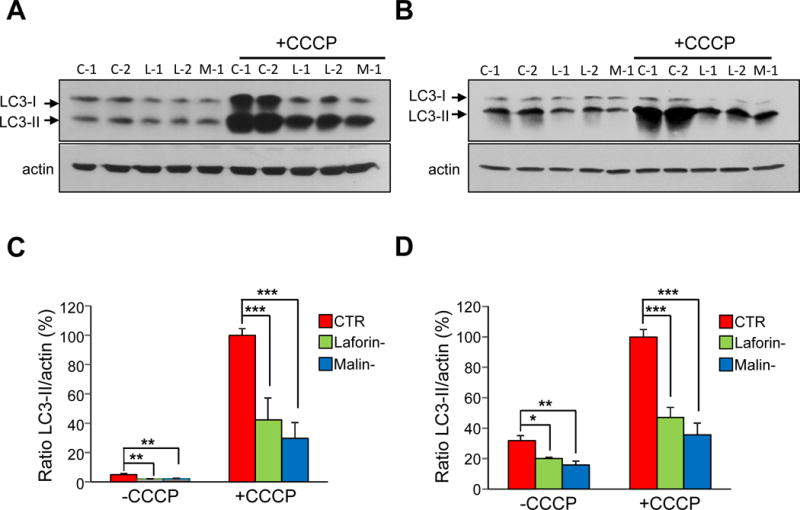
Fibroblasts from controls (CTR: C-1 and C-2) and patients with LD, laforin- (Laforin-: L-1 and L-2) and malin-deficient (Malin-: M-1) were incubated for 18 h in full medium without (-CCCP) or with (+CCCP) 10 μM CCCP, as indicated. For the last 2 h of the CCCP treatment, fibroblasts were incubated in full or in KH media containing lysosomal inhibitors (20 mM ammonium chloride and 100 μM leupeptin). Cellular extracts (75 μg protein) were analysed by Western blot using anti-LC3 and anti-actin. Representative immunoblots for full (A) and KH (B) media are shown. The ratio of LC3-II to actin levels in control (CTR, red bars), laforin-deficient (Laforin-, green bars) and malin-deficient (Malin-, blue bars) fibroblasts was determined densitometrically and normalized in percentage to the highest control value (C and D, for full and KH media, respectively). All values are means and standard deviations of five independent experiments. Differences were found to be statistically significant at *P<0.01, **P<0.001 and ***P<0.0001. No significant differences were observed between laforin- and malin-deficient fibroblasts.
Figure 12. Effect of oligomycin plus antimycin A treatment on the LC3-II levels in control and in LD fibroblasts.
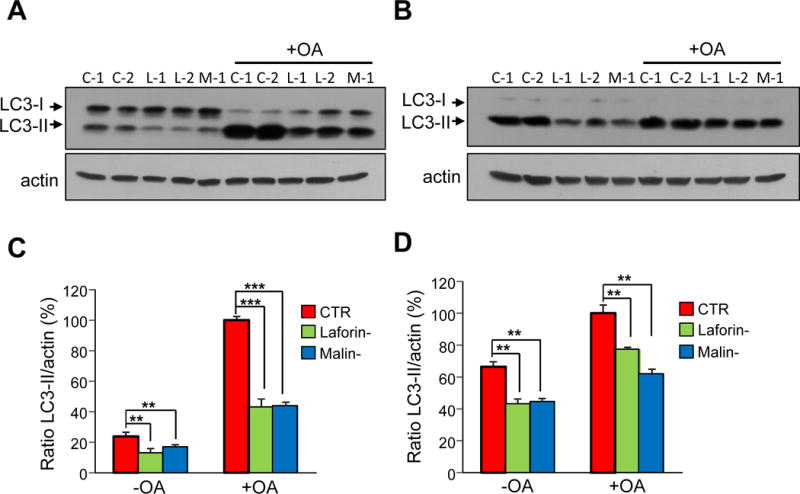
Control (C-1 and C-2), laforin-deficient (L-1 and L-2) and malin-deficient (M-1) fibroblasts were incubated in full medium without (-OA) or with (+OA) 10 μM oligomycin plus 1 μM antimycin A for 18 h. For the last 2 h of treatment, fibroblasts were incubated in full (A) or in KH (B) media with lysosomal inhibitors (20 mM ammonium chloride and 100 μM leupeptin). Cellular extracts (75 μg protein) from the different samples were analysed by Western blot using anti-LC3 and anti-actin antibodies. Representative immunoblots are shown. The intensity of the bands was assessed by densitometry and the LC3-II values were normalized to those of actin in the same lanes (C and D, for full and KH media, respectively) in control (CTR, red bars), laforin-deficient (Laforin-, green bars) and malin-deficient (Malin-, blue bars) fibroblasts. In the histograms, the results are expressed as percentage of the respective highest control value. All values correspond to the means and standard deviations of five independent experiments. Differences were found to be statistically significant at **P<0.001, ***P<0.0001. No significant differences were observed between laforin- and malin-deficient fibroblasts.
Figure 13. Number of autophagic vacuoles in control and in LD fibroblasts in the presence or absence of CCCP.
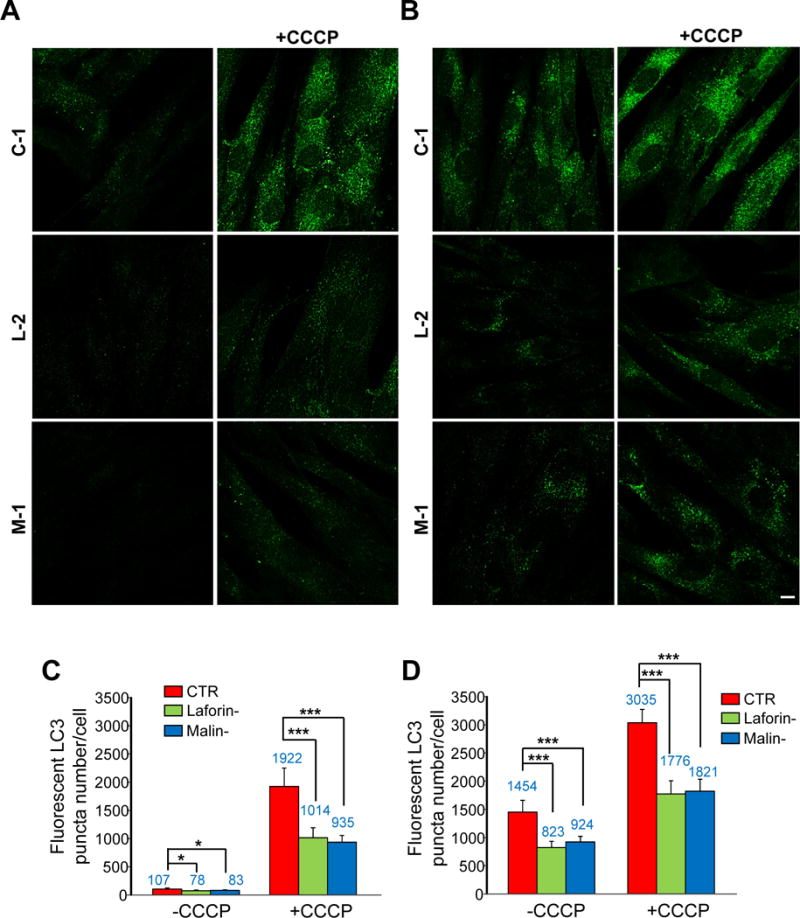
Fibroblasts from controls (CTR: C-1 and C-2) and laforin- (Laforin-: L-1 and L-2) and malin-deficient (Malin-: M-1) were incubated for 18 h in full medium without (-CCCP) or with (+CCCP) 10 μM CCCP, as indicated. For the last 2 h of treatment, fibroblasts were incubated in full (A) or in KH (B) media containing lysosomal inhibitors (100 μM leupeptin and 1 μM pepstatin A). Representative fluorescence microscopy images of control (C-1) and LD (L-2 and M-1) fibroblasts incubated with anti-LC3 are shown. Bar: 10 μm. The histograms (C and D, for full and KH media, respectively) show the mean (value indicated above the corresponding bar) and standard deviation of the number of LC3 puncta, quantified in 50 cells from control (CTR, red bars), laforin-deficient (Laforin-, green bars) and malin-deficient (Malin-, blue bars) fibroblasts in two different experiments (indicated in the histograms). Differences were found to be statistically significant at *P<0.01 and ***P<0.0001. No significant differences were observed between laforin- and malin-deficient fibroblasts.
DISCUSSION
Lafora disease (LD) is caused by mutations in either EPM2A or EPM2B genes, which encode, respectively, laforin, a dual-specificity phosphatase and malin, an E3 ubiquitin ligase [2]. Patients carrying mutations in either EPM2A or EPM2B are phenotypically indistinguishable and it has been also described that laforin and malin form a complex ([9], [11]). Therefore, both proteins may participate in a common biochemical process. However, in spite of much work, the detailed mechanisms whereby these proteins are involved in LD are still unknown and more data are necessary to fully understand the causes of this pathology.
Several alterations in mitochondrial functions have been previously associated to different muscular and neurodegenerative disorders [32]. In LD, we have already described in this disease defects in mitochondrial functions, including decreases in mitochondrial membrane potential and in ATP levels, a higher oxidative stress due to both an increase in ROS production and a dysregulation of the antioxidant enzyme response ([17], [18]). To prevent defective mitochondria from accumulating, cells have developed a mechanism to eliminate excessive or dysfunctional mitochondria by a selective autophagic mechanism called mitophagy [33], which has emerged in the last years as a major player in the pathogenesis of neurodegenerative disorders and of many other diseases [34]. Therefore, in this work we have investigated whether mitophagy was impaired in LD. To this end, we treated primary fibroblasts from LD patients carrying mutations in either EPM2A or EPM2B genes with mitochondrial uncouplers or respiratory chain inhibitors to alter mitochondrial functions. Mitochondrial degradation was tested by a standard flow cytometric approach with cells labelled with MitoTracker Red, and also by using Western blot to measure the levels of specific mitochondrial proteins from different mitochondrial compartments: OPA1, SDHA, GDH, PDH, VDAC1 and COX IV. We observed that, compared to their controls, in both the laforin- and malin-deficient fibroblasts, treatments with CCCP, FCCP or a combination of oligomycin plus antimycin A, led to a defective degradation of whole mitochondria and their proteins. This defect also occurred under starvation conditions (growth in KH medium), which were used to increase autophagy and to facilitate the clearance of damaged mitochondria. Mitophagy can also be assessed analyzing the colocalization of lysosomal and mitochondrial markers by fluorescence microscopy [35]. With this technique we found increased colocalization of both markers upon CCCP, FCCP or oligomycin plus antimycin A treatment in the control and LD fibroblasts. However, this colocalization was clearly lower in laforin- and malin-deficient fibroblasts, which once again suppors the existence of a defect in mitophagy associated with LD fibroblasts. Since laforin and malin form a functional complex and no substantial phenotypic differences have been found in patients carrying mutations in either of both genes, it is interesting that this mitophagy defect occurs to a similar extent in fibroblasts from patients carrying mutations in either of the two genes implicated in LD.
Although other mitophagy signalling pathways may exist (for reviews see e.g. [36], [37]), canonical mitophagy is regulated by two proteins, mitochondrial kinase PINK1 and the E3-ubiquitin ligase Parkin. The pathway starts when PINK1 accumulates on defective mitochondria and triggers the translocation of Parkin to them, which thus allows the recognition of dysfunctional mitochondria by the autophagic machinery [38]. We herein found that this translocation of Parkin from the cytosol to mitochondria induced by CCCP, FCCP or oligomycin plus antimycin A was not altered in the laforin- and malin-deficient fibroblasts. Also, the overexpression of laforin and malin in SH-SY5Y cells did not affect the translocation of Parkin that occurred upon these treatments, which indicates again that laforin and malin do not play a major role in the regulation of canonical mitophagy signalling pathway. Our results do not support a recent publication which has suggested that translocation of Parkin to mitochondria upon CCCP treatment was dramatically reduced in mouse fibroblasts from Epm2a−/− and Epm2b−/− mice [39]. Perhaps variations in the models employed could account for this difference. Moreover, compared to the controls, nor was an alternative mitophagic player such as BCL2L13 [37], altered in LD fibroblasts.
If mitophagy signalling is not altered in LD, a defect in the other component of the mitophagy machinery, autophagy, may explain the decreased degradation of the altered mitochondria in LD fibroblasts. In fact, we have previously found an impairment of autophagy in laforin-deficient fibroblasts from human patients and in mouse embryonic fibroblasts and in various tissues from laforin knockout mice (Epm2a−/−) [40]. A similar defect in autophagy was later described in malin-deficient mice (Epm2b−/−) [41] and in other laforin and malin knockout mice ([42], [43]). However, it has been postulated that the impairment in autophagy in LD could be secondary to the accumulation of glycogen [42], and more recently other groups have even questioned the existence of a general autophagic defect in LD ([44], [45]). Here we found that although an increase in the autophagic response took place, as expected [31], after treating the cells with CCCP, FCCP or oligomycin plus antimycin A, as well as under starvation conditions (growth in KH medium), the LC3-II levels were always clearly lower in the fibroblasts from LD patients. Moreover, since the experiments to measure LC3-II levels were performed in the presence of lysosomal inhibitors, we can concluded that the reduced autophagic response of LD fibroblasts is due to a defect in autophagosome formation. This supports and extends our previous results on the existence of a defective autophagy in different LD models ([40], [41]). Interestingly, the deficiency in the autophagic degradation of altered mitochondria described herein was about the same in the laforin- and malin-deficient fibroblasts. This finding indicates a common defective mechanism, which results in the accumulation of altered mitochondria and reinforces its relevance for LD. The specific role of malin and laforin in the formation of autophagosomes remains to be investigated. It has been recently demonstrated that upon prevention of glycogen synthesis, impairment in the formation of LBs and the recovery of the autophagic defect seen in LD mice models (see [2] for a review) took place. A possible explanation of this effect could be that as LBs contain in addition to polyglucosans, advanced glycation-end-products, polyubiquitinated proteins, proteasome subunits and autophagy related proteins, such as p62, the sequestration of p62 and other proteins involved in autophagy in LBs might lead to autophagy dysfunction. By blocking glycogen synthesis, LBs would not be formed and autophagy could thus be recovered.
In summary, here we show lower mitophagy in LD fibroblasts, which is not due to defects in the canonical mitophagy signalling pathway, but is owing rather to a partial impairment in the formation of autophagic vacuoles in these cells. As a result, dysfunctional mitochondria accumulate in cells, which may notably contribute to the pathology.
EXPERIMENTAL PROCEDURES
Chemicals, antibodies and other reagents
Minimum Essential medium (MEM), Dulbecco’s Modified Eagle´s Medium/F12 (DMEM/F12), Earle’s salts, L-glutamine, trypsin-EDTA, Nonidet P-40, sodium deoxycholate, sodium dodecyl sulfate, 4′,6-diamidino-2-phenylindole (DAPI), CCCP, FCCP, 3-methyladenine, paraformaldehyde, Triton X-100, phenylmethylsulfonyl fluoride (PMSF), antimycin A, oligomycin, pepstatin A and NH4Cl were purchased from Sigma Chemical Co. MEM amino acids 50x, MEM non-essential amino acids 50x, MEM vitamins 50x, fetal bovine serum, penicillin and streptomycin were supplied by Invitrogen Life Technologies. Leupeptin was from Peptide Institute, Inc. and bovine serum albumin (BSA) from Roche Applied Science. MitoTracker Red and Alexa Fluor dyes were from Molecular Probes (Thermo Fisher Scientific) and FluorSave reagent from Millipore. Plasmids pEGFP-Parkin (#45875) and pRK5-HA-Parkin (#17613) were from Addgene (Cambridge, MA).
The following antibodies were used: anti-β-actin (A-5441, Sigma Chemical Co.), anti-BCL2L13 (16612-1-AP, Proteintech), anti-catalase (0979, Sigma Chemical Co.), anti-CYTC (338200, Invitrogen), anti-GAPDH (sc32233, Santa Cruz Biotechnology), anti-HA tag (H9658, Sigma Chemical Co.), anti-laforin (MABN606, Millipore), anti-LAMP2 (ab25631, Abcam), anti-LC3B (NB100-2220, Novus), anti-COX IV (4850, Cell Signalling Technology), anti-Myc tag (C3956, Sigma Chemical Co.), anti-OPA1 (612606, BD-Biosciences), anti-PDH (21325, Molecular Probes), anti-SDHA (ab139181, Abcam), anti-TOM20 (sc11415, Santa Cruz Biotechnology), anti-tubulin (ab6160, Abcam) and anti-VDAC1 (ab15895, Abcam). Horseradish peroxidase-labelled secondary antibodies were from Sigma Chemical Co. To detect glutamate dehydrogenase (GDH), a monoclonal antibody obtained in our laboratory was used [46]. All other reagents employed in this study were of analytical grade.
Cell culture and treatments
LD fibroblasts were obtained from three patients. Two of them contained mutations in the laforin gene (EPM2A) (L-1: Y112X/N163D; L-2: R241X/R241X) and the third, which was obtained from the Coriell Institute for Medical Research (Camden, NJ, USA), was mutated in the malin gene (EPM2B) (M-1: P129H/P129H). All patients presented the clinical features of LD. Control fibroblasts (C-1 and C-2) were matched by sex and age with LD fibroblasts and all experiments were performed at passage number 10-14 to avoid culture aging effects. Cell growth and viability were performed by counting the cells in a hemocytometer chamber and using the trypan blue exclusion test.
Fibroblasts were grown at 37 °C in a humidified atmosphere at 5% (v/v) CO2/air in MEM with Earle’s salts, 2 mM L-glutamine, 1x MEM amino acids, 1x MEM non-essential amino acids, 1x MEM vitamins, 100 U/ml penicillin, 100 μg/ml streptomycin and 15% fetal bovine serum (full medium). For the starvation conditions used in some experiments, cells were incubated for the indicated times in Krebs-Henseleit medium (118.4 mM NaCl, 4.75 mM KCl, 1.19 mM KH2PO4, 2.54 mM MgSO4 × 7H2O, 2.44 mM CaCl2 × 2H2O, 18.5 mM NaHCO3, 10 mM D-glucose and 10 mM Hepes buffer, pH 7.4).
When indicated, cells growing at 37 °C in full medium were treated with either 10 μM CCCP, 10 μM FCCP or 10 μM oligomycin plus 1 μM antimycin A for the indicated times. As lysosomal inhibitors, either 100 μM leupeptin plus 20 mM NH4Cl or 100 μM leupeptin plus 1 μM pepstatin A were used with similar results.
SH-SY5Y human neuroblastoma cells were grown as above but in DMEM/F12 supplemented with 100 U/ml penicillin, 100 μg/ml streptomycin, 2 mM L-glutamine and 10% inactivated fetal bovine serum. Silencing of laforin with siRNA and transfections with Myc-laforin and HA-malin in SH-SY5Y cells were carried out as previously described [47].
Flow cytometry analyses
Cells were incubated in full medium with 100 nM MitoTracker Red for 30 min at 37 °C and, after washing with PBS, cells were incubated for 18 h at 37 °C with the mitochondrial uncouplers or inhibitors that affect mitochondrial function. Where indicated, 3-methyladenine was added at 10 mM as an autophagy control. Cells were detached with trypsin-EDTA, washed three times and resuspended in PBS (106 cells/ml) at 4 °C. The emitted red fluorescence (620 ± 20 nm band-pass filter) was measured by flow cytometry. In each experiment, 10,000 cells were collected and analysed using a Cytomics FC500 Flow cytometer (Beckman Coulter).
Fluorescence microscopy
Cells were cultured on coverslips and stained with 100 nM MitoTracker Red for 30 min at 37 °C. Then, cells were rinsed with phosphate buffered saline (PBS), incubated in full medium for 18 h with or without the mitochondrial uncouplers or inhibitors that affect mitochondrial function, fixed with 4% paraformaldehyde in PBS for 10 min at room temperature, washed three times with PBS, and mounted using FluorSave reagent. For colocalization studies of mitochondria and lysosomes or for LC3 detection, cells were incubated as above, except that lysosomal inhibitors (see the Cell culture and treatments section) were added in the last 2 h of the incubation. Cells were then fixed as above and quenched with 75 mM NH4Cl and 20 mM glycine for 10 min, permeabilized with Triton X-100 (0.3%, v/v in PBS) for 10 min and blocked with 1% BSA and 0.1% Triton X-100 in PBS for 30 min. Then, cells were incubated overnight at 4°C with the corresponding primary antibodies [anti-BCL2L13 (dilution 1/300), anti-CYTC (dilution 1/300), anti-HA (dilution 1/300), anti-LAMP2 (dilution 1:100), anti-Myc (dilution 1/300), anti-TOM20 (dilution 1/300), anti-LC3 (dilution 1/100)]. Coverslips were washed four times with PBS and incubated with the corresponding Alexa Fluor conjugated secondary antibody for 1 h at room temperature. After extensively washing, the coverslips were mounted using Fluor-Save reagent. In some experiments, cells were also incubated with DAPI (1 μg/ml) for 10 min at room temperature. Preparations were observed in a fluorescence microscope Leica DM6000 B and images were acquired with a Leica TCS SP8 HyVolutionII Laser Scanning Inverted Confocal Microscope. Quantification of colocalizations was carried out using MetaMorph software version 7.0 (Molecular Devices).
Western blot analyses
Western blot was carried out essentially as described [48]. Briefly, cells were collected and lysed in RIPA buffer (150 mM NaCl, 1% Nonidet-P40, 0.5% sodium deoxycholate, 0.1% sodium dodecyl sulfate and 50 mM Tris-HCl, pH 8.0, containing 1 mM PMSF and 100 μM leupeptin) at 4°C. Samples were analysed on 12% or 15% SDS-PAGE and proteins were transferred to PVDF membranes (Millipore). Membranes were blocked with 5% (w/v) non-fat milk in Tris-buffered saline (TBS: 50 mM Tris-HCl, 150 mM NaCl, pH 7.4) for 1 h at room temperature and incubated overnight at 4°C with the corresponding primary antibodies. Then, membranes were probed with the suitable secondary antibodies for 1 h at room temperature. Signals were visualized using Lumi-Light Western Blotting Substrate (Roche Applied Science) or ECL Prime Western Blotting Detection Reagent (GE Healthcare) on Medical X-Ray Film (Kodak). Protein concentration was measured by a modification, with sodium deoxycholate, of the Lowry procedure, using BSA as standard. Protein bands were quantified by densitometric analysis using the Image Quant ECL (GE Healthcare) software.
Statistical analyses
Results are shown as means and standard deviations. Differences between paired of samples were analysed by two-tailed Student’s t-tests using Graph Pad Prism version 5.0 statistical software. P values have been considered in all figures as: *P< 0.01, **P< 0.001 and ***P< 0.0001.
Acknowledgments
This work was supported by grants SAF2014-54604-C3-1-R and SAF2014-54604-C3-2-R from the Spanish Ministry of Economy and Competitiveness, a grant from Generalitat Valenciana (PrometeoII/2014/029) and a grant from the National Institute of Health P01NS097197, which established the Lafora Epilepsy Cure Initiative (LECI). P.S-M and M.L. holds a FPU and FPI fellowship, respectively, from the Spanish Ministry of Education, Culture and Sports.
Abbreviations
- BCL2L13
Bcl-2-like protein 13
- BSA
bovine serum albumin
- CCCP
carbonyl cyanide m-chlorophenylhydrazone
- COX IV
cytochrome c oxidase, subunit 4
- CYTC
cytochrome C
- DAPI
4′,6-diamidino-2-phenylindole
- FCCP
p-rifluoromethoxyphenylhydrazone
- GAPDH
glyceraldehyde-3-phosphate dehydrogenase
- GFP
green fluorescent protein
- LB
Lafora bodies
- GDH
glutamate dehydrogenase
- LAMP
lysosome-associated membrane protein
- LD
Lafora disease
- OPA1
mitochondrial dynamin like GTPase
- PDH
pyruvate dehydrogenase
- PMSF
phenylmethylsulfonyl fluoride
- PBS
phosphate buffered saline
- SDHA
subunit A of the succinate dehydrogenase complex
- TOM
translocase of outer membrane
- VDAC
voltage-dependent anion-selective channel
Footnotes
Conflict of interest: The authors declare no conflict of interest in this article
AUTHOR CONTRIBUTIONS
ML, CA and PS-M performed the experiments. PS and EK planned experiments and analyzed data. ML, CA, PS and EK wrote the paper.
References
- 1.Delgado-Escueta AV. Advances in lafora progressive myoclonus epilepsy. Current Neurol Neurosci Rep. 2007;7:428–433. doi: 10.1007/s11910-007-0066-7. [DOI] [PubMed] [Google Scholar]
- 2.Turnbull J, Tiberia E, Striano P, Genton P, Carpenter S, Ackerley CA, Minassian BA. Lafora disease. Epileptic Disord. 2016;18:38–62. doi: 10.1684/epd.2016.0842. [DOI] [PMC free article] [PubMed] [Google Scholar]
- 3.Ganesh S, Puri R, Singh S, Mittal S, Dubey D. Recent advances in the molecular basis of Lafora’s progressive myoclonus epilepsy. J Hum Genet. 2006;51:1–8. doi: 10.1007/s10038-005-0321-1. [DOI] [PubMed] [Google Scholar]
- 4.Gentry MS, Dixon JE, Worby CA. Lafora disease: insights into neurodegeneration from plant metabolism. Trends Biochem Sci. 2009;34:628–639. doi: 10.1016/j.tibs.2009.08.002. [DOI] [PMC free article] [PubMed] [Google Scholar]
- 5.Chan EM, Omer S, Ahmed M, Bridges LR, Bennett C, Scherer SW, Minassian BA. Progressive myoclonus epilepsy with polyglucosans (Lafora disease): evidence for a third locus. Neurology. 2004;63:565–567. doi: 10.1212/01.wnl.0000133215.65836.03. [DOI] [PubMed] [Google Scholar]
- 6.Minassian BA, Lee JR, Herbrick JA, Huizenga J, Soder S, Mungall AJ, Dunham I, Gardner R, Fong CY, Carpenter S, et al. Mutations in a gene encoding a novel protein tyrosine phosphatase cause progressive myoclonus epilepsy. Nat Genet. 1998;20:171–174. doi: 10.1038/2470. [DOI] [PubMed] [Google Scholar]
- 7.Chan EM, Young EJ, Ianzano L, Munteanu I, Zhao X, Christopoulos CC, Avanzini G, Elia M, Ackerley CA, Jovic NJ, et al. Mutations in NHLRC1 cause progressive myoclonus epilepsy. Nat Genet. 2003;35:125–127. doi: 10.1038/ng1238. [DOI] [PubMed] [Google Scholar]
- 8.Gentry MS, Worby CA, Dixon JE. Insights into Lafora disease: malin is an E3 ubiquitin ligase that ubiquitinates and promotes the degradation of laforin. Proc Natl Acad Sci U S A. 2005;102:8501–8506. doi: 10.1073/pnas.0503285102. [DOI] [PMC free article] [PubMed] [Google Scholar]
- 9.Vilchez D, Ros S, Cifuentes D, Pujadas L, Valles J, Garcia-Fojeda B, Criado-Garcia O, Fernandez-Sanchez E, Medrano-Fernandez I, Dominguez J, et al. Mechanism suppressing glycogen synthesis in neurons and its demise in progressive myoclonus epilepsy. Nature Neurosci. 2007;10:1407–1413. doi: 10.1038/nn1998. [DOI] [PubMed] [Google Scholar]
- 10.Cheng A, Zhang M, Gentry MS, Worby CA, Dixon JE, Saltiel AR. A role for AGL ubiquitination in the glycogen storage disorders of Lafora and Cori’s disease. Genes Dev. 2007;21:2399–2409. doi: 10.1101/gad.1553207. [DOI] [PMC free article] [PubMed] [Google Scholar]
- 11.Solaz-Fuster MC, Gimeno-Alcaniz JV, Ros S, Fernandez-Sanchez ME, Garcia-Fojeda B, Criado Garcia O, Vilchez D, Dominguez J, Garcia-Rocha M, Sanchez-Piris M, et al. Regulation of glycogen synthesis by the laforin-malin complex is modulated by the AMP-activated protein kinase pathway. Hum Mol Genet. 2008;17:667–678. doi: 10.1093/hmg/ddm339. [DOI] [PubMed] [Google Scholar]
- 12.Moreno D, Towler MC, Hardie DG, Knecht E, Sanz P. The laforin-malin complex, involved in Lafora disease, promotes the incorporation of K63-linked ubiquitin chains into AMP-activated protein kinase beta subunits. Mol Biol Cell. 2010;21:2578–2588. doi: 10.1091/mbc.E10-03-0227. [DOI] [PMC free article] [PubMed] [Google Scholar]
- 13.Garyali P, Siwach P, Singh PK, Puri R, Mittal S, Sengupta S, Parihar R, Ganesh S. The malin-laforin complex suppresses the cellular toxicity of misfolded proteins by promoting their degradation through the ubiquitin-proteasome system. Hum Mol Genet. 2009;18:688–700. doi: 10.1093/hmg/ddn398. [DOI] [PubMed] [Google Scholar]
- 14.Tagliabracci VS, Turnbull J, Wang W, Girard JM, Zhao X, Skurat AV, Delgado-Escueta AV, Minassian BA, Depaoli-Roach AA, Roach PJ. Laforin is a glycogen phosphatase, deficiency of which leads to elevated phosphorylation of glycogen in vivo. Proc Natl Acad Sci U S A. 2007;104:19262–19266. doi: 10.1073/pnas.0707952104. [DOI] [PMC free article] [PubMed] [Google Scholar]
- 15.Worby CA, Gentry MS, Dixon JE. Laforin, a dual specificity phosphatase that dephosphorylates complex carbohydrates. J Biol Chem. 2006;281:30412–30418. doi: 10.1074/jbc.M606117200. [DOI] [PMC free article] [PubMed] [Google Scholar]
- 16.Schon EA, Manfredi G. Neuronal degeneration and mitochondrial dysfunction. J Clin Invest. 2003;111:303–312. doi: 10.1172/JCI17741. [DOI] [PMC free article] [PubMed] [Google Scholar]
- 17.Roma-Mateo C, Aguado C, Garcia-Gimenez JL, Ibanez-Cabellos JS, Seco-Cervera M, Pallardo FV, Knecht E, Sanz P. Increased oxidative stress and impaired antioxidant response in lafora disease. Mol Neurobiol. 2015;51:932–946. doi: 10.1007/s12035-014-8747-0. [DOI] [PubMed] [Google Scholar]
- 18.Roma-Mateo C, Aguado C, Garcia-Gimenez JL, Knecht E, Sanz P, Pallardo FV. Oxidative stress, a new hallmark in the pathophysiology of Lafora progressive myoclonus epilepsy. Free Radic Biol Med. 2015;88:30–41. doi: 10.1016/j.freeradbiomed.2015.01.034. [DOI] [PubMed] [Google Scholar]
- 19.Ashrafi G, Schwarz TL. The pathways of mitophagy for quality control and clearance of mitochondria. Cell Death Differ. 2013;20:31–42. doi: 10.1038/cdd.2012.81. [DOI] [PMC free article] [PubMed] [Google Scholar]
- 20.Buckler KJ, Vaughan-Jones RD. Effects of mitochondrial uncouplers on intracellular calcium, pH and membrane potential in rat carotid body type I cells. J Physiol. 1998;513:819–833. doi: 10.1111/j.1469-7793.1998.819ba.x. [DOI] [PMC free article] [PubMed] [Google Scholar]
- 21.Park KS, Jo I, Pak K, Bae SW, Rhim H, Suh SH, Park J, Zhu H, So I, Kim KW. FCCP depolarizes plasma membrane potential by activating proton and Na+ currents in bovine aortic endothelial cells. Pflugers Arch. 2002;443:344–352. doi: 10.1007/s004240100703. [DOI] [PubMed] [Google Scholar]
- 22.Georgakopoulos ND, Wells G, Campanella M. The pharmacological regulation of cellular mitophagy. Nat Chem Biol. 2017;13:136–146. doi: 10.1038/nchembio.2287. [DOI] [PubMed] [Google Scholar]
- 23.Mitra K, Lippincott-Schwartz J. Analysis of mitochondrial dynamics and functions using imaging approaches. Curr Protoc Cell Biol. 2010;25:21–21. doi: 10.1002/0471143030.cb0425s46. Chapter 4, Unit 4. [DOI] [PMC free article] [PubMed] [Google Scholar]
- 24.Mauro-Lizcano M, Esteban-Martinez L, Seco E, Serrano-Puebla A, Garcia-Ledo L, Figueiredo-Pereira C, Vieira HL, Boya P. New method to assess mitophagy flux by flow cytometry. Autophagy. 2015;11:833–843. doi: 10.1080/15548627.2015.1034403. [DOI] [PMC free article] [PubMed] [Google Scholar]
- 25.Xiao B, Deng X, Zhou W, Tan EK. Flow Cytometry-Based Assessment of Mitophagy Using MitoTracker. Front Cell Neurosci. 2016;10:76. doi: 10.3389/fncel.2016.00076. [DOI] [PMC free article] [PubMed] [Google Scholar]
- 26.Seglen PO, Gordon PB. 3-Methyladenine: specific inhibitor of autophagic/lysosomal protein degradation in isolated rat hepatocytes. Proc Natl Acad Sci U S A. 1982;79:1889–1892. doi: 10.1073/pnas.79.6.1889. [DOI] [PMC free article] [PubMed] [Google Scholar]
- 27.Fuertes G, Martin De Llano JJ, Villarroya A, Rivett AJ, Knecht E. Changes in the proteolytic activities of proteasomes and lysosomes in human fibroblasts produced by serum withdrawal, amino-acid deprivation and confluent conditions. Biochem J. 2003;375:75–86. doi: 10.1042/BJ20030282. [DOI] [PMC free article] [PubMed] [Google Scholar]
- 28.Narendra D, Tanaka A, Suen DF, Youle RJ. Parkin is recruited selectively to impaired mitochondria and promotes their autophagy. J Cell Biol. 2008;183:795–803. doi: 10.1083/jcb.200809125. [DOI] [PMC free article] [PubMed] [Google Scholar]
- 29.Mizushima N, Yoshimori T, Levine B. Methods in mammalian autophagy research. Cell. 2010;140:313–326. doi: 10.1016/j.cell.2010.01.028. [DOI] [PMC free article] [PubMed] [Google Scholar]
- 30.Galluzzi L, Bravo-San Pedro JM, Levine B, Green DR, Kroemer G. Pharmacological modulation of autophagy: therapeutic potential and persisting obstacles. Nat Rev Drug Discov. 2017;16:487–511. doi: 10.1038/nrd.2017.22. [DOI] [PMC free article] [PubMed] [Google Scholar]
- 31.Zhu Y, Chen G, Chen L, Zhang W, Feng D, Liu L, Chen Q. Monitoring mitophagy in mammalian cells. Methods Enzymol. 2014;547:39–55. doi: 10.1016/B978-0-12-801415-8.00003-5. [DOI] [PubMed] [Google Scholar]
- 32.Orth M, Schapira AH. Mitochondria and degenerative disorders. Am J Med Genet. 2001;106:27–36. doi: 10.1002/ajmg.1425. [DOI] [PubMed] [Google Scholar]
- 33.Kim I, Rodriguez-Enriquez S, Lemasters JJ. Selective degradation of mitochondria by mitophagy. Arch Biochem Biophys. 2007;462:245–253. doi: 10.1016/j.abb.2007.03.034. [DOI] [PMC free article] [PubMed] [Google Scholar]
- 34.Hamacher-Brady A, Brady NR. Mitophagy programs: mechanisms and physiological implications of mitochondrial targeting by autophagy. Cell Mol Life Sci. 2016;73:775–795. doi: 10.1007/s00018-015-2087-8. [DOI] [PMC free article] [PubMed] [Google Scholar]
- 35.Rodriguez-Enriquez S, Kim I, Currin RT, Lemasters JJ. Tracker dyes to probe mitochondrial autophagy (mitophagy) in rat hepatocytes. Autophagy. 2006;2:39–46. doi: 10.4161/auto.2229. [DOI] [PMC free article] [PubMed] [Google Scholar]
- 36.Bernardini JP, Lazarou M, Dewson G. Parkin and mitophagy in cancer. Oncogene. 2017;36:1315–1327. doi: 10.1038/onc.2016.302. [DOI] [PubMed] [Google Scholar]
- 37.Roberts RF, Tang MY, Fon EA, Durcan TM. Defending the mitochondria: The pathways of mitophagy and mitochondrial-derived vesicles. Int J Biochem Cell Biol. 2016;79:427–436. doi: 10.1016/j.biocel.2016.07.020. [DOI] [PubMed] [Google Scholar]
- 38.Durcan TM, Fon EA. The three ‘P’s of mitophagy: PARKIN, PINK1, and post-translational modifications. Genes Dev. 2015;29:989–999. doi: 10.1101/gad.262758.115. [DOI] [PMC free article] [PubMed] [Google Scholar]
- 39.Upadhyay M, Agarwal S, Bhadauriya P, Ganesh S. Loss of laforin or malin results in increased Drp1 level and concomitant mitochondrial fragmentation in Lafora disease mouse models. Neurobiol Dis. 2017;100:39–51. doi: 10.1016/j.nbd.2017.01.002. [DOI] [PubMed] [Google Scholar]
- 40.Aguado C, Sarkar S, Korolchuk VI, Criado O, Vernia S, Boya P, Sanz P, de Cordoba SR, Knecht E, Rubinsztein DC. Laforin, the most common protein mutated in Lafora disease, regulates autophagy. Hum Mol Genet. 2010;19:2867–2876. doi: 10.1093/hmg/ddq190. [DOI] [PMC free article] [PubMed] [Google Scholar]
- 41.Criado O, Aguado C, Gayarre J, Duran-Trio L, Garcia-Cabrero AM, Vernia S, San Millan B, Heredia M, Roma-Mateo C, Mouron S, et al. Lafora bodies and neurological defects in malin-deficient mice correlate with impaired autophagy. Hum Mol Genet. 2012;21:1521–1533. doi: 10.1093/hmg/ddr590. [DOI] [PubMed] [Google Scholar]
- 42.Duran J, Gruart A, Garcia-Rocha M, Delgado-Garcia JM, Guinovart JJ. Glycogen accumulation underlies neurodegeneration and autophagy impairment in Lafora disease. Hum Mol Genet. 2014;23:3147–3156. doi: 10.1093/hmg/ddu024. [DOI] [PubMed] [Google Scholar]
- 43.Garyali P, Segvich DM, DePaoli-Roach AA, Roach PJ. Protein degradation and quality control in cells from laforin and malin knockout mice. J Biol Chem. 2014;289:20606–20614. doi: 10.1074/jbc.M114.580167. [DOI] [PMC free article] [PubMed] [Google Scholar]
- 44.Nitschke F, Sullivan MA, Wang P, Zhao X, Chown EE, Perri AM, Israelian L, Juana-Lopez L, Bovolenta P, Rodriguez de Cordoba S, et al. Abnormal glycogen chain length pattern, not hyperphosphorylation, is critical in Lafora disease. EMBO Mol Med. 2017;9:906–917. doi: 10.15252/emmm.201707608. [DOI] [PMC free article] [PubMed] [Google Scholar]
- 45.Jain N, Rai A, Mishra R, Ganesh S. Loss of malin, but not laforin, results in compromised autophagic flux and proteasomal dysfunction in cells exposed to heat shock. Cell Stress Chaperones. 2017;22:307–315. doi: 10.1007/s12192-016-0754-9. [DOI] [PMC free article] [PubMed] [Google Scholar]
- 46.Knecht E, Martinez-Ramon A, Grisolia S. Electron microscopic localization of glutamate dehydrogenase in rat liver mitochondria by an immunogold procedure and monoclonal and polyclonal antibodies. J Histochem Cytochem. 1986;34:913–922. doi: 10.1177/34.7.3519755. [DOI] [PubMed] [Google Scholar]
- 47.Vernia S, Rubio T, Heredia M, Rodriguez de Cordoba S, Sanz P. Increased endoplasmic reticulum stress and decreased proteasomal function in lafora disease models lacking the phosphatase laforin. PLoS One. 2009;4:e5907. doi: 10.1371/journal.pone.0005907. [DOI] [PMC free article] [PubMed] [Google Scholar]
- 48.Moruno-Manchon JF, Perez-Jimenez E, Knecht E. Glucose induces autophagy under starvation conditions by a p38 MAPK-dependent pathway. Biochem J. 2013;449:497–506. doi: 10.1042/BJ20121122. [DOI] [PubMed] [Google Scholar]
- 49.Duvezin-Caubet S, Jagasia R, Wagener J, Hofmann S, Trifunovic A, Hansson A, Chomyn A, Bauer MF, Attardi G, Larsson NG, et al. Proteolytic processing of OPA1 links mitochondrial dysfunction to alterations in mitochondrial morphology. J Biol Chem. 2006;281:37972–37979. doi: 10.1074/jbc.M606059200. [DOI] [PubMed] [Google Scholar]


