

Abstract
Inflammation has been suggested to play an important role in onset and progression of prostate cancer (PCa). Histological analysis of prostatectomy specimens has revealed focal inflammation in early stage lesions of this malignancy. We addressed the role of inflammatory stimuli in the release of PCa-specific, tumor-derived soluble factors (PCa-TDSFs) already reported to be mediators of PCa morbidity, such as indoleamine 2,3-dioxygenase (IDO) and interleukin (IL)-6. Inflammation-driven production and functions of PCa-TDFSs were tested “in vitro” by stimulating established cell lines (CA-HPV-10 and PC3) with IFN-γ or TNF-α. Expression of genes encoding IDO, IL-6, IFN-γ, TNF-α, and their receptors was investigated in tumor tissues of PCa patients undergoing radical prostatectomy, in comparison with benign prostatic hyperplasia (BPH) specimens. IFN-γ and TNF-α-treatment resulted in the induction of IDO and IL-6 gene expression and release in established cell lines, suggesting that the elicitation of PCa-TDSFs by these cytokines might contribute to progression of cancer into an untreatable phenotype. An analysis based on timing of biochemical recurrence revealed the prognostic value of IDO but not IL-6 gene expression in predicting recurrence-free survival in patients (RFS) with PCa. In addition, a urine-based mRNA biomarker study revealed the diagnostic potential of IDO gene expression in urines of men at risk of PCa development.
Keywords: indoleamine 2,3-dioxygenase; IDO; prostate cancer; inflammation; prostate cancer prognosis
Introduction
Chronic inflammation is considered an “enabling” characteristic of human cancers (1), although its prognostic significance in malignancies of different histological origin is debated (2). Histological analysis of prostate cancer (PCa) samples consistently indicates that inflammation might play a key role in the progression of this tumor (3). PCa is more frequent in demographic groups with high prevalence of prostatic inflammation (4), with a higher risk for obese men (5, 6). In addition, prostate adenocarcinoma outgrowth is frequently detected in tissue areas adjacent to chronic inflammation (3, 4). However, other studies suggest that histologically detectable prostate inflammation associates with decreased PCa risk (7, 8).
Previous studies by us and others indicate that genes encoding pro-inflammatory cytokines are expressed to significantly higher extents in PCa than in benign prostatic hyperplasia (BPH) tissue specimens (9–11).
Chronic inflammation frequently results in the establishment of an immunosuppressive microenvironment, particularly in cancer tissues (12, 13). In this context, pro-inflammatory cytokines might promote survival and proliferation of tumor cells and, paradoxically, subvert adaptive immune responses (13). Numerous studies indicate that chronic immune-stimulation may result in immune tolerance. Overstimulated T cells do express “immunological checkpoint” receptors whose triggering by specific ligands results in their anergy. Notably, the expression of some ligands of these receptors is typically induced by IFN-γ. These concepts provide the basis for the use of specific biologicals in cancer treatment and represent an important link between the potential immunogenicity of tumor microenvironment and the neutralization of immune responses (14).
IFN-γ and TNF-α are typically produced in the context of ongoing immune responses against infectious and tumor challenges. However, TNF-α has also been proposed as PCa marker (15). TNF-α might exert pro- or antiapoptotic effects, depending on cell or tissue types and experimental conditions (16, 17). High levels of TNF-α lead to tumor cell necrosis and apoptosis (18), and mediate immune cytotoxicity and production of inflammatory cytokines (19). In contrast, low-dose paracrine TNF-α production in tumor areas may support chronic inflammation and cancer progression (20).
Regarding IFN-γ, PCa cells have been shown to be poorly sensitive to its cytotoxic effects (21). Furthermore, it has been suggested that IFN-γ might induce immune-suppressive effects in PCa (22, 23).
In this study, we have comparatively analyzed the expression of genes encoding IFN-γ, TNF-α, and their receptors in PCa and in BPH tissues. Moreover, we have investigated the ability of these cytokines to induce in PCa cells the production of factors promoting tumor progression through the inhibition of adaptive immune responses (24) and/or the activation of alternative pathways for the androgen receptor (25). Finally, we have addressed the prognostic significance of factors induced by IFN-γ and TNF-α in PCa cells and their potential predictive power when detected in urine of individuals at risk of developing this malignancy.
Materials and Methods
Patients
We studied two case series of 97 consecutive PCa patients undergoing radical prostatectomy and 35 consecutive BPH patients undergoing conventional transurethral resection of the prostate (TUR-P) enrolled in the Department of Urology of the University Hospital of Basel, Switzerland, from 2007 to 2011. Clinicopathological parameters [prostate-specific antigen (PSA) levels, tumor stage, and Gleason score] were assigned according to EAU guidelines for PCa (uroweb.org/guideline/prostate-cancer/). If a PCa patient had a tumor whose stage at diagnosis could not be assessed, the Gleason score at biopsy was reported. BPH urinary obstructive symptoms and acute urinary retention were evaluated according to the international prostate symptom score. Biochemical recurrence (BR) was documented in 21 of 97 patients (21.6%) over a median follow-up of 23 months (range, 3–63 months). Local ethics committee approval and written informed consent from patients were obtained in accordance with the requirements of the Ethical Committee of Basel-Stadt and Basel-Land (EKBB, Ref. Nr. EK: 176/07). For the detection of indoleamine 2,3-dioxygenase (IDO) and interleukin (IL)-6 gene expression in urines of individuals at risk of developing PCa, we collected urines of 27 consecutive patients before they underwent fine needle biopsy for diagnostic/prognostic purposes (KEK-ZH-NR: 2010-0081/0).
Cell Culture
Established human PCa cell lines CA-HPV-10 [immortalized cell line from high-grade adenocarcinoma; American Type Culture Collection (ATCC)®CRL-2220] and PC3 (lumbar metastasis; ATCC®CRL-1435) were purchased from the ATCC (LGS Standards). Cells were cultured according to Russel and Kingsley guidelines (26). In particular, keratinocyte serum-free medium, supplemented with 50 µg/ml bovine pituitary extract, and Roswell Park Memorial Institute 1640 medium, supplemented with 10% fetal bovine serum, were used. All experiments were performed with cells at passage 9 or below. Cells were regularly tested for mycoplasma contamination by PCR (LookOut® mycoplasma qPCR detection kit, Sigma-Aldrich, Switzerland), prior to experimental procedures. Cells were cultured in T75 flasks and, when reaching 80% confluence, were stimulated with either IFN-γ or TNF-α, at a concentration of 300 U/ml (eBioscience, San Diego, CA, USA) or left unstimulated. Cells were harvested at different time points (6, 12, and 24 h for PC3 and 6, 12, 24, 48, and 72 h for CA-HPV-10). For inhibition tests, cells stimulated with IFN-γ or TNF-α (300 U/ml) or left unstimulated were cultured for 24 h in the presence of ruxolitinib (INCB018424; 1 µM) (27), SB202190 (20 µM) (28), LY294002 (50 µM) (29) (Selleckchem.com, Houston, TX, USA), or PDTC (10 µM; Sigma-Aldrich) (30) or without inhibitors. Cells were then collected by trypsinization (trypsin-EDTA, Invitrogen, Carlsbad, CA, USA) and used for gene expression analysis.
Gene Expression Analysis
Whole-mount prostatectomy sections of patients’ tissue specimens were analyzed for the presence of tumors by experienced pathologists. Total RNA was extracted from tumor tissues by the RNeasy® MiniKit (Qiagen, Basel, Switzerland), treated with deoxyribonuclease I (Invitrogen), and reverse transcribed by using M-MLV Reverse Transcriptase (Invitrogen). Quantitative gene amplification (qRT-PCR) was performed by using an ABI Prism 7500 FAST sequence detection system with the TaqMan® Universal PCR Master Mix and primers and probes provided by Assays-on-Demand, Gene Expression Products (Life Technologies, Forster City, CA, USA). Normalization of gene expression was performed by using GAPDH gene as reference. The 2−ΔΔCt method was used to compute the fold change in the expression of genes of interest when compared with GAPDH gene expression as baseline. Values ≤10−7 were considered undetectable. For cell line analysis, cells were cultured, stimulated, and harvested as described above, and gene expression was similarly evaluated.
Measurement of Tryptophan and Kynurenine Concentrations
Measurement of tryptophan and kynurenine concentrations in supernatants of cytokine-treated and -untreated cell lines, collected at defined time points was performed by high-pressure liquid chromatography (HPLC) and fluorimetric detection, as previously described (31). Supernatants were deproteinized by mixing with an equal volume of 10% (w/v) trichloroacetic acid. Measurement of tryptophan by HPLC separation was performed with a reverse-phase column (Spherisorb S5 ODS2, 25 cm) and a mobile phase (1 ml/min flow rate) composed of 5% acetonitrile, 100 mM phosphate buffer, pH 3.6, and 1 mM EDTA. Detection was performed with a Perkin-Elmer (Foster City, CA, USA) model LC 240 fluorimeter. The excitation and emission wavelengths were 313 and 420 nm, respectively. Kynurenine was measured by HPLC and UV detection. Briefly, HPLC separation was obtained with a reverse-phase column (Spherisorb S5 ODS2, 10 cm) and a mobile phase (1 ml/min flow rate) composed of 2% acetonitrile, 0.1 mM ammonium acetate, and 100 mM acetic acid. Kynurenine was detected at 365 nm with a UV detector (Perkin-Elmer model LC 90).
ELISA Assays
Supernatants of cytokine-treated and -untreated cell lines were collected at defined time points, centrifuged for 10 min at 1,280 rpm to discard the cell debris, and subsequently stored at −80°C. IL-6 release was quantified by using a commercially available ELISA kit (eBioscience) according to the manufacturer’s instructions.
Flow Cytometry Analysis
To evaluate expression of IFN-γ and TNF-α receptors, cells were stained with fluorescein isothiocyanate (FITC)-conjugated anti-interferon gamma receptor 1 (IFNGR1) mAb, allophycocyanin (APC)-conjugated anti-IFNGR2 mAb (R&D, Minneapolis, MN, USA), FITC-conjugated anti-tumor necrosis factor receptor 1 (TNFR1) mAb (Abcam), and phycoerythrin (PE)-conjugated anti-TNFR2 mAb (BD Pharmingen, San Diego, CA, USA). Data were acquired on a FACSCalibur® cytometer (Becton Dickinson, Franklin Lakes, NJ, USA) and analyzed by FlowJo software.
Immunohistochemistry
Representative 5-μm-thick sections of prostatic adenocarcinoma were cut from formalin-fixed and paraffin-embedded specimens and evaluated by immunohistochemistry with primary monoclonal antibodies anti-TNF-α (clone 52B83) and anti-IFN-γ (clone LLOSZ), using a Ventana Benchmark instrument (Ventana, Vreden, Germany). As positive controls, sections from reactive lymph nodes were used.
Scratch Wound Healing Assay
Cytokine-treated and -untreated cell lines were seeded in triplicates in six-well plates and grown until confluent. Identical scratches were generated both vertically and horizontally with a 200-µl sterile pipette tip, creating a cross-shaped empty area. Cellular debris were removed by washing with PBS. Cells were center-imaged at 5× magnification, using a Zeiss Axiovert 200 M microscope equipped with a Zeiss AxioCam MRm camera with maximum contrast (Carl Zeiss AG, Feldbach, Switzerland; software: Axio Vision Rel. 4.7). For cell stimulation, either IFN-γ or TNF-α were added to the wells at a final concentration of 300 U/ml. The closure rate of the empty area was analyzed after 12 and 24 h. Data were evaluated with T-scratch software with default parameter setting.
Boyden Chamber Invasion Assay
Cell invasion assays were performed in a Boyden chamber system using the Chemicon Cell Invasion Assay Kit (Millipore, Billerica, MA, USA), according to the manufacturer’s protocol. Cells were seeded in a 24-well plates (200,000 cells/well) in serum-free conditions in an ECMatrix-coated insert and stimulated with either cytokine afterward. Complete medium (10% FCS) was used as a chemoattractant and was placed in the bottom chamber of the plate. Cells were allowed to migrate for 48 h. Invading cells were then collected and quantified using the CyQuant GR dye (Millipore). All experiments were conducted in duplicate and repeated three times. Results are expressed as percentages of invading cells compared with unstimulated controls.
Urine Processing
For urine tests, 20 ml of urine collected before biopsy were centrifuged at 2,000 rpm for 10 min. Total RNA was extracted from cell pellet by adding 700 µl of lysis solution to the pellet (RNA Aqueous isolation kit, Ambion). The elution step was performed by adding twice 50 µl of DNAse/RNAse free water (final volume 100 µl). For reverse transcription, 30 µl of RNA were added to 30 µl of a mix prepared with the High Capacity cDNA Reverse Transcription Kits (Applied Biosystems). The IDO assay (Custom TaqMan primers and probe design; Applied Biosystems) was designed to cover the exon–exon junction between exon 9 and 10. Primers were designed to allow a melting temperature between 58 and 61°C, with an optimal length of 20 bp and CG content between 30 and 80%. The probe was designed not to start with G and in order to have a melting temperature 10°C higher than the one of the primers. A 3′ minor grove binder-probe [non-fluorescent quencher fitting the 5′ 6-carboxy fluorescein (FAM) spectral qualities] was used. Primers and probe were used at a final concentration of 400 and 200 nM, respectively. TaqMan assay sequences are described in patent PCT/EP2017/076169. Gene quantification was performed by qRT-PCR as described above.
Statistical Analysis
Statistical analyses were performed with GraphPad Prism (v5.1) and SPSS (v23). For the analysis of cell line data, the Mann–Whitney U test was used to compare the mean expression of specific genes or protein release for independent samples. For the analysis of patient data, non-parametric tests for gene expression levels (Mann–Whitney U test), correlation of gene expression between two factors (Spearman’s ρ), and frequency of expression between two groups of patients (Pearson χ2) were evaluated. For contingency table analysis, Fisher’s exact test was performed. For survival analysis, estimates of recurrence-free survival (RFS) were calculated by the Kaplan–Meier method and compared by the log rank test. Endpoint was time from surgery to BR, with censoring of data from patients who were BR negative at the time of their last follow-up visit. A univariate Cox regression analysis was performed to evaluate the hazard ratio (HR) for recurrence in IDO- and IL-6-positive patients. A multivariate Cox regression analysis was used to determine the independent prognostic relevance of both factors for the analyzable patients. For all tests, differences with P ≤ 0.05 were considered significant.
Results
IFN-γ and TNF-α Gene Expression in PCa Tissues
IFN-γ and TNF-α play key roles in acute and chronic inflammation. To obtain an insight into their potential relevance in PCa, we analyzed the expression of genes encoding these cytokines in tissue specimens from 64 patients collected after radical prostatectomy (RP) for primary PCa. Tissue specimens from patients treated for BPH (n = 35) were tested as controls.
Ex vivo analysis showed that IFN-γ and TNF-α genes are expressed with similar frequency in PCa and BPH. In particular, IFN-γ gene was expressed in 78 and 63% of cases, respectively (p = 0.1), whereas TNF-α gene expression was detected in 97% of PCa tissues and 90% of BPH tissues (p = 0.1) (Table 1). However, expression levels of both genes were significantly higher in BPH than in PCa specimens (IFN-γ, p < 0.01; TNF-α, p < 0.0001) (Figure 1A).
Table 1.
Distribution of tumor-derived soluble factors (TDSFs) gene expression in prostate cancer (PCa) and benign prostatic hyperplasia (BPH) tissues.
| TDSFs | Pca; n = 64 | BPH; n = 35 | p-Valuea |
|---|---|---|---|
| IFNγ | 50 (78%) | 22 (63%) | 0.1 |
| TNFα | 62 (97%) | 31 (90%) | 0.1 |
| IDO | 58 (91%) | 18 (51%) | <0.0001 |
| IL-6 | 47 (73%) | 18 (51%) | 0.03 |
aTwo-sided Pearson χ2 test.
Figure 1.

Expression of IFN-γ and TNF-α genes and immunohistochemical cytokine detection in prostate cancer (PCa) tissues. (A) Expression of IFN-γ and TNF-α genes in PCa (black triangles) and benign prostatic hyperplasia (BPH) (open triangles). A higher expression of both cytokine genes in BPH than in PCa tissue specimens was observed (Mann–Whitney U test, IFN-γ p < 0.01 and TNF-α p < 0.0001). The 2−ΔΔCt method was used to compute fold changes in gene expression for both cytokines, setting GAPDH gene expression equal to 1. Values ≤107 were considered undetectable. (B) Fold changes in IFN-γ gene expression in either BPH or PCa tissue specimens were plotted against fold changes in TNF-α gene expression in same specimens. A significant correlation was only observed in PCa (Spearman rank correlation coefficient, r = 0.42; p < 0.01). (C,D) A representative image by immunohistochemistry (original magnification 200×; slight hematoxylin conterstaining) of a poorly differentiated prostatic adenocarcinoma (Gleason score 9) tissue specimen stained with (C) IFN-γ or (D) TNF-α.
Remarkably, gene expression levels of these two pro-inflammatory cytokines were significantly correlated with each other in PCa (n = 49; r = 0.42; p < 0.01) (Figure 1B), but not in BPH tissues (n = 35, r = 0.2; p = 0.2, data not shown).
At the protein level, cancer cells showed only slight and focal cytoplasmic IFN-γ specific immunostaining and slight diffuse positivity along cell membranes to anti-TNF-α antibody. In contrast, interstitial inflammatory cells were intensely positive for both antibodies (Figures 1C,D).
Thus, consistent with putatively ongoing inflammation states, expression of both IFN-γ and TNF-α is detectable at the gene and protein level in both PCa and BPH tissues.
PCa Cells Express IFN-γ and TNF-α Receptors
IFN-γ and TNF-α expression in tissues urged us to explore the direct effects of these cytokines on PCa cells. As “in vitro” model, we chose two established cell lines originating from localized, CA-HPV-10, and metastatic, PC3, cancers. In preliminary experiments, we evaluated the expression of IFN-γ and TNF-α receptors in these cells. CA-HPV-10 and PC3 cells expressed IFNGR1 cytokine binding chain and, to higher extents, IFNGR2 accessory chain, at both gene (Figure 2A) and protein levels (Figures 2B,C). Furthermore, expression of the gene encoding TNFR1, the main receptor for soluble TNF-α (32), was detectable in both PCa cell lines (Figure 2D). However, TNFR1 protein expression was modest, and almost negligible in both cell lines, as assessed by Western blot and flow cytometry tests (data not shown).
Figure 2.

Interferon gamma receptors (IFNGRs) and tumor necrosis factor receptor 1 (TNFR1) gene and protein expression in prostate cancer (PCa) cell lines. (A) Gene expression of IFNGR1 (white bars) and IFNGR2 (gray bars) in PC3 and CA-HPV-10 cell lines. A higher expression of IFNGR2 than of IFNGR1 was observed in both cell lines (Mann–Whitney U test, PC3 p = 0.05 and CA-HPV-10 p = 0.02). (B) Mean fluorescence intensity (MFI) by fluorescent-activated cell sorting of IFNGR1 (white boxes) and IFNGR2 (gray boxes) specific staining in PC3 and CA-HPV-10 cell lines. (C) Representative overlaid histograms refer to MFI of IFNGR1 and IFNGR2, when compared with isotype staining. IFNGR2 was expressed to higher extents than IFNGR1 only in PC3 (Mann–Whitney U test, p = 0.03). IFNGR1 was expressed to a higher level in CA-HPV-10 than in PC3 cells (Mann–Whitney U test, p = 0.03). (D) TNFR1 gene expression in PC3 and CA-HPV-10 cell lines. No significant differences were observed between cell lines (Mann–Whitney U test).
Pro-Inflammatory Stimuli Enhance the Expression of Tumor-Derived Soluble Factors Involved in PCa Progression
IFN-γ and TNF-α receptor expression by PCa cells suggested that these cytokines could directly stimulate tumor cells. To address this issue, we analyzed the ability of IFN-γ and TNF-α to modulate the expression of a panel of genes encoding a variety of factors known to be produced by tumor cells and of potential relevance in tumor progression and inhibition of immune responses (33). These genes were expressed to different extents in the PCa cells under investigation. In particular, IDO, IL10, and HGF genes were constitutively expressed in PC3, but not in CA-HPV-10 cells whereas expression levels of IL6, ANG1, eNOS, and PDGF-BB genes were 2.5-fold higher in PC3 than in CA-HPV-10 cells. On the other hand, IL1β and MMP-9 were detected at higher levels in CA-HPV-10 than in PC3 (>2.5-fold). Additional genes, including TGFβ1, VEGF-A, -C, and -D, CCR7, MMP-2, ARG II, i-NOS, ANG2, and FRAG1, were similarly expressed in both cell lines. It is noteworthy that TNF-α gene was constitutively expressed in both cell lines, whereas IFN-γ was undetectable (Table 2).
Table 2.
Constitutive and cytokine-stimulated expression of genes encoding tumor-derived soluble factors involved in prostate cancer (PCa) progression (33).
| Constitutive expression over 24 h | Enhanced expression upon |
||||||
|---|---|---|---|---|---|---|---|
| |
IFNγ |
TNFα |
|||||
| CA-HPV-10 | PC3 | CA-HPV-10 | PC3 | CA-HPV-10 | PC3 | ||
| TGFβ1 | TGFβ1 | ||||||
| IL1β | IL1β | ||||||
| IL-6 | IL-6A | ||||||
| IL10 | IL10 | ||||||
| VEGF-A | VEGF-A | ||||||
| VEGF-C | VEGF-C | ||||||
| VEGF-D | VEGF-D | ||||||
| CCR7 | CCR7 | ||||||
| MMP2 | MMP2 | ||||||
| MMP9 | MMP9 | ||||||
| IDO | IDO | ||||||
| ARG II | ARG II | ||||||
| eNOS | eNOS | ||||||
| iNOS | iNOS | ||||||
| ANG 1 | ANG1 | ||||||
| ANG 2 | ANG2 | ||||||
| FRAG1 | FRAG1 | ||||||
| HGF | HGF | ||||||
| PDGF-BB | PDGF-BB | ||||||
| TNFα | TNFα | ||||||
| IFNγ | IFNγ | ||||||
 Constitutive gene expression, as compared with β-actin gene expression as 1,range 1.5- to 2.5-fold. Expression <1.5-fold no-reproducible gene.
 Significant relative gene expression (ΔΔCt ≥ 2.5-fold).
 Negligible expression (≤10−7).
 No relevant fold increase upon TNF-α or IFN-γ stimulation.
 Gene expression at 6 hours over the constitutive expression (ΔΔCt ≥ 2.5-fold).
 Gene expression at 12 hours over the constitutive expression (ΔΔCt ≥ 2.5-fold).
 Negligible expression (≤10−7).
Differential Effects of IFN-γ and TNF-α Stimulation of Established PCa Cell Lines
IFN-γ and TNF-α failed to modulate the expression of the large majority of the genes under investigation (Table 2). However, IFN-γ stimulation significantly enhanced IDO gene expression (>400-fold after 6 h) in PC3 cells (Figure 3A, black lines). In addition, IFN-γ induced upon 6 h stimulation the de novo expression of IDO gene in CA-HPV-10 cells at levels 10-fold higher than those constitutively observed in PC3 cells (Figure 3A, red lines). TNF-α stimulation also significantly enhanced IDO expression in PC3 cells 3.6-fold above constitutive levels, although to a lesser extent, when compared with IFN-γ induction (p = 0.03; Figure 3B). However, TNF-α failed to induce de novo IDO gene expression in CA-HPV-10 cells.
Figure 3.

Gene expression of indoleamine 2,3-dioxygenase (IDO) and interleukin (IL)-6 and their functional activity in cell lines. (A) IDO gene expression upon IFN-γ induction of either PC3 (black lines and circles) or CA-HPV-10 (red lines and squares) cell lines was calculated as twofold higher than its constitutive expression in PC3. The cytokine induced a significantly higher IDO fold increase in PC3 than in CA-HPV-10 cell lines at 6, 12, and 24 h (Mann–Whitney U test). (B) IDO gene expression upon TNF-α stimulation was 2-fold less than upon IFN-γ. (C) IDO activity was measured as the tryptophan/kynurenine ratio detected in the cell supernatants. IFN-γ (black squares) induced a stronger enzymatic activity of IDO than did TNF-α (black triangles) in PC3, while to a lesser extent in CA-HPV-10 (red triangles). The test was carried out with pooled supernatants from three different experiments for each cell line under investigation cultured in the indicated conditions. Due to the negligible expression of IDO at constitutive level in CA-HPV-10 (Table 2 for gene expression at constitutive level), we did not measure tryptophan/kynurenine ratio in the supernatant of unstimulated CA-HPV-10 (control). (D) Protein release (pg/ml) of IL-6 in supernatant of CA-HPV-10 (above) or PC3 (below) cell lines treated with IFN-γ (light gray bars) or TNF-α (dark gray bars), when compared with untreated cell lines (white bars). Overall, TNF-α induced the highest release of the cytokine, compared with IFN-γ induction, in both cell lines at all-time points tested (Mann–Whitney U test). (E) Cell migration was assessed by a scratch wound healing assay, as shown in one representative experiment out of three by confocal microscopy. In our experimental conditions, CA-HPV-10 showed very limited migratory capability, which was unaffected by either cytokine, while PC3 showed a constitutively high motility, which was significantly enhanced by TNF-α (12 h, p < 0.01; 24 h, p < 0.001). (F) Boxes and whiskers representing migration potential of PC3 cells based on the quantification in percentage of empty area when compared with time 0 (100% empty area) upon treatment with IFN-γ (light gray boxes) or TNF-α (dark gray boxes) at time points of 12 h (p < 0.01) and 24 h (p < 0.0001; two-way ANOVA test) when compared with control. Data are expressed as averages of triplicates for each condition. (G) For the Boyden chamber cell invasion analysis, cells were allowed to invade the membrane matrix for 48 h. The invading cells were then collected and quantified using the CyQuant GR dye to measure the invasiveness of both CA-HPV-10 and PC3 after treatment with IFN-γ (black bars) or TNF-α (gray bars). We observed that TNF-α strongly increased the invasiveness of both CA-HPV-10 (54.08 ± 0.12%, p = 0.04) and PC3 (59.67 ± 0.21%, p = 0.03), when compared with IFN-γ-treated cells (CA-HPV-10, 8.08 ± 0.29%; PC3, 21.96 ± 0.19%). The results were calculated as percentages of invading cells compared with unstimulated controls. All experiments were conducted in duplicate and repeated three times.
To validate these findings, we evaluated IDO functional activity by testing tryptophan/kynurenine ratios in culture supernatants. In agreement with gene expression results, consistent with increased IDO functional activity, a marked decrease in tryptophan/kynurenine ratio was observed in supernatants from IFN-γ and TNF-α treated PC3 cells and from IFN-γ stimulated CA-HPV-10 cells. Notably, in PC3 cells, IDO activity was increased upon 6 h IFN-γ induction whereas upon TNF-α stimulation, it was significantly detectable only after 12 h. In keeping with qRT-PCR data indicating de novo IDO gene expression upon IFN-γ stimulation, increased IDO-related enzymatic activity in CA-HPV-10 cells was detectable with delayed kinetics after 24–72 h (Figure 3C). As expected, TNF-α treatment of CA-HPV-10 cells was ineffective (negligible expression in Table 2).
On the other hand, TNF-α, but not by IFN-γ, induced overexpression of IL-6 gene in both PC3 and CA-HPV-10 cells (Table 2) and, in accord with gene expression data, IL-6 release in supernatants of IFN-γ and TNF-α stimulated cells was significantly enhanced in both cell lines by TNF-α treatment (Figure 3D). Given the direct involvement of IL-6 in PCa progression (25), we performed two functional assays to investigate the effect of TNF-α and IFN-γ on the ability of PCa cells to migrate and invade. In our experimental conditions, CA-HPV-10 showed very limited migratory capability, which was unaffected by either cytokine, whereas PC3 showed a constitutively high motility, which was significantly enhanced by TNF-α (12 h, p < 0.01; 24 h, p < 0.001) (Figures 3E,F). In addition, we observed that TNF-α strongly increased the invasiveness of PC3 by 53% (p = 0.03) and the invasiveness of CA-HPV-10 to a lesser extent by 32% (p = 0.04), when compared with IFN-γ-treated (PC3 24% and CA-HPV-10 8%) or -untreated cells (Figure 3G). Taken together these data indicate that inflammatory cytokines potentially present in PCa microenvironment are able to upregulate the expression of a restricted number of genes encoding factors of interest in PCa immunobiology.
IFN-γ and TNF-α Activate JAK1/2 and p38MAPK Pathways in PCa, Respectively
To confirm the ability of IFN-γ and TNF-α to stimulate PCa cells, we investigated the ability of well-characterized inhibitors of their signal transduction pathways to prevent their effects. Inhibition of the JAK1/2 pathway by ruxolitinib dramatically reduced IDO gene expression induced by IFN-γ in both PC3 (p = 0.02) and CA-HPV10 (p = 0.04) cells (Figure 4A). In contrast, NF-kB, p38MAPK, and PI3K inhibitors were ineffective (data not shown). Instead, inhibition of the p38MAPK pathway by SB202190 markedly reduced TNF-α-induced expression of IL-6 (p < 0.01), and IDO (p = 0.01) genes in PC3 cells and of IL-6 (p = 0.02) gene in CA-HPV10 cells (Figure 4B). However, inhibition of the NF-kB and PI3K pathways with PDTC and LY294992, respectively, did not significantly affect TNF-α stimulation in either cell lines (data not shown), suggesting a hierarchy of signal transduction checkpoints.
Figure 4.
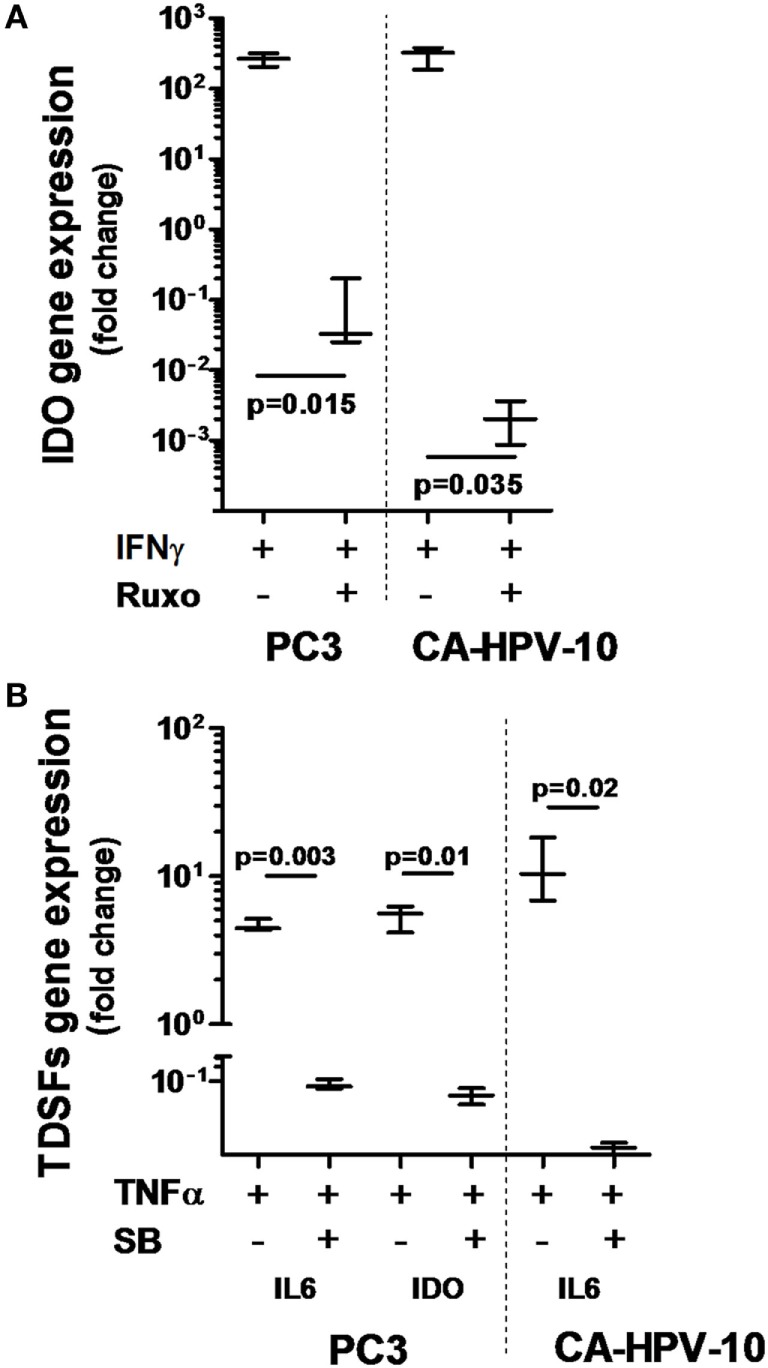
Interferon gamma receptor 1, 2 and tumor necrosis factor receptor 1 involvement in IFN-γ- and TNF-α-dependent indoleamine 2,3-dioxygenase (IDO) and interleukin (IL)-6 production. (A) IDO gene expression upon IFN-γ stimulation was significantly reduced by inhibition of the JAK-STAT signaling pathway with ruxolitinib in both cell lines tested (about 4-log less in PC3 and 5-log less in CA-HPV-10 cell lines). (B) The expression of IL-6 and IDO genes upon TNF-α stimulation was significantly reduced by inhibition of the p38MAPK kinase signaling pathway with SB202190 in both cell lines (Mann–Whitney U test). Experiments were conducted in triplicate and data are shown as box and whisker plot with SDs.
Gene Expression Profiling in Clinical Specimens
“In vitro” data indicated that IFN-γ and TNF-α were able to enhance expression of IDO and IL-6 at the gene and protein level in PCa cells. Based on this background, we explored the expression of genes encoding these factors and their correlations in surgical BPH and PCa specimens.
Consistent with previous reports from our group (9), we observed that the frequency of detection of IDO (91% in PCa vs. 51% in BPH, p < 0.0001) and IL-6 (73% in PCa vs. 51% in BPH, p = 0.03) gene expression were significantly higher in PCa than in BPH tissues (Table 1). Similarly, their expression levels (IDO: p < 0.001 and IL-6: p < 0.0001) were significantly higher in PCa than in BPH tissues (Figures 5A,B).
Figure 5.

Gene expression profiling in clinical specimens. Gene expression of (A) Indoleamine 2,3-dioxygenase (IDO) and (B) interleukin (IL)-6 genes in prostate cancer (PCa) (black triangles) and benign prostatic hyperplasia (BPH) (open triangles). A higher expression of IDO and of both cytokine genes was detected in PCa than in BPH tissue specimens (Mann–Whitney U test; IDO p < 0.001, IL-6 p < 0.0001). The 2−ΔΔCt method was used to compute fold changes in gene expression for both cytokines, setting GAPDH gene expression equal to 1. Values ≤107 were considered undetectable. (C,D) Fold changes in (C) IDO and (D) IL-6 gene expression in PCa tissue specimens were plotted against fold changes in IFN-γ (left panels) or TNF-α (right panels) gene expression in same specimens. A significant correlation was observed in all panels (Spearman rank correlation coefficient). (E) Gene expression of interferon gamma receptor 1, 2 (IFNGR1 and 2) in PCa (black triangles) and BPH (open triangles). A significantly higher expression of IFNGR2 than of IFNGR1 in both BPH and PCa tissue specimens was observed (Mann–Whitney U test, p < 0.0001). IFNGR1 gene was significantly more expressed in PCa than in BPH (Mann–Whitney U test, p < 0.0001). The 2−ΔΔCt method was used to compute fold changes in gene expression in both receptors, setting GAPDH gene expression equal to 1. Values ≤107 were considered undetectable. (F) Gene expression of tumor necrosis factor receptor 1 in PCa (black triangles) and BPH (open triangles). A significantly higher expression of the receptor was observed in PCa than in BPH tissue specimens (Mann–Whitney U test, p < 0.01). The 2−ΔΔCt method was used to compute fold changes in gene expression in both receptors, setting GAPDH gene expression equal to 1. Values ≤107 were considered undetectable.
Most interestingly, in PCa patients, IDO gene expression levels appeared to highly significantly correlate with those of IFN-γ (n = 48, r = 0.54; p < 0.001), and, to a lower extent, of TNF-α gene (n = 58, r = 0.37; p < 0.01) (Figure 5C). Intriguingly, but consistent with our “in vitro” data, levels of IL-6 gene expression correlated more significantly with those of TNF-α (n = 46, r = 0.56; p < 0.0001) than with those of IFN-γ (n = 39, r = 0.41; p < 0.01) gene expression (Figure 5D).
Prompted by these data, we also analyzed the expression of genes encoding IFN-γ and TNF-α receptors in clinical specimens. In our cohort of PCa patients, IFNGR2 gene expression was similar in PCa and BPH tissues. In contrast, expression of IFNGR1 gene, encoding the cytokine binding chain of the receptor, was significantly higher in PCa than in BPH tissues (p < 0.0001) (Figure 5E). Notably, TNFR1 gene also appeared to be expressed to significantly higher extents in PCa than in BPH specimens (p < 0.01) (Figure 5F).
IDOhigh Patients Are at Higher Risk of Developing BR in PCa
Our “in vitro” results indicated that IFN-γ and TNF-α were able to enhance the expression of IDO and IL-6 at gene and protein level in PCa cells. Furthermore, “ex vivo” data documented that both IDO and IL-6 genes are expressed to higher extents in PCa than in BPH, and that their expression is highly significantly correlated with that of IFN-γ and TNF-α genes. Taken together these results urged us to address the prognostic significance of IDO and IL-6 gene expression in 97 PCa, following RP.
We focused our analysis on the timing of so-called BR, as defined by PSA values ≥0.1 ng/ml. The prognostic relevance of the genes under investigation was evaluated using receiver operating characteristic (ROC) curve analysis. For IDO, the calculated area under the curve (AUC) for RFS was 0.78 (95% CI, 0.67–0.88%) (Figure 6A). ROC analysis for RFS defined an optimal cutoff level of 9.83 × 10⁻⁴ to dichotomize the patients into IDOhigh and IDOlow groups (specificity 78%, sensitivity 67%). Estimated rate of 5-year RFS was 32% (95% CI, 26–38%, SE = 3.02) for IDOhigh patients and 55% (95% CI, 49–60%; SE = 2.8; p < 0.001) for IDOlowpatients (Figure 6B). Overall, BR + patients showed a significantly higher expression of IDO gene than BR− patients (p < 0.001, Figure 6C). Cox regression analysis indicated that IDOhigh PCa patients had a higher risk of BR than did IDOlow PCa patients (HR 3.1, p < 0.01, Table 3). In multivariate analysis, IDOhigh PCa patients maintained a significant higher risk of BR than IDOlow PCa patients, irrespective of established predictors (Table 4).
Figure 6.

Indoleamine 2,3-dioxygenase (IDO) tumor-specific expression is a strong prognostic factor for biochemical recurrence (BR) in prostate cancer (PCa). (A) Receiver operating characteristic (ROC) curve analysis was used to evaluate the prognostic relevance of IDO gene expression. The area under the curve for recurrence-free survival (RFS) was 0.78 (95% CI, 0.67–0.88%) with an optimal cutoff level of 9.83 × 10⁻⁴ to dichotomize the patients into IDOhigh and IDOlow groups (specificity 78%, sensitivity 67%). (B) Kaplan–Meier estimates of RFS stratified by the established cutoff for IDO gene expression in PCa tissue specimens (IDO 9.83 × 10⁻⁴). The survival analysis was based on time of BR (RFS with a median survival of 29 months; 95% CI, 22–36%; p < 0.0001, two-sided log rank test). (C) IDO gene expression in PCa tissue specimens was higher in BR-positive than in BR-negative patients (p < 0.001, Mann–Whitney U test), with a clear association between IDO gene levels and evidence of BR (prostate-specific antigen ≥ 0.1 ng/ml) (Pearson χ2 test).
Table 3.
Univariate Cox regression analysis of the risk of biochemical recurrence associated with indoleamine 2,3-dioxygenase (IDO) and interleukin (IL)-6 gene expression.
| Variable | Parameter | HR | 95% CI | p-Value |
|---|---|---|---|---|
| IDO gene expression | IDOhigh vs. IDOlow | 3.11 | 1.3–7.41 | <0.01 |
| IL-6 gene expression | IL-6high vs. IL-6low | 0.87 | 0.39–1.96 | 0.7 |
HR, hazard ratio.
All p-values were two-sided.
Table 4.
Multivariate Cox regression analysis of the risk of biochemical recurrence (BR) associated with indoleamine 2,3-dioxygenase (IDO) gene expression level stratification adjusted for tumor stage (>3 vs ≥3) and Gleason score (≥6 vs ≥7).
| Variable | Parameter | HR | 95% CI | p-Value |
|---|---|---|---|---|
| IDO gene expression | IDOhigh vs. IDOlow | 2.97 | 1.22–7.24 | 0.002 |
| Gleason score | ≥5–6 vs. ≤ 7–9 | 1.25 | 0.47–3.3 | 0.7 |
| Tumor stage | pT ≥ 3 vs. pT < 3 | 1.51 | 0.41–5.61 | 0.5 |
HR, hazard ratio.
All p-values were two-sided.
For IL-6, 95% CI of AUC persistently included the 0.50 limit, consistent with a lack of prognostic potential. Indeed, neither a significant association between IL-6 gene expression levels and BR nor a significant impact on RFS were detectable (Figure S1 in Supplementary Material).
Contingency table analysis did not provide any evidence for an association between IDO gene expression in tumor specimens and three classical clinicopathological parameters, PSA, pT, and Gleason score, while IL-6 gene expression was associated with PSA (p = 0.02) and showed a trend toward association with Gleason score (p = 0.06) (Table 5).
Table 5.
Distribution of clinical–pathological characteristics, in cancer sorted according to indoleamine 2,3-dioxygenase (IDO) or interleukin (IL)-6 gene expression levels.
| Factors | ||||||
|---|---|---|---|---|---|---|
| Characteristics | IDOhigh,n = 26 | IDOlow,n = 71 | p-Value | IL-6high,n = 47 | IL-6low,n = 50 | p-Valuea |
| PSA at diagnosis | ||||||
| <10 ng/mL | 16 | 51 | 1 | 36 | 31 | 0.02 |
| >10 ng/mL | 6 | 20 | 7 | 19 | ||
| Missing | 0 | 4 | 4 | 0 | ||
| Tumor stage | ||||||
| <pT3 | 5 | 16 | 1 | 13 | 7 | 0.2 |
| >pT3 | 15 | 49 | 30 | 35 | ||
| Missing | 3 | 9 | 4 | 8 | ||
| Gleason score | ||||||
| ≤7 (3 + 4) | 9 | 25 | 0.6 | 21 | 13 | 0.06 |
| ≥7 (4 + 3) | 13 | 50 | 26 | 37 | ||
| Missing | 0 | 0 | 0 | 0 | ||
aTwo-sided Fisher’s exact test.
IDO as Diagnostic and Prognostic Tool When Detected at Gene Level in Urine of Men at Risk of Developing PCa
Capitalizing on data from surgical specimens, we hypothesized that IDO might represent a novel biomarker for PCa in urine. We studied 27 patients undergoing first time prostate biopsy for being at risk of PCa (based on positive digital rectal examination (DRE) and PSA serum level >4 ng/ml). Nineteen out of 27 prostate biopsies were positive for PCa (localized PC), while 4 were BPH and 4 were negative (normal tissue). Our data show that the quantification of IDO mRNA in urine of patients before undergoing biopsy for diagnostic procedures has a very promising ability to identify those harboring PCa. The AUC to dichotomize individuals based on the presence or absence of cancer defined a cutoff level of 0.0015 (Figure 7A). Therefore, with IDO ≤ 0.0015 gene expression levels, PCa risk is negligible (NPV 100%, PPV 82%). The AUC to dichotomize patients with indolent or aggressive PCa based on GS defined a cutoff level of 0.0096 (Figure 7B). It says that 87.5% of patients with indolent PCa (GS ≤ 6 and BR− and no treatment after biopsy), 100% of patients with no PCa, and 27% of patients with clinically relevant PCa (GS ≥ 7, BR−, treatment after biopsy) expressed IDO below 0.0096 (73% of patients with clinically relevant PCa above 0.0096; NPV 83%, PPV 88%) (Figure 7C). Overall, the IDO test might reduce the number of unnecessary biopsies by 14.8% with cutoff 0.0015 and 66.6% with cutoff 0.0096. Detection of IL-6 in urines of same individuals was neither effective in predicting patients bearing PCa nor in identifying, among diagnosed PCa, those at risk of developing an aggressive tumor (data not shown).
Figure 7.

Indoleamine 2,3-dioxygenase (IDO) gene expression in urine sediments of individuals at risk of developing prostate cancer (PCa). IDO relative gene expression was analyzed in urine sediments from patients collected without previous manipulation of the prostate. (A) Definition of the thresholds for IDO mRNA for the probability of having PCa. The area under the curve (AUC) for the presence/absence of PCa was 0.93 (95% CI, 0.84–1.03%) with an optimal cutoff level of 0.0015 to dichotomize the patients into PCa positive and PCa negative (specificity 100%, sensitivity 75%). (B) Definition of the thresholds for IDO mRNA for the probability of having a clinically relevant (GS ≥ 7) than an indolent (GS ≤ 6) PCa. GS was evaluated from the biopsy or after prostatectomy, when available. The AUC for indolent/aggressive PCa was 0.84 (95% CI, 0.66–1%) with an optimal cutoff level of 0.0095 (specificity 89%, sensitivity 80%). (C) Cutoff a (≤0.0015), assignment to biopsy for the risk of having PCa (NPV = 100%, PPV = 82%). Cutoff b (≥0.0096), assignment to biopsy for the risk of having clinically relevant PCa (NPV 83%, PPV 88%). A value of 0.0479 (black square) represents the risk of having biochemical recurrence within 5 years from prostatectomy.
Discussion
Pre-existing chronic inflammation has repeatedly been reported to play a key role in PCa outgrowth and progression (4). However, underlying molecular mechanisms are largely unclear. In this study, we have utilized clinical specimens and established cell lines to obtain innovative insights into the relationship occurring between expression of IFN-γ and TNF-α pro-inflammatory cytokines in PCa tissues, and tumor progression.
Our data indicate that expression of genes encoding IFN-γ and TNF-α is detectable in both BPH and PCa specimens. Intriguingly, the expression of both genes is significantly higher in BPH than in PCa tissues (34). However, expression of specific receptors appears to be higher in PCa than in BPH. Thus, these cytokines, produced by a variety of interstitial inflammatory cells, might be highly effective within malignant tissues. Remarkably, expression of IFN-γ and TNF-α genes is significantly correlated only in PCa, suggesting common induction mechanisms.
We used an in vitro model based on cell lines originating from localized, CA-HPV-10, and metastatic, PC3, disease to address direct effects of IFN-γ and TNF-α on PCa cells. Among a group of genes responsible for cell contact independent mechanism of tumor promotion and reportedly impacting on cancer progression (33), IDO and IL-6 genes were the only ones consistently overexpressed in PCa cells upon stimulation with IFN-γ or TNF-α. In particular, IFN-γ induced IDO gene upregulation in both cell lines under investigation, whereas TNF-α induced IL-6 gene overexpression in both cell lines and IDO gene overexpression in PC3 cells.
These findings, supported by ELISA and functional data have prompted us to investigate their clinical significance. Ex vivo results indicate that expression of IDO and IL-6 genes in PCa tissues is significantly correlated with IFN-γ and TNF-α gene expression. Most importantly, we observed that IDO, but not IL-6, gene expression predicts BR.
Taken together our data confirm and extend previous reports from our group (9). More interestingly, they unravel novel molecular mechanisms underlying the association between inflammation and PCa progression and suggest that cancer cell-specific molecular alterations (35) and concomitant inflammation (13), might independently contribute to give rise to highly aggressive PCa.
Indoleamine 2,3-dioxygenase is a tryptophan-depleting enzyme that has been thoroughly investigated by immunologists because of its involvement in the mechanisms of immune regulation (24). IDO blunts T lymphocyte expansion (36), thereby powerfully inhibiting adaptive immune responses. On the same line, more recently, IDO has been shown to induce resistance to treatment with therapeutic monoclonal antibodies targeting immunological checkpoints (37). These effects have been shown to be mediated, at least in part, by regulatory T cells-dependent recruitment and activation of myeloid-derived suppressor cells (38).
Most interestingly, in murine cancer models, high-IDO activity, resulting in accelerated tumor progression, is associated to immune responses and to high expression in the tumor microenvironment of pro-inflammatory cytokines, including IFN-γ and TNF-α (37). Notably, IFN-γ and TNF-α have previously been shown to powerfully synergize in the induction of IDO, although to different extents (39–42).
Exogenous administration of TNF-α also induced IL-6 release in both cell lines under investigation. IL-6 gene expression was also detected at significantly higher levels in PCa than in BPH specimens and was highly significantly correlated with TNF-α gene expression, but it did not impact on RFS. Indeed, IL-6 has been reported to contribute to the onset of castration-resistant PCa by activating alternative pathways involved in cancer survival and proliferation and by inducing androgen receptor overexpression in tumor cells (43). However, although IL-6 plasma levels have been suggested to predict severe prognosis (44–46), targeted treatments with therapeutic monoclonal antibodies have proved ineffective (47, 48).
Our results delineate a scenario where tumor cells may produce IDO, promoting the generation of an immune-suppressive microenvironment upon stimulation by pro-inflammatory cytokines, mainly IFN-γ. Therefore, while IDO would not “per se” induce PCa, it might favor its progression. Indeed, pro-inflammatory cytokines are also produced in conditions unrelated to neoplastic transformation. Interestingly, however, the involvement of IFN-γ in the development of prostate inflammation, such as prostatitis, is debated. Seminal plasma from patients with chronic prostatitis (CP)/chronic pelvic pain syndrome show significantly higher levels of TNF-α and IL-1β when compared with those from healthy subjects (49), while no involvement of IFN-γ has been reported (50, 51). Hence, the inflammatory status in CP appears to be mainly due to the involvement of TNF-α and the IL-1β/IL-6 axis (52). Our data suggest that TNF-α marginally contributes to modulate IDO gene expression patterns and enzymatic activity (39, 40).
Clarification of molecular mechanisms underlying inflammation-induced immune suppression might increase our ability to monitor the progression of PCa from a slow-growing, organ-confined tumor to a highly invasive, and castration-resistant malignancy. Our data from urine sediment of men undergoing first time fine needle biopsy for PCa diagnosis show that patients with elevated IDO gene expression levels are at high risk of harboring a clinically relevant form of PCa and have a higher probability of relapsing after prostatectomy. Despite the limited number of subjects screened, the strength of this pilot study is represented by its high sensitivity. None of the subjects found positive for the presence of PCa showed IDO gene expression level below the optimal cutoff level of 0.0015, as defined by ROC to dichotomize the patients into PCa positive and PCa negative (PPV 100%, no false negative). In addition, two patients negative for PCa with IDO gene expression levels in urine below the optimal cutoff of 0.0015 showed light inflammatory foci compatible with low-grade inflammation, as observed in biopsy material at histological level.
This novel screening approach based on the IDO mRNA levels in urine could offer innovative guiding tools for patient management thereby helping to avoid overtreatment. Furthermore, it would reduce the number of individuals undergoing prostate biopsy, as dictated by the low-sensitive PSA test. In addition, the test is quick, cost-effective, and it does not require DRE/prostate massage for reliable read-out in the urine sediment.
Limitations of our work should be acknowledged. In particular, our study largely relies on gene expression analysis and we could not address specific protein detection in clinical specimens. While gene expression does not always accurately reflect protein levels due to post-translational regulation, major obstacles for cytokine detection by immunohistochemistry are represented by the low sensitivity of available reagents and the frequently diffuse staining. In contrast, qRT-PCR is straightforward and allows detection of the expression of multiple cytokine genes from same specimen (53, 54). On a similar line, IDO protein detection is challenging since most specific commercial reagents are characterized by a relatively low sensitivity. Therefore, target protein is usually only observed in the presence of high levels of gene expression, as described in a previous report (9). However, our data indicate that tryptophan/kynurenine ratios are dramatically decreased in supernatants of cytokine-stimulated PCa cells, consistent with the production of functionally active enzyme (Figure 3C). Furthermore, most interestingly, recent studies, taking advantage of newly developed, non-commercially available reagents, clearly indicate that IDO protein expression is detectable in tumor cells in 20% of clinical PCa specimens (55).
On the other hand, while correlations between the expression of the genes under investigation and clinical course were revealed by our study, mechanistic aspects remain largely unclear and warrant further research taking advantage of updated experimental models and of the availability more effective reagents.
Analysis of larger cohorts of patients will also be needed to validate the clinical relevance of our data. Interestingly, the analysis of a larger cohort of about 500 samples, although provisional (TCGA; www.cbioportl.org), is in contrast with our finding concerning the association between high-IDO expression and survival of PCa. However, a critical requirement will be represented by a strict standardization of patient treatment and sample collection. Indeed, TCGA databases are generated upon evaluation of specimens from more heterogeneous cohorts of patients, undergoing a variety of different therapeutic procedures. Cases considered in our report were all from patients treated by the same group of urologists according to standardized procedures, including indications and timing for surgery and follow-up. Moreover, our gene expression data were analyzed by using specific ROC curves deriving from the combined analysis of qRT-PCR tests performed in a single lab and clinical results. In addition, TCGA data were obtained by RNA seq, a less sensitive technique, when compared with qRT-PCR.
A major problem in PCa treatment is represented by the individuation of patients requiring more aggressive therapeutic approaches, while avoiding overtreatment of the others. Therefore, the characterization of predictive PCa markers is of paramount clinical importance. Within this context, our results identify IDO as a predictor of poor prognosis in PCa, and the corresponding protein as a potential therapeutic target.
Ethics Statement
This study was carried out in accordance with the recommendations of Ethical Committee of Basel-Stadt and Basel-Land (EKBB, Ref. Nr. EK: 176/07) and Ethic Committee of Zurich (ZH-NR: 2010-0081/0). The protocol was approved by the Ethical Committee of Basel-Stadt and Basel-Land and Ethic Committee of Zurich. All subjects gave written informed consent in accordance with the Declaration of Helsinki.
Author Contributions
IB, GCS, and MP conceived the study. IB, CM, GM, AC, RB, GS, TSS, and GC performed the experiments. IB, CM, AC, GS, TSS, and GC analyzed the data. SW, TH, and MP performed sample collection. SW, TH, AB, and TS arranged clinical aspect. IB, CM, GCS, and MP wrote the paper. GCS and MP supervised the project.
Conflict of Interest Statement
The authors declare that the research was conducted in the absence of any commercial or financial relationships that could be construed as a potential conflict of interest.
Footnotes
Funding. This study was supported by Technologietransfer der Universitäten Basel, Bern und Zürich.
Supplementary Material
The Supplementary Material for this article can be found online at https://www.frontiersin.org/articles/10.3389/fimmu.2018.01051/full#supplementary-material.
Prognostic value of IL-6 gene expression in tumor samples. (A) Receiver operating characteristic (ROC) analysis to calculate the prognostic value of IL-6. The area under the curve (AUC) for recurrence-free survival (RFS) was 0.51 (95% CI, 0.37–0.65%) with no evidence for a prognostic potential. (B) Kaplan–Meier estimates of RFS stratified by an arbitrary cutoff (50th percentile) for IL-6 gene expression in PCa tissue specimens. The survival analysis was based on the time of BR. The estimated rate of 5-year RFS was 53% (95% CI, 48–58%; SE 2.7%) for IL-6high patients and 50% (95% CI, 44–55%; SE 3.03%; p = 0.8, two-sided log rank test) for IL-6low patients. (C) IL-6 gene expression in PCa tissue specimens was not significantly higher in BR-positive than in BR-negative patients (p = ns, Mann–Whitney U test). In addition, no association between IL-6 gene levels and evidence of BR (PSA ≥ 0.1 ng/ml) was documented (Pearson χ2 test).
Abbreviations
PCa, prostate cancer; BPH, benign prostatic hyperplasia; TUR-P, transurethral resection of the prostate; CRPC, castration-resistant prostate cancer; BR, biochemical recurrence; PSA, prostate-specific antigen; TDSF, tumor-derived soluble factors; IDO, indoleamine 2, 3-dioxygenase; TNFR1, tumor necrosis factor receptor 1; IFNGR1, 2, interferon gamma receptor 1, 2; RFS, recurrence-free survival; AUC, area under the curve; ROC, receiver operating characteristic.
References
- 1.Hanahan D, Weinberg RA. Hallmarks of cancer: the next generation. Cell (2011) 144:646–74. 10.1016/j.cell.2011.02.013 [DOI] [PubMed] [Google Scholar]
- 2.Sfanos KS, Hempel HA, De Marzo AM. The role of inflammation in prostate cancer. Adv Exp Med Biol (2014) 816:153–81. 10.1007/978-3-0348-0837-8_7 [DOI] [PubMed] [Google Scholar]
- 3.De Marzo AM, Nakai Y, Nelson WG. Inflammation, atrophy, and prostate carcinogenesis. Urol Oncol (2007) 25:398–400. 10.1016/j.urolonc.2007.05.007 [DOI] [PubMed] [Google Scholar]
- 4.De Marzo AM, Platz EA, Sutcliffe S, Xu J, Gronberg H, Drake CG, et al. Inflammation in prostate carcinogenesis. Nat Rev Cancer (2007) 7:256–69. 10.1038/nrc2090 [DOI] [PMC free article] [PubMed] [Google Scholar]
- 5.Cao Y, Ma J. Body mass index, prostate cancer-specific mortality, and biochemical recurrence: a systematic review and meta-analysis. Cancer Prev Res (Phila) (2011) 4:486–501. 10.1158/1940-6207.CAPR-10-0229 [DOI] [PMC free article] [PubMed] [Google Scholar]
- 6.Thomas JA, II, Freedland SJ. Obesity and prostate cancer: collateral damage in the battle of the bulge. Front Biosci (Schol Ed) (2011) 3:594–605. [DOI] [PubMed] [Google Scholar]
- 7.Moreira DM, de OFDM, Nickel JC, Andriole GL, Castro-Santamaria R, Freedland SJ. The combination of histological prostate atrophy and inflammation is associated with lower risk of prostate cancer in biopsy specimens. Prostate Cancer Prostatic Dis (2017) 20:413–7. 10.1038/pcan.2017.30 [DOI] [PubMed] [Google Scholar]
- 8.Vasavada SR, Dobbs RW, Kajdacsy-Balla AA, Abern MR, Moreira DM. Inflammation on prostate needle biopsy is associated with lower prostate cancer risk: a meta-analysis. J Urol (2018) 199(5):1174–81. 10.1016/j.juro.2017.11.120 [DOI] [PubMed] [Google Scholar]
- 9.Feder-Mengus C, Wyler S, Hudolin T, Ruszat R, Bubendorf L, Chiarugi A, et al. High expression of indoleamine 2,3-dioxygenase gene in prostate cancer. Eur J Cancer (2008) 44:2266–75. 10.1016/j.ejca.2008.05.023 [DOI] [PubMed] [Google Scholar]
- 10.Mengus C, Le Magnen C, Trella E, Yousef K, Bubendorf L, Provenzano M, et al. Elevated levels of circulating IL-7 and IL-15 in patients with early stage prostate cancer. J Transl Med (2011) 9:162. 10.1186/1479-5876-9-162 [DOI] [PMC free article] [PubMed] [Google Scholar]
- 11.Culig Z. Cytokine disbalance in common human cancers. Biochim Biophys Acta (2011) 1813:308–14. 10.1016/j.bbamcr.2010.12.010 [DOI] [PubMed] [Google Scholar]
- 12.Gabrilovich DI, Nagaraj S. Myeloid-derived suppressor cells as regulators of the immune system. Nat Rev Immunol (2009) 9:162–74. 10.1038/nri2506 [DOI] [PMC free article] [PubMed] [Google Scholar]
- 13.Mantovani A, Allavena P, Sica A, Balkwill F. Cancer-related inflammation. Nature (2008) 454:436–44. 10.1038/nature07205 [DOI] [PubMed] [Google Scholar]
- 14.Shalapour S, Karin M. Immunity, inflammation, and cancer: an eternal fight between good and evil. J Clin Invest (2015) 125:3347–55. 10.1172/JCI80007 [DOI] [PMC free article] [PubMed] [Google Scholar]
- 15.Larkin SE, Johnston HE, Jackson TR, Jamieson DG, Roumeliotis TI, Mockridge CI, et al. Detection of candidate biomarkers of prostate cancer progression in serum: a depletion-free 3D LC/MS quantitative proteomics pilot study. Br J Cancer (2016) 115:1078–86. 10.1038/bjc.2016.291 [DOI] [PMC free article] [PubMed] [Google Scholar]
- 16.Cabal-Hierro L, Lazo PS. Signal transduction by tumor necrosis factor receptors. Cell Signal (2012) 24:1297–305. 10.1016/j.cellsig.2012.02.006 [DOI] [PubMed] [Google Scholar]
- 17.Siegmund D, Kums J, Ehrenschwender M, Wajant H. Activation of TNFR2 sensitizes macrophages for TNFR1-mediated necroptosis. Cell Death Dis (2016) 7:e2375. 10.1038/cddis.2016.285 [DOI] [PMC free article] [PubMed] [Google Scholar]
- 18.Stolting MN, Ferrari S, Handschin C, Becskei A, Provenzano M, Sulser T, et al. Myoblasts inhibit prostate cancer growth by paracrine secretion of tumor necrosis factor-alpha. J Urol (2013) 189:1952–9. 10.1016/j.juro.2012.10.071 [DOI] [PubMed] [Google Scholar]
- 19.Chu WM. Tumor necrosis factor. Cancer Lett (2013) 328:222–5. 10.1016/j.canlet.2012.10.014 [DOI] [PMC free article] [PubMed] [Google Scholar]
- 20.Szlosarek P, Charles KA, Balkwill FR. Tumour necrosis factor-alpha as a tumour promoter. Eur J Cancer (2006) 42:745–50. 10.1016/j.ejca.2006.01.012 [DOI] [PubMed] [Google Scholar]
- 21.Tan H, Zeng C, Xie J, Alghamdi NJ, Song Y, Zhang H, et al. Effects of interferons and double-stranded RNA on human prostate cancer cell apoptosis. Oncotarget (2015) 6:39184–95. 10.18632/oncotarget.5508 [DOI] [PMC free article] [PubMed] [Google Scholar]
- 22.Fujita K, Ewing CM, Isaacs WB, Pavlovich CP. Immunomodulatory IL-18 binding protein is produced by prostate cancer cells and its levels in urine and serum correlate with tumor status. Int J Cancer (2011) 129:424–32. 10.1002/ijc.25705 [DOI] [PMC free article] [PubMed] [Google Scholar]
- 23.Wang X, Breeze A, Kulka M. N-3 polyunsaturated fatty acids inhibit IFN-gamma-induced IL-18 binding protein production by prostate cancer cells. Cancer Immunol Immunother (2015) 64:249–58. 10.1007/s00262-014-1630-z [DOI] [PMC free article] [PubMed] [Google Scholar]
- 24.Uyttenhove C, Pilotte L, Theate I, Stroobant V, Colau D, Parmentier N, et al. Evidence for a tumoral immune resistance mechanism based on tryptophan degradation by indoleamine 2,3-dioxygenase. Nat Med (2003) 9:1269–74. 10.1038/nm934 [DOI] [PubMed] [Google Scholar]
- 25.Nguyen DP, Li J, Tewari AK. Inflammation and prostate cancer: the role of interleukin 6 (IL-6). BJU Int (2014) 113:986–92. 10.1111/bju.12452 [DOI] [PubMed] [Google Scholar]
- 26.Russell PJ, Kingsley EA. Prostate Cancer Methods and Protocols. Totowa, NJ: Humana Press Inc. (2003). p. 21–39. [DOI] [PubMed] [Google Scholar]
- 27.Harrison C, Kiladjian JJ, Al-Ali HK, Gisslinger H, Waltzman R, Stalbovskaya V, et al. JAK inhibition with ruxolitinib versus best available therapy for myelofibrosis. N Engl J Med (2012) 366:787–98. 10.1056/NEJMoa1110556 [DOI] [PubMed] [Google Scholar]
- 28.O’Sullivan AW, Wang JH, Redmond HP. The role of P38 MAPK and PKC in BLP induced TNF-alpha release, apoptosis, and NFkappaB activation in THP-1 monocyte cells. J Surg Res (2009) 151:138–44. 10.1016/j.jss.2008.02.031 [DOI] [PubMed] [Google Scholar]
- 29.Mbengue A, Bhattacharjee S, Pandharkar T, Liu H, Estiu G, Stahelin RV, et al. A molecular mechanism of artemisinin resistance in Plasmodium falciparum malaria. Nature (2015) 520:683–7. 10.1038/nature14412 [DOI] [PMC free article] [PubMed] [Google Scholar]
- 30.Yin J, Wu M, Duan J, Liu G, Cui Z, Zheng J, et al. Pyrrolidine dithiocarbamate inhibits NF-KappaB activation and upregulates the expression of Gpx1, Gpx4, occludin, and ZO-1 in DSS-induced colitis. Appl Biochem Biotechnol (2015) 177:1716–28. 10.1007/s12010-015-1848-z [DOI] [PubMed] [Google Scholar]
- 31.Chiarugi A, Rovida E, Dello Sbarba P, Moroni F. Tryptophan availability selectively limits NO-synthase induction in macrophages. J Leukoc Biol (2003) 73:172–7. 10.1189/jlb.0502220 [DOI] [PubMed] [Google Scholar]
- 32.Grell M, Douni E, Wajant H, Lohden M, Clauss M, Maxeiner B, et al. The transmembrane form of tumor necrosis factor is the prime activating ligand of the 80 kDa tumor necrosis factor receptor. Cell (1995) 83:793–802. 10.1016/0092-8674(95)90192-2 [DOI] [PubMed] [Google Scholar]
- 33.Stewart TJ, Abrams SI. How tumours escape mass destruction. Oncogene (2008) 27:5894–903. 10.1038/onc.2008.268 [DOI] [PubMed] [Google Scholar]
- 34.Chughtai B, Lee R, Te A, Kaplan S. Role of inflammation in benign prostatic hyperplasia. Rev Urol (2011) 13:147–50. [PMC free article] [PubMed] [Google Scholar]
- 35.Cancer Genome N. Atlas research, the molecular taxonomy of primary prostate cancer. Cell (2015) 163:1011–25. 10.1016/j.cell.2015.10.025 [DOI] [PMC free article] [PubMed] [Google Scholar]
- 36.Munn DH, Mellor AL. IDO in the tumor microenvironment: inflammation, counter-regulation, and tolerance. Trends Immunol (2016) 37:193–207. 10.1016/j.it.2016.01.002 [DOI] [PMC free article] [PubMed] [Google Scholar]
- 37.Holmgaard RB, Zamarin D, Munn DH, Wolchok JD, Allison JP. Indoleamine 2,3-dioxygenase is a critical resistance mechanism in antitumor T cell immunotherapy targeting CTLA-4. J Exp Med (2013) 210:1389–402. 10.1084/jem.20130066 [DOI] [PMC free article] [PubMed] [Google Scholar]
- 38.Holmgaard RB, Zamarin D, Li Y, Gasmi B, Munn DH, Allison JP, et al. Tumor-expressed IDO recruits and activates MDSCs in a Treg-dependent manner. Cell Rep (2015) 13:412–24. 10.1016/j.celrep.2015.08.077 [DOI] [PMC free article] [PubMed] [Google Scholar]
- 39.Robinson CM, Hale PT, Carlin JM. The role of IFN-gamma and TNF-alpha-responsive regulatory elements in the synergistic induction of indoleamine dioxygenase. J Interferon Cytokine Res (2005) 25:20–30. 10.1089/jir.2005.25.20 [DOI] [PMC free article] [PubMed] [Google Scholar]
- 40.Braun D, Longman RS, Albert ML. A two-step induction of indoleamine 2,3 dioxygenase (IDO) activity during dendritic-cell maturation. Blood (2005) 106:2375–81. 10.1182/blood-2005-03-0979 [DOI] [PMC free article] [PubMed] [Google Scholar]
- 41.Babcock TA, Carlin JM. Transcriptional activation of indoleamine dioxygenase by interleukin 1 and tumor necrosis factor alpha in interferon-treated epithelial cells. Cytokine (2000) 12:588–94. 10.1006/cyto.1999.0661 [DOI] [PubMed] [Google Scholar]
- 42.Robinson CM, Shirey KA, Carlin JM. Synergistic transcriptional activation of indoleamine dioxygenase by IFN-gamma and tumor necrosis factor-alpha. J Interferon Cytokine Res (2003) 23:413–21. 10.1089/107999003322277829 [DOI] [PMC free article] [PubMed] [Google Scholar]
- 43.Wang X, Lee SO, Xia S, Jiang Q, Luo J, Li L, et al. Endothelial cells enhance prostate cancer metastasis via IL-6 – >androgen receptor – >TGF-beta – >MMP-9 signals. Mol Cancer Ther (2013) 12:1026–37. 10.1158/1535-7163.MCT-12-0895 [DOI] [PMC free article] [PubMed] [Google Scholar]
- 44.George DJ, Halabi S, Shepard TF, Sanford B, Vogelzang NJ, Small EJ, et al. The prognostic significance of plasma interleukin-6 levels in patients with metastatic hormone-refractory prostate cancer: results from cancer and leukemia group B 9480. Clin Cancer Res (2005) 11:1815–20. 10.1158/1078-0432.CCR-04-1560 [DOI] [PubMed] [Google Scholar]
- 45.Wu CT, Hsieh CC, Lin CC, Chen WC, Hong JH, Chen MF. Significance of IL-6 in the transition of hormone-resistant prostate cancer and the induction of myeloid-derived suppressor cells. J Mol Med (Berl) (2012) 90:1343–55. 10.1007/s00109-012-0916-x [DOI] [PubMed] [Google Scholar]
- 46.Mahon KL, Lin HM, Castillo L, Lee BY, Lee-Ng M, Chatfield MD, et al. Cytokine profiling of docetaxel-resistant castration-resistant prostate cancer. Br J Cancer (2015) 112:1340–8. 10.1038/bjc.2015.74 [DOI] [PMC free article] [PubMed] [Google Scholar]
- 47.Dorff TB, Goldman B, Pinski JK, Mack PC, Lara PN, Jr, Van Veldhuizen PJ, Jr, et al. Clinical and correlative results of SWOG S0354: a phase II trial of CNTO328 (siltuximab), a monoclonal antibody against interleukin-6, in chemotherapy-pretreated patients with castration-resistant prostate cancer. Clin Cancer Res (2010) 16:3028–34. 10.1158/1078-0432.CCR-09-3122 [DOI] [PMC free article] [PubMed] [Google Scholar]
- 48.Fizazi K, De Bono JS, Flechon A, Heidenreich A, Voog E, Davis NB, et al. Randomised phase II study of siltuximab (CNTO 328), an anti-IL-6 monoclonal antibody, in combination with mitoxantrone/prednisone versus mitoxantrone/prednisone alone in metastatic castration-resistant prostate cancer. Eur J Cancer (2012) 48:85–93. 10.1016/j.ejca.2011.10.014 [DOI] [PubMed] [Google Scholar]
- 49.Alexander RB, Ponniah S, Hasday J, Hebel JR. Elevated levels of proinflammatory cytokines in the semen of patients with chronic prostatitis/chronic pelvic pain syndrome. Urology (1998) 52:744–9. 10.1016/S0090-4295(98)00390-2 [DOI] [PubMed] [Google Scholar]
- 50.Penna G, Mondaini N, Amuchastegui S, Degli Innocenti S, Carini M, Giubilei G, et al. Seminal plasma cytokines and chemokines in prostate inflammation: interleukin 8 as a predictive biomarker in chronic prostatitis/chronic pelvic pain syndrome and benign prostatic hyperplasia. Eur Urol (2007) 51:524–33; discussion 533. 10.1016/j.eururo.2006.07.016 [DOI] [PubMed] [Google Scholar]
- 51.Hu C, Yang H, Zhao Y, Chen X, Dong Y, Li L, et al. The role of inflammatory cytokines and ERK1/2 signaling in chronic prostatitis/chronic pelvic pain syndrome with related mental health disorders. Sci Rep (2016) 6:28608. 10.1038/srep28608 [DOI] [PMC free article] [PubMed] [Google Scholar]
- 52.Turner NA, Mughal RS, Warburton P, O’Regan DJ, Ball SG, Porter KE. Mechanism of TNFalpha-induced IL-1alpha, IL-1beta and IL-6 expression in human cardiac fibroblasts: effects of statins and thiazolidinediones. Cardiovasc Res (2007) 76:81–90. 10.1016/j.cardiores.2007.06.003 [DOI] [PubMed] [Google Scholar]
- 53.Amsen D, de Visser KE, Town T. Approaches to determine expression of inflammatory cytokines. Methods Mol Biol (2009) 511:107–42. 10.1007/978-1-59745-447-6_5 [DOI] [PMC free article] [PubMed] [Google Scholar]
- 54.Peinnequin A, Mouret C, Birot O, Alonso A, Mathieu J, Clarencon D, et al. Rat pro-inflammatory cytokine and cytokine related mRNA quantification by real-time polymerase chain reaction using SYBR green. BMC Immunol (2004) 5:3. 10.1186/1471-2172-5-3 [DOI] [PMC free article] [PubMed] [Google Scholar]
- 55.Theate I, van Baren N, Pilotte L, Moulin P, Larrieu P, Renauld JC, et al. Extensive profiling of the expression of the indoleamine 2,3-dioxygenase 1 protein in normal and tumoral human tissues. Cancer Immunol Res (2015) 3:161–72. 10.1158/2326-6066.CIR-14-0137 [DOI] [PubMed] [Google Scholar]
Associated Data
This section collects any data citations, data availability statements, or supplementary materials included in this article.
Supplementary Materials
Prognostic value of IL-6 gene expression in tumor samples. (A) Receiver operating characteristic (ROC) analysis to calculate the prognostic value of IL-6. The area under the curve (AUC) for recurrence-free survival (RFS) was 0.51 (95% CI, 0.37–0.65%) with no evidence for a prognostic potential. (B) Kaplan–Meier estimates of RFS stratified by an arbitrary cutoff (50th percentile) for IL-6 gene expression in PCa tissue specimens. The survival analysis was based on the time of BR. The estimated rate of 5-year RFS was 53% (95% CI, 48–58%; SE 2.7%) for IL-6high patients and 50% (95% CI, 44–55%; SE 3.03%; p = 0.8, two-sided log rank test) for IL-6low patients. (C) IL-6 gene expression in PCa tissue specimens was not significantly higher in BR-positive than in BR-negative patients (p = ns, Mann–Whitney U test). In addition, no association between IL-6 gene levels and evidence of BR (PSA ≥ 0.1 ng/ml) was documented (Pearson χ2 test).