

Abstract
This paper presents a new approach to the prevention and treatment of early stage diabetic retinopathy before vision is severely impaired. This approach includes two major steps. The first step is to understand the mechanisms of vision impairment and classify diabetic retinopathy on the basis of pathophysiologic adaptations, rather than on the presence of advanced pathologic lesions, as defined by current clinical practice conventions. The second step is to develop patient-specific molecular diagnoses of diabetic retinopathy so that patients can be treated based on their individual characteristics, a process analogous to the individualized diagnosis and treatment of cancer patients. This step is illustrated by proteomic analysis of vitreous fluid that reveals evidence of neuroretinal degeneration and inflammation, as well as vascular proliferation. Together, these steps may lead to improved means to preserve vision in the ever-increasing number of patients with diabetes worldwide.
Keywords: Diabetic retinopathy, vitreous proteomics, neurovascular unit, retinal failure, molecular diagnosis
Clinical Characterization of Diabetic Retinopathy
Introduction
Professor Eva Kohner exemplifies a tradition of doing the right thing for patients with diabetes. She exemplified this approach whether in the context of clinical research trials such as the United Kingdom Prospective Diabetes Study, and in her discussions of individual patients. In addition, Professor Kohner has always supported the development of young investigators, so this lecture is presented jointly by a senior (TWG) and a younger investigator (JMS). Figure 1 shows Professor Kohner surrounded by a large group of male colleagues at the 1968 Airlie House Symposium. The Airlie House Classification of diabetic retinopathy was born at this symposium and became the forerunner of the Early Treatment Diabetic Retinopathy Study classification (1, 2) that has formed the basis for the important diagnostic and therapeutic trials over the last 50 years. While this classification scheme has been extremely helpful, it was designed in an era when the essential questions were about the benefit of pituitary ablation for proliferative diabetic retinopathy, and when the benefits and risks of panretinal laser therapy for proliferative diabetic retinopathy were still debated, a decade before the Diabetic Retinopathy Study results were published. Therefore, the context was the need for a structure by which to address severe blinding retinopathy. The success of that classification now brings us to the 21st century when there is the opportunity and the need for better intervention of early stage disease before patients are at risk for losing vision. The first section of this presentation focuses on the clinical characterization of diabetic retinopathy and the quantification of structural and functional changes in diabetic retinopathy. This work and the associated concepts are the product of many investigators, notably Drs. David Antonetti, Steven Abcouwer, Patrice Fort and Gregory Jackson, who are investigating distinct aspects of the neurovascular unit and its alterations in diabetes.
Figure 1.
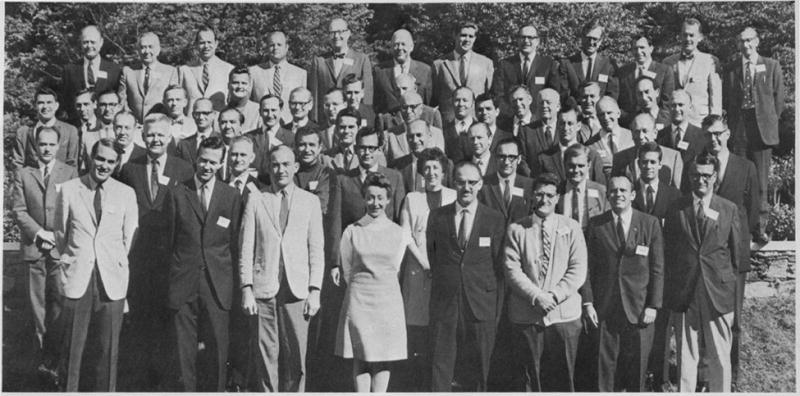
Attendees at the 1968 Airlie House Symposium with Professor Eva Kohner front and center (44).
Classification of diabetic retinopathy—past and future
Current clinical teaching is that diabetes impairs vision because of visible features such as tractional retinal detachment, non-clearing vitreous hemorrhage, neovascular glaucoma, macular ischemia and/or diabetic macular edema. However, as shown in Figure 2, these events do not strictly correlate with the clinical classification of retinopathy as mild, moderate or severe, non-proliferative retinopathy or proliferative retinopathy. People with mild retinopathy and macular edema can have reduced vision and patients with advance proliferative retinopathy can have nearly normal vision, when vision is defined as visual acuity.
Figure 2. Classification of mechanisms of vision loss in diabetic retinopathy.
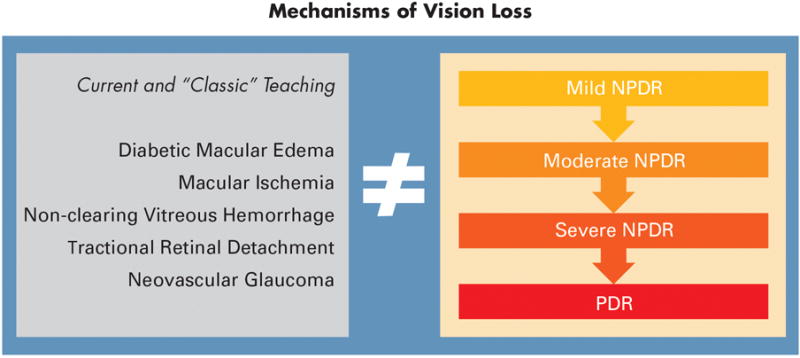
The clinical features of diabetic retinopathy that are associated with vision loss (left) do not coincide directly with the severity scale (right).
An alternative approach to this classification based on pathologic lesions is to consider the evolution of events in a continuum of pathophysiologic events from the onset of diabetes to clinical manifestations (3). Figure 3 illustrates a concept with at least 3 stages. In the first, multiple adaptive responses occur within weeks to months of the onset of diabetes. These responses, as measured primarily in animal models, include reduced electrical activity, reduced biosynthetic activity such as protein and lipid synthesis, autophagy and apoptosis (4–7). Likewise, patients with clinically intact retinas exhibit impaired autoregulation in which there are defective vascular responses to breathing 100% oxygen or to flickering light (8–10). In this first stage vision is intact and we consider that there is no diabetic retinopathy because adaptive responses compensate for the metabolic insults. However, after approximately 5 to 10 years, a second stage can develop in which adaptive changes begin to decompensate and there are early clinical signs such as retinal hemorrhages, microaneurysms, macular edema, vascular non-perfusion and gliosis. At this point, subtle aspects of vision, such as visual field and contrast sensitivity, are impaired and this may be considered an early form of decompensation when non-proliferative retinopathy develops. A third stage occurs after additional time and suboptimal diabetes control, a state of aberrant repair may develop with neovascularization, gliosis, fibrosis, retinal neovascularization and frank loss of vision. This pathophysiologic stage is consistent with proliferative diabetic retinopathy. The current regulatory strategies for treating retinopathy are limited to the stages of adaptive decompensated and aberrant repair and have not yet been developed for patients that have mild retinopathy and good vision. However, a recent workshop sponsored jointly by the National Eye Institute and Food and Drug Administration strongly emphasized the need for the development of functional endpoints to facilitate the treatment of early stage diabetic retinopathy.
Figure 3. A model of adaptive and maladaptive stages of diabetic retinopathy development.
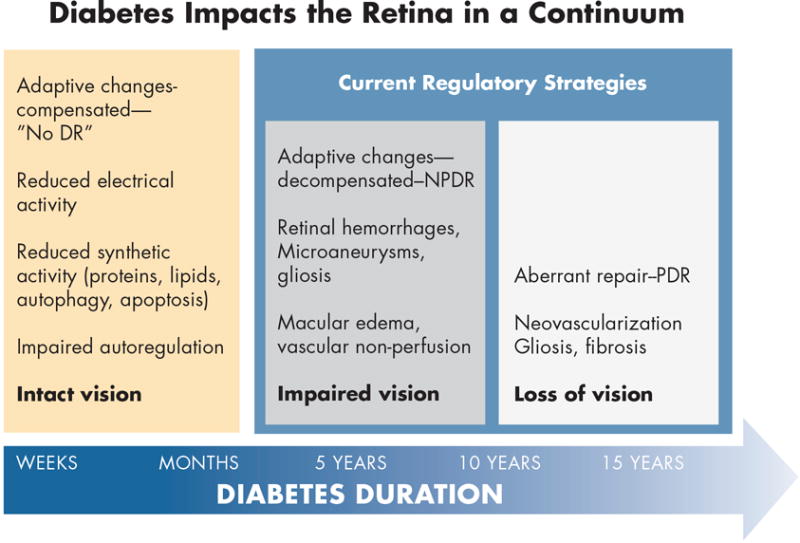
Within the first weeks to months of diabetes, the retina adapts to a lower metabolic steady-state with reduced electrical and biosynthetic activity, adaptive autophagy and apoptosis, and impaired autoregulation. Vision remains intact and there is no clinical evidence of diabetic retinopathy. After 5 - 10 years of diabetes, adaptive mechanisms begin to decompensate with the appearance of mild nonproliferative retinopathy, and early impairment of vision. Aberrant repair can ensue with the onset of proliferative retinopathy and loss of vision. Regulatory strategies are currently limited to the latter two stages (3). Artwork by David Murrel, MFA.
The clinical assessment of non-proliferative retinopathy is based on the Early Treatment Diabetic Retinopathy Study grading which is neither quantitative nor linear and evaluates pathologic features of retinopathy rather than pathophysiologic processes. This construct leads to uniform treatment of patients with diabetic macular edema or proliferative diabetic retinopathy without recognizing or quantifying the differences between patients. The heterogeneity is evident in the varied response of patients with DME to anti-VEGF therapy and the relationship between intraocular VEGF concentration and response to treatment remains unknown as VEGF is not measured prior to injection. As discussed recently by Gray (11), the stages of retinopathy called DME and PDR represent failure of the adaptive mechanisms within the retina and are consistent with a stage of disease that might be called retinal failure, analogous to renal failure in persons with diabetes. A forward-looking approach consistent with the concept of personalized medicine would be to develop quantitative assessment of retinal pathophysiology to enable early and individualized treatments.
Cellular features of diabetic retinopathy
The conventional clinical features of diabetic retinopathy certainly include a microvascular component, but numerous studies have shown that diabetes damages the entire retina involving retinal neurons, glial cells, microglial cells and the pigmented epithelium. More than 30 papers studying human retinal samples have shown that these changes all occur, along with macrophage infiltration and retinal pigment epithelial degeneration, as reviewed by Eisma et al (12).
The neurovascular unit represents the structural and functional integration between neurons, glial cells, microglial and blood vessels such that the metabolic and electrical functions of the retina are highly integrated, as emphasized by Eric Newman (13–15). Diabetes ultimately disrupts the entire neurovascular unit, such that it becomes “dis-integrated”. The insidious, progressive functional disintegration occurs over time and likely accounts for the loss of contrast sensitivity, color perception, electroretinographic responses and impaired autoregulation. At this point, it is not clear whether neuroglial cell dysfunction leads to vascular alterations or vice versa, or whether there is a synchronized loss of cellular integrity because of interdependence of blood vessels, neurons and glia in a given area of retina.
The interrelationship between blood vessels and retinal elements was first discussed by Bek (16), who examined dye cast perfusion preparations of post-mortem human eyes. All regions of non-perfusion exhibited extensive disorganization and loss of the retinal ganglion cells and the inner nuclear layer. More recently, Dodo and colleagues (17) showed thinning of the inner retina in regions of OCT sections in the areas of non-perfusion on fluorescein angiograms. This feature may represent a severe form of the disorganization and retinal inner layers (“DRIL”) noted by Sun and colleagues (18, 19). The cellular basis for this OCT-based disorganization is not yet understood.
Clinical features of neurovascular disruption
The ultimate question relates to the visual consequences of retinal dysfunction in diabetes. Vision impairment in early diabetes has been noted for several decades, with defects in color vision contrast sensitivity, dark adaptation and electrophysiology responses. Yet, despite over 70 publications in this area, there have made little impact on clinical practice, and few studies have compared multiple aspects of visual function in the same subjects. However, Jackson et al (20) reported in a cohort patients with mild non-proliferative retinopathy and 20/30 acuity or better, about one-quarter had reduced dark adaptation responses as tested with the AdaptDx (MacuLogix, Hummelstown, PA) and contrast sensitivity by the Pelli-Robson method; one-third of patients had reduced photopic visual fields and 47% had reduced scotopic visual field sensitivity. However, 83% of patients had reduced visual field sensitivity as recorded by reduced sensitivity in the fovea using the 24-2 program of the Matrix frequency doubling perimeter (Zeiss-Meditech; Dublin, CA). Together, these data reveal defects in multiple layers of the retina from the inner retina (frequency doubling perimetry and contrast sensitivity) to the photoreceptor-RPE complex (dark adaptation and scotopic and photopic visual fields) and reveal some of the heterogeneity of cellular defects in diabetic retinopathy. Of note, these findings are not reflected by standard clinical examination or by photographic grading.
Figure 4 compares retinal photographs, OCT thickness maps and corresponding frequency doubling perimetry fields in illustrative examples (3). The patient in the left column is a healthy normal person with 20/15 acuity at age 23; the thickness map shows a foveal thickness of approximately 300 microns and parafoveal thickness of approximately 375 microns and normal visual field sensitivity. By contrast, the 32-year-old patient in the middle column with 10 years of type 1 diabetes has 20/20 acuity and mild NPDR with only a few microaneurysms. This person’s foveal thickness is reduced to less than approximately 250 microns and the parafoveal thickness is reduced to approximately 300 microns with 9 decibels of foveal sensitivity loss. The 19-year-old female in the right column has had type 1 diabetes since age three and has some neovascularization along the superotemporal arcade but 20/20 acuity and no subjective visual impairment. However, she exhibits diffuse thinning of her entire macula (250 microns) and has 15 decibels of foveal sensitivity loss. Figure 5 illustrates a 54-year-old male with 20/25 visual acuity who exhibits moderate capillary non-perfusion in the midperipheral retina but slightly more in the inferior half of his eye. His Humphrey 60-4 field shows marked visual sensitivity loss of 17 to 18 decibels in the superior field and approximately 5 decibel sensitivity loss inferiorly. This case exemplifies close correspondence between retinal neurovascular damage and visual field sensitivity loss. These three cases show that standard clinical tools can reveal profound changes in retinal structure and function even in asymptomatic individuals. A further question is whether or not visual field alterations beyond visual acuity have any impact on patient’s day to day living. Mazhar et al (21) reported that NEI-VFQ-25 scores for driving difficulty and the composite score fall dramatically beyond level 43 retinopathy. This finding suggests that diabetes and mild diabetic retinopathy impair multiple aspects of visual function beyond acuity.
Figure 4.
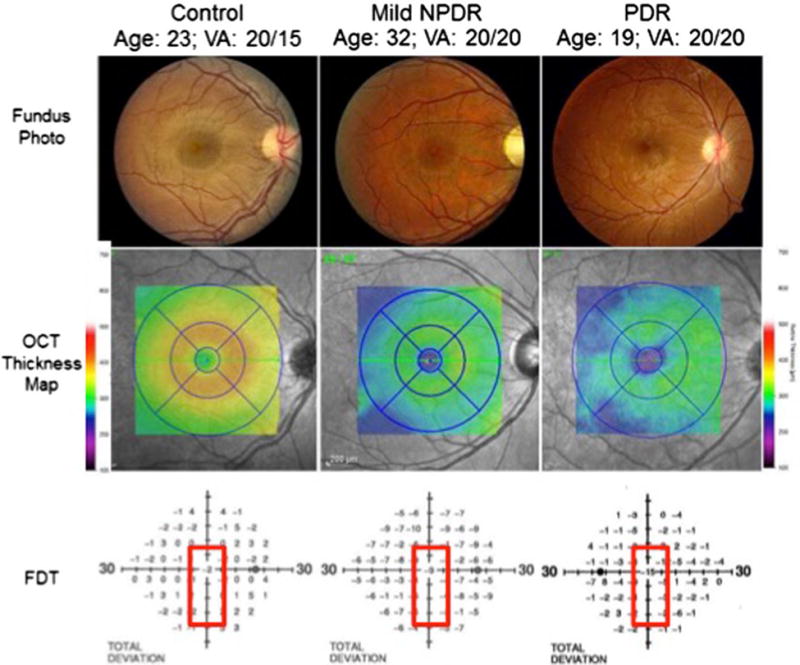
Color fundus photographs (top panel) of a healthy person (left), a person with mild nonproliferative diabetic retinopathy (NPDR; middle), and a person with proliferative diabetic retinopathy (PDR; right) demonstrate preserved macular anatomy without obvious vascular compromise and visual acuities 20/20 or better. Spectral-domain optical coherence tomography (SD-OCT) macular thickness mapping (central panel) demonstrates foveal and parafoveal thicknesses reduced by between 50 and 75 μm comparing healthy eyes to those with mild NPDR or PDR. The lower panel demonstrates a concomitant decline in foveal sensitivities in the diabetic patients as measured by frequency-doubling perimetry, with a 9 decibel (dB) visual field sensitivity loss in the patient with mild NPDR and a 15 dB sensitivity loss in the patient with PDR.
Figure 5. Peripheral visual field sensitivity loss in a patient with moderate NPDR.
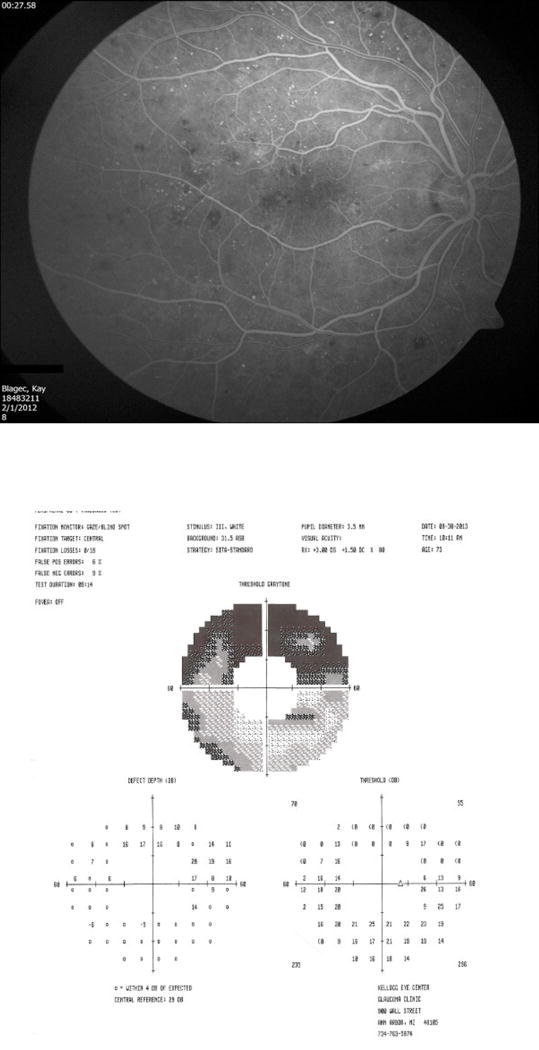
This 76 year old female had 20/25 visual acuity and moderate reduction of capillary perfusion, especially in the inferior retina. Her 60-4 Humphrey visual field showed marked (17 - 18 dB) sensitivity loss in the superior hemifield, corresponding to the inferior vascular nonperfusion.
In summary, the entire neurovascular unit with vascular damage, neuronal degeneration, glial cell and microglial cell dysfunction probably all contribute to impaired vision of persons with diabetes. Strategies to stabilize the neurovascular unit before loss of vision will be essential to enable early identification of patients at risk and treatment to maintain good vision. Clinical assessment and molecular assessment must be combined to provide more precise patient-specific therapy in the future.
Molecular Characterization of Diabetic Retinopathy
Introduction
A personalized approach to the treatment of diabetic retinopathy will require a molecular diagnosis to be paired with clinical findings so that optimal treatment can be provided for an individual patient. This approach has been successful in several areas of medicine. For example, prior to treatment, breast cancer tumors are stratified by tumor histology as well as at the molecular level. Tumors that express estrogen/progesterone receptors are treated with tamoxifen; similarly, tumors that express HER-2 are treated specifically with trastuzamab. If neither is present, then traditional non-specific chemotherapy is employed. This approach has had the benefited patients greatly by providing more specific treatments when possible with less side effects and better treatment outcomes (22–24). This concept continues to evolve with the development of prognostic multigene assays used to ‘classify’ breast cancer as the molecular level in order to predict progress and guide intervention (25). This approach has been successfully used in the eye for the prognosis and treatment of uveal melanoma (26).
At the present time, the treatment of diabetic retinopathy is primarily geared toward the treatment of DME and the treatment options are restricted to intravitreal anti-VEGF injections (28, 31) and intravitreal steroids (29, 30). In the coming years, it is clear that additional specific therapeutic agents will become available and these additional options will require the treating clinician to determine what specific therapeutic agent is going to be most beneficial to the current patient. In order to decide what specific therapeutic agent will work best, it is rational to conclude that the treating physician will need to classify diabetic retinopathy at the molecular level. In this regard, patients with elevated VEGF levels would be treated specifically with anti-VEGF agents. However, if testing revealed normal VEGF levels but elevated Factor X or Pathway X, then the patient could be treated with anti-Factor X agents or Pathway X agents. While we recognize this approach will require new treatment options that are not currently available; the development of new therapies depends on new mechanistic and diagnostic insights.
In order to treat patients based in this manner, the initial step to determine treatment will be to obtain intraocular fluids and measure the various targets of the specific treatments available. Therefore, we have started to define diabetic retinopathy at the molecular level in individual patients we have developed multiple methods to analyze the molecular components of vitreous. We have recently shown that office-based vitreous aspiration is safe and allow the treating physician to measure at least 42 different cytokines and growth factors from 75 μL of vitreous fluid (32). While aqueous fluid analysis would be technically easier, the data would be misleading as aqueous cytokine and growth factor levels do not reliably correlate with vitreous levels (33). We have also shown that office-based vitreous aspirates contain sufficient volume to be used to quantify 42 cytokines and growth factors in a multiplexed assay using a total 75 μL of fluid. While this approach works well if the specific target is detectable using ELISA, it is also possible that agents may be targeted to specific molecular pathways. To this end, we have developed an unbiased proteomics assay capable of detecting over 1000 proteins from 250 μL of vitreous fluid, the volume we are routinely able to obtain in clinical vitreous aspirates. Application of this method to larger cohorts of patients will ultimately lead to the identification biomarkers and novel treatment targets for diabetic retinopathy.
Methods
This study was approved by the University of Michigan Institutional Review Board and adhered to the tenets of the Declaration of Helsinki. Vitreous was obtained from patients undergoing vitrectomy for macular hole and/or epiretinal membrane repair (Control; n=5; pooled; 50 μL each) or for removal of non-clearing vitreous hemorrhage (PDR; n=5; pooled; 50 μL each). The average age for Control group was 66.6 while the average age of the PDR group was 62.4. Two of the five patients in each group were males. Detailed demographics of the patients are shown in SD1. The vitreous samples were collected in the operating room before clinically indicated vitrectomy. Briefly, 250 μL of each pooled sample were depleted of abundant plasma proteins using the Multiple Affinity Removal System (MARS specific for the 14 most abundant human plasma proteins (Agilent (P/N5188-6560)) according to the manufacturers protocol. Following depletion, each sample was processed using SDS-PAGE with a 4-12% Bis-Tris homogenous gel (Invitrogen) using the MOPS buffer system. Each gel lane was excised into 40 equal sized segments and digested in-gel with trypsin. Trypsin digestion was performed using a ProGest robot (DigiLab). Fragments were washed with 25mM ammonium bicarbonate followed by acetonitrile, reduced with 10mM dithiothreitol at 60°C followed by alkylation with 50mM iodoacetamide at RT, and digested with sequencing grade trypsin (Promega) at 37°C for 4h and then quenched with formic acid. The supernatant of each gel digest was analyzed by nano LC/MS/MS with a Waters NanoAcquity HPLC system interfaced to a ThermoFisher Q Exactive.
Data Analysis
Data were searched using the Mascot search engine with the SwissProt Human (forward and reverse appended with common contaminant proteins) database, carbamidomethyl (C) fixed modification. Variable modification parameters were set to oxidation (M, Acetyl (N-term), Pyro-Glu (N-term Q), and deamidation (N,Q). The peptide mass tolerance was set to 10ppm and the fragment mass tolerance was set to 0.02 Da. A maximum of 2 missed cleavages at least two unique peptides per protein. The resulting mass spectra were searched against the SwissProt database using Mascot (SwissProt_Human; forward and reverse) and the resultant Mascot DAT files were parsed into Scaffold (Proteome Software; Portland OR) for validation, filtering and generation of non-redundant identifications. Pathway enrichment analysis was conducted using Ingenuity Pathway Analysis (Qiagen). Spectral counts were increased by one for all proteins to include proteins observed in only one condition. Proteins of low abundance were removed (sum of the spectral counts <10). The ration of PDR to Control was then calculated and loaded into IPA. The complete list of all proteins is available in Supplemental Document 1 (SD1).
Results
Vitreous was digested and subjected to ESI-MS/MS as described above. A total of 12,515 peptides and 929 proteins were identified in MH/ERM vitreous while 15,279 peptides and 1,213 proteins were identified in PDR vitreous. The overall FDR was 0.9% at the peptide level and 0.22% at the protein level. A complete list of the identified proteins is available for download (SD1). Pathway enrichment analysis was conducted using a right tailed Fisher’s exact test. The top 50 signaling pathways present in vitreous fluid are shown in Table 1 and a complete listing is available in SD1. The operational definition of each pathway is provided by IPA and is available online. The activation state of each pathway is predicted by IPA and presented as the z-score where positive z-scores suggest pathway activation and negative z-scores represent pathway inhibition. The number of upregulated, downregulated and unchanged proteins in each pathway is also shown. The list of each protein identified within each pathway is available in SD1. The results of this analysis must be interpreted conservatively and with caution given the small sample size.
Table 1.
| Ingenuity Canonical Pathways | −log(p-value) | Ratio | z-score |
|---|---|---|---|
| Acute Phase Response Signaling | 2.85E+01 | 3.00E-01 | 1.177 |
| LXR/RXR Activation | 2.42E+01 | 3.20E-01 | −1.718 |
| Coagulation System | 2.28E+01 | 6.57E-01 | −0.209 |
| Intrinsic Prothrombin Activation Pathway | 2.23E+01 | 7.24E-01 | 0.229 |
| Complement System | 2.20E+01 | 6.22E-01 | −0.5 |
| FXR/RXR Activation | 1.92E+01 | 2.72E-01 | NaN |
| Protein Ubiquitination Pathway | 1.31E+01 | 1.63E-01 | NaN |
| Extrinsic Prothrombin Activation Pathway | 1.23E+01 | 6.67E-01 | NaN |
| Autophagy | 6.27E+00 | 2.32E-01 | NaN |
| NRF2-mediated Oxidative Stress Response | 5.64E+00 | 1.26E-01 | 3.742 |
| Phagosome maturation | 5.58E+00 | 1.42E-01 | NaN |
| Clathrin-mediated Endocytosis Signaling | 5.29E+00 | 1.21E-01 | NaN |
| IL-12 Signaling and Production in Macrophages | 5.25E+00 | 1.35E-01 | NaN |
| IGF-1 Signaling | 4.83E+00 | 1.48E-01 | NaN |
| Inhibition of Matrix Metalloproteases | 4.50E+00 | 2.31E-01 | NaN |
| Production of Nitric Oxide and ROS in Macrophages | 4.34E+00 | 1.11E-01 | −1.279 |
| HIPPO signaling | 4.13E+00 | 1.51E-01 | −3.464 |
| Agranulocyte Adhesion and Diapedesis | 3.67E+00 | 1.08E-01 | NaN |
| RhoGDI Signaling | 3.61E+00 | 1.07E-01 | 0.943 |
| Hypoxia Signaling in the Cardiovascular System | 3.48E+00 | 1.59E-01 | NaN |
| Unfolded protein response | 3.41E+00 | 1.70E-01 | NaN |
| Myc Mediated Apoptosis Signaling | 3.11E+00 | 1.43E-01 | NaN |
| Antigen Presentation Pathway | 3.06E+00 | 1.89E-01 | NaN |
| Granulocyte Adhesion and Diapedesis | 3.05E+00 | 1.02E-01 | NaN |
| Cell Cycle: G2/M DNA Damage Checkpoint Regulation | 2.97E+00 | 1.63E-01 | 1.342 |
| PI3K/AKT Signaling | 2.95E+00 | 1.10E-01 | 1.604 |
| Actin Cytoskeleton Signaling | 2.73E+00 | 8.85E-02 | 0.728 |
| Remodeling of Epithelial Adherens Junctions | 2.70E+00 | 1.36E-01 | 2 |
| p70S6K Signaling | 2.66E+00 | 1.03E-01 | −1.89 |
| Regulation of Cellular Mechanics by Calpain Protease | 2.59E+00 | 1.43E-01 | 1 |
| Axonal Guidance Signaling | 2.46E+00 | 7.16E-02 | NaN |
| ILK Signaling | 2.36E+00 | 8.76E-02 | 0 |
| Leukocyte Extravasation Signaling | 2.35E+00 | 8.53E-02 | 0.258 |
| ERK5 Signaling | 2.23E+00 | 1.25E-01 | NaN |
| VDR/RXR Activation | 2.21E+00 | 1.15E-01 | NaN |
| 14-3-3-mediated Signaling | 1.96E+00 | 9.16E-02 | 2.646 |
| Endoplasmic Reticulum Stress Pathway | 1.95E+00 | 1.90E-01 | NaN |
| Wnt/Beta-catenin Signaling | 1.88E+00 | 8.38E-02 | −0.707 |
| Antioxidant Action of Vitamin C | 1.83E+00 | 9.52E-02 | 0.378 |
| Role of Tissue Factor in Cancer | 1.82E+00 | 9.09E-02 | NaN |
| RhoA Signaling | 1.79E+00 | 9.02E-02 | 1 |
| Mitotic Roles of Polo-Like Kinase | 1.74E+00 | 1.11E-01 | NaN |
| Lipid Antigen Presentation by CD1 | 1.74E+00 | 1.67E-01 | NaN |
| Tumoricidal Function of Hepatic Natural Killer Cells | 1.74E+00 | 1.67E-01 | NaN |
| Aldosterone Signaling in Epithelial Cells | 1.72E+00 | 8.00E-02 | NaN |
| LPS/IL-1 Mediated Inhibition of RXR Function | 1.66E+00 | 7.51E-02 | −0.816 |
| Epithelial Adherens Junction Signaling | 1.64E+00 | 8.28E-02 | NaN |
| Semaphorin Signaling in Neurons | 1.63E+00 | 1.15E-01 | NaN |
| Dendritic Cell Maturation | 1.57E+00 | 7.65E-02 | 1.069 |
As expected, extracellular signaling pathways present in blood, such as acute phase response signaling, coagulation system and complement system, were present in vitreous obtained from in patients with non-clearing vitreous hemorrhage, though only the acute phase response was significantly activated (z-score = 1.77). The neuroprotective HIPPO signaling pathway was inhibited in PDR vitreous (z-score = −1.77) and THOP1, a neuroprotective peptidase that is upregulated in response to Aβ peptides in Alzheimer’s disease, was found to be increased PDR vitreous compared to controls. These data are consistent with prior studies suggesting a neurodegenerative state is present in pre-clinical models of diabetic retinopathy as well as recent studies revealing early thinning of the retina in patients with diabetes. Also consistent with preclinical studies (41, 42), the NRF2-mediated oxidative stress response was activated in PDR vitreous (z-score = 3.74). It is interesting that pathways known to be associated with angiogenesis, including the Wnt/Beta-catenin and VEGF pathways were present, though insufficient information was present to determine activation pathway status. As shown in Table 2, further analysis of the data using the ontology and function algorithm in IPA (Disease and Function) did reveal significant activation in proteins involved in the Proliferation of Cells (z-score = 0.764) and Cell Proliferation of Vascular Endothelial Cells (z-score = 1.23). This ontology analysis also confirmed the pathway results above and revealed the IPA curated functions Growth of Neurites (z-score = −1.61), Developmental of Neurons (z-score = −1.85), Developmental Process of Synapse (z-score = −2.31) and Neuritogenesis (z-score = −1.40) are inhibited in PDR vitreous.
Table 2.
| Functional Ontology | p-Value | Activation z-score |
|---|---|---|
| Proliferation of cells | 7.79E-40 | 7.64E-01 |
| Cell proliferation of vascular endothelial cells | 2.56E-13 | 1.23E+00 |
| Growth of neurites | 1.99E-15 | −1.61E+00 |
| Development of neurons | 3.39E-13 | −1.85E+00 |
| Developmental process of synapse | 3.87E-11 | −2.31E+00 |
| Neuritogenesis | 8.58E-11 | −1.40E+00 |
Conclusions
Analysis of 250 μL of vitreous fluid is sufficient for MS-based proteomics to pathways involved in the pathophysiology of PDR. This amount of fluid is obtainable from patients in the clinical setting and suggests that it is feasible to characterize patients at the molecular level using unbiased proteomics approaches and/or ELISA-based methods. Future work analyzing individual samples in large cohorts will be required to better define the variation in molecular phenotypes among patients with diabetic retinopathy. Ultimately, a personalized approach to the treatment of diabetic retinopathy will emerge when clinical and molecular phenotypes are interpreted together in order to determine the optimal treatment for individual patients.
Summary
Thanks to the efforts of pioneers such as Professor Eva Kohner, diabetic retinopathy is no longer treated by pituitary ablation and many people with diabetes can retain good vision lifelong. The work of our predecessors now enables the opportunity to prevent late stage diabetic retinopathy with new clinical and molecular diagnostic tools that will lead to patient-specific treatments.
Supplementary Material
Acknowledgments
We appreciate the contributions of our colleagues, Drs. Steven Abcouwer, David Antonetti, Patrice Fort and Gregory Jackson.
Funding: JDRF, ADA, R01EY20582, R24 DK082841, Research to Prevent Blindness, the Retina Research Foundation, the A. Alfred Taubman Medical Research Foundation and Midwest Eye Bank (TWG) and the Bennet and Inez Chotiner Early Career Assistant Professorship (JMS)
Footnotes
Publisher's Disclaimer: This is a PDF file of an unedited manuscript that has been accepted for publication. As a service to our customers we are providing this early version of the manuscript. The manuscript will undergo copyediting, typesetting, and review of the resulting proof before it is published in its final citable form. Please note that during the production process errors may be discovered which could affect the content, and all legal disclaimers that apply to the journal pertain.
Presented as the Eva Kohner Lecture to the European Association for the Study of Diabetes Eye Complications Group, Manchester, England June 24, 2016
Contributor Information
Thomas W Gardner, Kellogg Eye Center, University of Michigan Medical School, 1000 Wall Street, Ann Arbor, MI 48105.
Jeffrey M. Sundstrom, Penn State Hershey Eye Center, Penn State College of Medicine, 500 University Drive, HU19, Hershey, PA 17033.
References
- 1.Goldberg MF, Fine SL. Symposium on the treatment of diabetic retinopathy. Washington, DC: US Govt Printing Office; 1969. [Google Scholar]
- 2.Diabetic retinopathy study. Report Number 6. Design, methods, and baseline results. Report Number 7. A modification of the Airlie House classification of diabetic retinopathy. Prepared by the Diabetic Retinopathy. Investigative ophthalmology & visual science. 1981;21(1 Pt 2):1–226. [PubMed] [Google Scholar]
- 3.Anonymous. Grading diabetic retinopathy from stereoscopic color fundus photographs–an extension of the modified Airlie House classification. ETDRS report number 10. Early Treatment Diabetic Retinopathy Study Research Group. Ophthalmology. 1991;98(5 Suppl):786–806. [PubMed] [Google Scholar]
- 4.Gardner TW, Davila JR. The neurovascular unit and the pathophysiologic basis of diabetic retinopathy. Graefes Arch Clin Exp Ophthalmol. 2017;255(1):1–6. doi: 10.1007/s00417-016-3548-y. [DOI] [PMC free article] [PubMed] [Google Scholar]
- 5.Fort PE, Losiewicz MK, Pennathur S, Jefferson LS, Kimball SR, Abcouwer SF, Gardner TW. mTORC1-independent reduction of retinal protein synthesis in type 1 diabetes. Diabetes. 2014;63(9):3077–90. doi: 10.2337/db14-0235. [DOI] [PMC free article] [PubMed] [Google Scholar]
- 6.Barber AJ, Lieth E, Khin SA, Antonetti DA, Buchanan AG, Gardner TW. Neural apoptosis in the retina during experimental and human diabetes. Early onset and effect of insulin. Journal of Clinical Investigation. 1998;102(4):783–91. doi: 10.1172/JCI2425. [DOI] [PMC free article] [PubMed] [Google Scholar]
- 7.Fox TE, Han X, Kelly S, Merrill AH, Jr, Martin RE, Anderson RE, Gardner TW, Kester M. Diabetes alters sphingolipid metabolism in the retina: a potential mechanism of cell death in diabetic retinopathy. Diabetes. 2006;55(12):3573–80. doi: 10.2337/db06-0539. [DOI] [PMC free article] [PubMed] [Google Scholar]
- 8.Tikhonenko M, Lydic TA, Wang Y, Chen W, Opreanu M, Sochacki A, McSorley KM, Renis RL, Kern T, Jump DB, et al. Remodeling of retinal Fatty acids in an animal model of diabetes: a decrease in long-chain polyunsaturated fatty acids is associated with a decrease in fatty acid elongases Elovl2 and Elovl4. Diabetes. 2010;59(1):219–27. doi: 10.2337/db09-0728. [DOI] [PMC free article] [PubMed] [Google Scholar]
- 9.Pemp B, Garhofer G, Weigert G, Karl K, Resch H, Wolzt M, Schmetterer L. Reduced retinal vessel response to flicker stimulation but not to exogenous nitric oxide in type 1 diabetes. Investigative ophthalmology & visual science. 2009;50(9):4029–32. doi: 10.1167/iovs.08-3260. [DOI] [PubMed] [Google Scholar]
- 10.Lott ME, Slocomb JE, Shivkumar V, Smith B, Gabbay RA, Quillen D, Gardner TW, Bettermann K. Comparison of retinal vasodilator and constrictor responses in type 2 diabetes. Acta Ophthalmol (Copenh) 2012;90(6):e434–41. doi: 10.1111/j.1755-3768.2012.02445.x. [DOI] [PubMed] [Google Scholar]
- 11.Lott ME, Slocomb JE, Gao Z, Gabbay RA, Quillen D, Gardner TW, Bettermann K. Impaired coronary and retinal vasomotor function to hyperoxia in Individuals with Type 2 diabetes. Microvasc Res. 2015;101:1–7. doi: 10.1016/j.mvr.2015.05.002. [DOI] [PMC free article] [PubMed] [Google Scholar]
- 12.Nair P, Aiello LP, Gardner TW, Jampol LM, Iii FL. Report From the NEI/FDA Diabetic Retinopathy Clinical Trial Design and Endpoints Workshop. Invest Ophthalmol Vis Sci. 2016;57(13):5127–42. doi: 10.1167/iovs.16-20356. [DOI] [PMC free article] [PubMed] [Google Scholar]
- 13.Gray EJ, Gardner TW. Retinal Failure in Diabetes: a Feature of Retinal Sensory Neuropathy. Curr Diab Rep. 2015;15(12):107. doi: 10.1007/s11892-015-0683-5. [DOI] [PubMed] [Google Scholar]
- 14.Eisma JH, Dulle JE, Fort PE. Current knowledge on diabetic retinopathy from human donor tissues. World journal of diabetes. 2015;6(2):312–20. doi: 10.4239/wjd.v6.i2.312. [DOI] [PMC free article] [PubMed] [Google Scholar]
- 15.Metea MR, Kofuji P, Newman EA. Neurovascular coupling is not mediated by potassium siphoning from glial cells. The Journal of neuroscience: the official journal of the Society for Neuroscience. 2007;27(10):2468–71. doi: 10.1523/JNEUROSCI.3204-06.2007. [DOI] [PMC free article] [PubMed] [Google Scholar]
- 16.Newman EA. Functional hyperemia and mechanisms of neurovascular coupling in the retinal vasculature. J Cereb Blood Flow Metab. 2013;33(11):1685–95. doi: 10.1038/jcbfm.2013.145. [DOI] [PMC free article] [PubMed] [Google Scholar]
- 17.Pournaras CJ, Rungger-Brandle E, Riva CE, Hardarson SH, Stefansson E. Regulation of retinal blood flow in health and disease. Progress in retinal and eye research. 2008;27(3):284–330. doi: 10.1016/j.preteyeres.2008.02.002. [DOI] [PubMed] [Google Scholar]
- 18.Pournaras CJ, Rungger-Brandle E, Riva CE, Hardarson SH, Stefansson E. Regulation of retinal blood flow in health and disease. Progress in retinal and eye research. 2008;27(3):284–330. doi: 10.1016/j.preteyeres.2008.02.002. [DOI] [PubMed] [Google Scholar]
- 19.Bek T. Transretinal histopathological changes in capillary-free areas of diabetic retinopathy. Acta Ophthalmol (Copenh) 1994;72(4):409–15. doi: 10.1111/j.1755-3768.1994.tb02787.x. [DOI] [PubMed] [Google Scholar]
- 20.Dodo Y, Murakami T, Uji A, Yoshitake S, Yoshimura N. Disorganized retinal lamellar structures in nonperfused areas of diabetic retinopathy. Invest Ophthalmol Vis Sci. 2015;56(3):2012–20. doi: 10.1167/iovs.14-15924. [DOI] [PubMed] [Google Scholar]
- 21.Sun JK, Lin MM, Lammer J, Prager S, Sarangi R, Silva PS, Aiello LP. Disorganization of the retinal inner layers as a predictor of visual acuity in eyes with center-involved diabetic macular edema. JAMA Ophthalmol. 2014;132(11):1309–16. doi: 10.1001/jamaophthalmol.2014.2350. [DOI] [PubMed] [Google Scholar]
- 22.Sun JK, Radwan SH, Soliman AZ, Lammer J, Lin MM, Prager SG, Silva PS, Aiello LB, Aiello LP. Neural Retinal Disorganization as a Robust Marker of Visual Acuity in Current and Resolved Diabetic Macular Edema. Diabetes. 2015;64(7):2560–70. doi: 10.2337/db14-0782. [DOI] [PMC free article] [PubMed] [Google Scholar]
- 23.Jackson GR, Scott IU, Quillen DA, Walter LE, Gardner TW. Inner retinal visual dysfunction is a sensitive marker of non-proliferative diabetic retinopathy. The British journal of ophthalmology. 2012;96(5):699–703. doi: 10.1136/bjophthalmol-2011-300467. [DOI] [PubMed] [Google Scholar]
- 24.Mazhar K, Varma R, Choudhury F, McKean-Cowdin R, Shtir CJ, Azen SP, Los Angeles Latino Eye Study G Severity of diabetic retinopathy and health-related quality of life: the Los Angeles Latino Eye Study. Ophthalmology. 2011;118(4):649–55. doi: 10.1016/j.ophtha.2010.08.003. [DOI] [PMC free article] [PubMed] [Google Scholar]
- 25.Nitta H. Automated HER2 testing: personalized healthcare for breast cancer patients enabled by novel molecular morphology methods. MLO Med Lab Obs. 2013;45(6):18–20. [PubMed] [Google Scholar]
- 26.Roukos DH. Beyond HER2 and trastuzumab: heterogeneity, systems biology, and cancer origin research may guide the future for personalized treatment of very early but aggressive breast cancer. J Clin Oncol. 2010;28(17):e279–80. doi: 10.1200/JCO.2009.27.7061. author reply e82-3. [DOI] [PubMed] [Google Scholar]
- 27.Schramm A, De Gregorio N, Widschwendter P, Fink V, Huober J. Targeted Therapies in HER2-Positive Breast Cancer - a Systematic Review. Breast care (Basel, Switzerland) 2015;10(3):173–8. doi: 10.1159/000431029. [DOI] [PMC free article] [PubMed] [Google Scholar]
- 28.Rakha EA, Green AR. Molecular classification of breast cancer: what the pathologist needs to know. Pathology. 2017;49(2):111–9. doi: 10.1016/j.pathol.2016.10.012. [DOI] [PubMed] [Google Scholar]
- 29.Onken MD, Worley LA, Char DH, Augsburger JJ, Correa ZM, Nudleman E, Aaberg TM, Jr, Altaweel MM, Bardenstein DS, Finger PT, et al. Collaborative Ocular Oncology Group report number 1: prospective validation of a multi-gene prognostic assay in uveal melanoma. Ophthalmology. 2012;119(8):1596–603. doi: 10.1016/j.ophtha.2012.02.017. [DOI] [PMC free article] [PubMed] [Google Scholar]
- 30.Diabetic Retinopathy Clinical Research N. Wells JA, Glassman AR, Ayala AR, Jampol LM, Aiello LP, Antoszyk AN, Arnold-Bush B, Baker CW, Bressler NM, et al. Aflibercept, bevacizumab, or ranibizumab for diabetic macular edema. The New England journal of medicine. 2015;372(13):1193–203. doi: 10.1056/NEJMoa1414264. [DOI] [PMC free article] [PubMed] [Google Scholar]
- 31.Virgili G, Parravano M, Menchini F, Brunetti M. Antiangiogenic therapy with anti-vascular endothelial growth factor modalities for diabetic macular oedema. The Cochrane database of systematic reviews. 2012;12:CD007419. doi: 10.1002/14651858.CD007419.pub3. [DOI] [PubMed] [Google Scholar]
- 32.Boyer DS, Yoon YH, Belfort R, Jr, Bandello F, Maturi RK, Augustin AJ, Li XY, Cui H, Hashad Y, Whitcup SM, et al. Three-year, randomized, sham-controlled trial of dexamethasone intravitreal implant in patients with diabetic macular edema. Ophthalmology. 2014;121(10):1904–14. doi: 10.1016/j.ophtha.2014.04.024. [DOI] [PubMed] [Google Scholar]
- 33.Campochiaro PA, Brown DM, Pearson A, Chen S, Boyer D, Ruiz-Moreno J, Garretson B, Gupta A, Hariprasad SM, Bailey C, et al. Sustained delivery fluocinolone acetonide vitreous inserts provide benefit for at least 3 years in patients with diabetic macular edema. Ophthalmology. 2012;119(10):2125–32. doi: 10.1016/j.ophtha.2012.04.030. [DOI] [PubMed] [Google Scholar]
- 34.Agemy SA, Scripsema NK, Shah CM, Chui T, Garcia PM, Lee JG, Gentile RC, Hsiao YS, Zhou Q, Ko T, et al. Retinal Vascular Perfusion Density Mapping Using Optical Coherence Tomography Angiography in Normals and Diabetic Retinopathy Patients. Retina. 2015;35(11):2353–63. doi: 10.1097/IAE.0000000000000862. [DOI] [PubMed] [Google Scholar]
- 35.Ghodasra DH, Fante R, Gardner TW, Langue M, Niziol LM, Besirli C, Cohen SR, Dedania VS, Demirci H, Jain N, et al. Safety and Feasibility of Quantitative Multiplexed Cytokine Analysis From Office-Based Vitreous Aspiration. Invest Ophthalmol Vis Sci. 2016;57(7):3017–23. doi: 10.1167/iovs.15-18721. [DOI] [PMC free article] [PubMed] [Google Scholar]
- 36.Ecker SMHJCPSMGBM. Aqueous cytokine and growth factor levels do not reliably reflect those levels found in the vitreous. Molecular Vision. 2011;17:2856–63. [PMC free article] [PubMed] [Google Scholar]
- 37.Ecker SM, Hines JC, Pfahler SM, Glaser BM. Aqueous cytokine and growth factor levels do not reliably reflect those levels found in the vitreous. Mol Vis. 2011;17:2856–63. [PMC free article] [PubMed] [Google Scholar]
- 38.Lee JK, Shin JH, Hwang SG, Gwag BJ, McKee AC, Lee J, Kowall NW, Ryu H, Lim DS, Choi EJ. MST1 functions as a key modulator of neurodegeneration in a mouse model of ALS. Proceedings of the National Academy of Sciences of the United States of America. 2013;110(29):12066–71. doi: 10.1073/pnas.1300894110. [DOI] [PMC free article] [PubMed] [Google Scholar]
- 39.Orcholski ME, Zhang Q, Bredesen DE. Signaling via amyloid precursor-like proteins APLP1 and APLP2. Journal of Alzheimer’s disease: JAD. 2011;23(4):689–99. doi: 10.3233/JAD-2010-101470. [DOI] [PubMed] [Google Scholar]
- 40.Gerard-Gonzalez A, Gitelman SE, Cheng P, Dubose SN, Miller KM, Olson BA, Redondo MJ, Steck AK, Beck RW. Comparison of autoantibody-positive and autoantibody-negative pediatric participants enrolled in the T1D Exchange clinic registry. Journal of diabetes. 2013;5(2):216–23. doi: 10.1111/1753-0407.12031. [DOI] [PMC free article] [PubMed] [Google Scholar]
- 41.Pollio G, Hoozemans JJ, Andersen CA, Roncarati R, Rosi MC, van Haastert ES, Seredenina T, Diamanti D, Gotta S, Fiorentini A, et al. Increased expression of the oligopeptidase THOP1 is a neuroprotective response to Abeta toxicity. Neurobiology of disease. 2008;31(1):145–58. doi: 10.1016/j.nbd.2008.04.004. [DOI] [PubMed] [Google Scholar]
- 42.Barber AJ, Antonetti DA, Gardner TW. Altered expression of retinal occludin and glial fibrillary acidic protein in experimental diabetes. The Penn State Retina Research Group. Invest Ophthalmol Vis Sci. 2000;41(11):3561–8. [PubMed] [Google Scholar]
- 43.Barber AJ, Lieth E, Khin SA, Antonetti DA, Buchanan AG, Gardner TW. Neural apoptosis in the retina during experimental and human diabetes. Early onset and effect of insulin. J Clin Invest. 1998;102(4):783–91. doi: 10.1172/JCI2425. [DOI] [PMC free article] [PubMed] [Google Scholar]
- 44.Lieth E, Gardner TW, Barber AJ, Antonetti DA, Penn State Retina Research G Retinal neurodegeneration: early pathology in diabetes. Clin Exp Ophthalmol. 2000;28(1):3–8. doi: 10.1046/j.1442-9071.2000.00222.x. [DOI] [PubMed] [Google Scholar]
- 45.Barber AJ, Antonetti DA, Gardner TW. Altered expression of retinal occludin and glial fibrillary acidic protein in experimental diabetes. The Penn State Retina Research Group. Investigative Ophthalmology & Visual Science. 2000;41(11):3561–8. [PubMed] [Google Scholar]
- 46.Antonetti DA, Barber AJ, Khin S, Lieth E, Tarbell JM, Gardner TW, Group PSRR Vascular permeability in experimental diabetes is associated with reduced endothelial occludin content: vascular endothelial growth factor decreases occludin in retinal endothelial cells. Diabetes. 1998;47(12):1953–9. doi: 10.2337/diabetes.47.12.1953. [DOI] [PubMed] [Google Scholar]
- 47.Lieth E, Gardner TW, Barber AJ, Antonetti DA, Group TPSRR Retinal neurodegeneration: early pathology in diabetes. Clinical and Experimental Ophthalmology. 2000;28:3–8. doi: 10.1046/j.1442-9071.2000.00222.x. [DOI] [PubMed] [Google Scholar]
- 48.Chhablani J, Sharma A, Goud A, Peguda HK, Rao HL, Begum VU, Barteselli G. Neurodegeneration in Type 2 Diabetes: Evidence From Spectral-Domain Optical Coherence Tomography. Invest Ophthalmol Vis Sci. 2015;56(11):6333–8. doi: 10.1167/iovs.15-17334. [DOI] [PubMed] [Google Scholar]
- 49.Demir M, Oba E, Sensoz H, Ozdal E. Retinal nerve fiber layer and ganglion cell complex thickness in patients with type 2 diabetes mellitus. Indian journal of ophthalmology. 2014;62(6):719–20. doi: 10.4103/0301-4738.136234. [DOI] [PMC free article] [PubMed] [Google Scholar]
- 50.Frydkjaer-Olsen U, Soegaard Hansen R, Pedersen K, Peto T, Grauslund J. Retinal Vascular Fractals Correlate With Early Neurodegeneration in Patients With Type 2 Diabetes Mellitus. Invest Ophthalmol Vis Sci. 2015;56(12):7438–43. doi: 10.1167/iovs.15-17449. [DOI] [PubMed] [Google Scholar]
- 51.Oshitari T, Hanawa K, Adachi-Usami E. Changes of macular and RNFL thicknesses measured by Stratus OCT in patients with early stage diabetes. Eye. 2009;23(4):884–9. doi: 10.1038/eye.2008.119. [DOI] [PubMed] [Google Scholar]
- 52.Tavares Ferreira J, Proenca R, Alves M, Dias-Santos A, Oliveira Santos B, Cunha JP, Papoila AL, Abegao Pinto L. Retina and Choroid of Diabetic Patients without observed retinal vascular changes: a Longitudinal Study. American journal of ophthalmology. 2017 doi: 10.1016/j.ajo.2016.12.023. [DOI] [PubMed] [Google Scholar]
- 53.Xu Z, Wei Y, Gong J, Cho H, Park JK, Sung ER, Huang H, Wu L, Eberhart C, Handa JT, et al. NRF2 plays a protective role in diabetic retinopathy in mice. Diabetologia. 2014;57(1):204–13. doi: 10.1007/s00125-013-3093-8. [DOI] [PMC free article] [PubMed] [Google Scholar]
- 54.Zhong Q, Mishra M, Kowluru RA. Transcription factor Nrf2-mediated antioxidant defense system in the development of diabetic retinopathy. Invest Ophthalmol Vis Sci. 2013;54(6):3941–8. doi: 10.1167/iovs.13-11598. [DOI] [PMC free article] [PubMed] [Google Scholar]
- 55.Chang YC, Wu WC. Dyslipidemia and diabetic retinopathy. Rev Diabet Stud. 2013;10(2–3):121–32. doi: 10.1900/RDS.2013.10.121. [DOI] [PMC free article] [PubMed] [Google Scholar]
- 56.Huang Y, Xi Q, Chen Y, Wang J, Peng P, Xia S, Yu S. A dual mTORC1 and mTORC2 inhibitor shows antitumor activity in esophageal squamous cell carcinoma cells and sensitizes them to cisplatin. Anticancer Drugs. 2013;24(9):889–98. doi: 10.1097/CAD.0b013e328363c64e. [DOI] [PubMed] [Google Scholar]
- 57.Goldberg MF, Fine SL, Program USPHSDaAC . Symposium on the Treatment of Diabetic Retinopathy: Airlie House, Warreton, Virginia, September 29 to 29 to October 1, 1968. Washington, DC: Govt. Printing Office; 1969. [Google Scholar]
Associated Data
This section collects any data citations, data availability statements, or supplementary materials included in this article.