

Abstract
Implantable electrode devices enable long-term electrophysiological recordings for brain-machine interfaces and basic neuroscience research. Implantation of these devices, however, leads to neuronal damage and progressive neural degeneration that can lead to device failure. The present study uses in vivo two-photon microscopy to study the calcium activity and morphology of neurons before, during, and one month after electrode implantation to determine how implantation trauma injures neurons. We show that implantation leads to sustained, high calcium levels in neurons within 150 μm of the electrode interface. These neurons are morphologically distorted and mechanoporated after implantation, suggesting that calcium influx is related to mechanical trauma. Further, calcium-laden neurites develop signs of axonal injury at 1-3h post-insert. Over the first month after implantation, neuronal calcium activity increases, suggesting that neurons may be recovering. By defining the mechanisms of neuron damage after electrode implantation, our results suggest new directions for therapies to improve electrode longevity.
Keywords: two-photon microscopy, neuron calcium imaging, foreign body response, microelectrode implants, mechanical trauma, brain-computer interface
Graphical abstract
2. Introduction
Intracortical electrode arrays are necessary tools for recording extracellular action potentials from single neurons in brain-machine interface and basic neuroscience applications [1–5]. Implantation of these devices, however, is an inherently traumatic process that can result in immediate vascular and neural tissue damage, acute and chronic inflammatory glial responses, and progressive local neurodegeneration [6–13]. Neuron loss within the effective recording distance of electrode devices (electrode sites can resolve single neuron activity within 50-140μm [14–16]) is thought to lead to progressive failure of a device’s recording quality in rodent [17, 18], cat[19], and primate models [20, 21]. These biocompatibility issues must be surmounted before brain-machine interface technologies can have widespread clinical translation.
One major challenge to biocompatibility is acute tissue damage due to surgical insertion of electrode arrays. Post-mortem studies of stab wounds and acute implantations (1 and 24h) reveal that there is immediate neuronal cell death following implantation, and that the most rapid drop in neuronal cell density relative to healthy brain tissue occurs within the first 2 weeks post-insert [6, 7, 9]. Other post-mortem studies have begun to suggest that acute implantation can result in changes to the phenotype and activity of surviving neurons [22]. Namely, neurons within 100μm of the electrode initially show increases in excitatory neuron markers (VGLUT1, 3 days post-insert) and later show increases in inhibitory cell markers (VGAT, 1 month post-insert) [22–24]. One explanation for these findings is that the inflammatory environment surrounding the implanted electrode modulates neural activity. This is corroborated by experiments detailing the rapid response of microglia following electrode implantation and knowledge of neuromodulatory inflammatory species secreted by these reactive microglia [8, 25–28]. An alternative, unstudied explanation is that neuron activity is affected by sub-cellular, sub-lethal neuronal damage during implantation that may physically alter the synaptic connectivity of neurons [24].
In the present study, we use longitudinal, in vivo imaging of neuron morphology and neuron calcium (Ca++) activity to quantitatively map the effect of acute electrode implantation on neuron activity and health. We hypothesize that the mechanical trauma of electrode implantation can physically deform neuron cell bodies and neurites, leading to altered calcium activity and neurite degeneration. Calcium activity surrounding implanted electrodes is a particularly important read-out, as transient high calcium levels are associated with action potentials and burst firing during healthy neuron behavior [29], while high-concentration and prolonged calcium build-up in neuronal somas and neurites is associated with neurite degeneration and excitotoxic cell death [30–33].
We ultimately show that both neuronal somas and neurites within the effective recording distance are mechanically distorted during implantation. Both of these cellular compartments exhibit prolonged high calcium levels during implantation, following which neurites show early signs of degradation. Despite this, only a limited subset of cells that exhibited prolonged high calcium levels had membrane disruption by the end of the 3-6h experiment. By day 2 post-insert, cells within the affected region appear to be largely quiescent, but demonstrated recovery over the first 28 days post-insert. Overall, these results identify a previously unreported damage pattern that may point to new therapeutic targets to prevent neural electrode performance decline.
3. Methods
3.1. Experimental model and subject details
All experiments used a mouse model for neural electrode implantation. All mice were adult (> 8 weeks), male, 25-30g, and single-housed in room temperature with a 12h light/12h dark circadian cycle. Studies involving imaging of calcium transients in neurons during acute neural electrode implantation (≤ 6h post-insert) were performed with C57BL/6J-Tg(Thy1-GCaMP6s)GP4.3Dkim/J (Jackson Laboratories, Bar Harbor, ME; RRID: IMSR_JAX:024275), which express the calcium sensitive protein GCaMP in the neurons under the thymus cell antigen 1 (Thy-1) promoter, with positive expression in pyramidal neurons in Layers II/III and V of cortex (n = 5 animals) [29]. For chronic studies of Ca++ transients in neurons following neural electrode implantation (1-28d post-insert), C57BL/6J mice (RRID: IMSR_JAX:000664) injected with AAV-Syn-GCaMP6f obtained from the University of Pennsylvania Viral Vector Core were used. Based on pilot studies, we noted that the AAV-Syn-GCaMP6f model showed a higher proportion of GCaMP expressing neurons. Injection into motor, somatosensory, and visual cortices (<1μL per site) was performed with a micro-pipette and pressure injector. Animals were allowed to recover for >2 weeks prior to neural probe implantation and imaging to allow for adequate GCaMP expression (n = 8 animals implanted, with 4 additional discounted from chronic imaging studies due to premature death, surgical complication, or poor cranial window visibility)). To study neurite morphology following acute neural electrode implantation, Tg(Cnp-EGFP*)1Qrlu/J (n = 3 animals) and B6.Cg-Tg(Thy1-YFP)16Jrs/J mice (n = 4 animals; Jackson Laboratories, Bar Harbor, ME; respectively: RRID: IMSR_JAX:026105, 003709) were used [34, 35]. Respectively, these mice have GFP expression in oligodendrocytes and myelinated axons under control of the 2′,3′-cyclic nucleotide 3′ phosphodiesterase (CNP) promotor or YFP expression in layer V neurons and their neurite arborization that project upwards to in cortical layers I–III.
3.2. Surgery and propidium iodide administration
Implants for acute experiments and chronic imaging experiments were non-functional 16-channel, 4-shank planar silicon electrodes with 125 μm shank-spacing (NeuroNexus, Ann Arbor, MI). Shanks were 3 mm long, 15 μm thick, and tapered from 55 μm wide to a point. All procedures and experimental protocols were approved by the University of Pittsburgh, Division of Laboratory Animal Resources and Institutional Animal Care and Use Committee in accordance with the standards for humane animal care as set by the Animal Welfare Act and the National Institutes of Health Guide for the Care and Use of Laboratory Animals. For all surgeries, animals were anesthetized with intraperitoneal (IP) injections of 75 mg kg−1 ketamine and 10 mg kg−1 xylazine and head-fixed by ear bars. Depth of anesthesia was assessed by heart rate, respiratory rate, and toe-pinch reflex. For surgeries lasting longer than 1h and throughout acute experiments, animals received additional IP injections of 45 mg kg−1 h−1 ketamine. Each animal’s scalp was shaved, cleaned with ethanol and betadine (for survival surgeries), and resected with scissors. After removing periosteum from the exposed skull, a layer of veterinary cyanoacrylate was applied to the skull (Vetbond, 3M). A high-speed dental drill was used to create 5×5 mm craniotomy on one (for chronic preparations) or two (for acute preparations) hemispheres.
3.2.1. Acute preparation
As previously described [25, 26], following craniotomy, a dental cement well (Composite Flowable; Henry Schein, NY, USA) was placed around the exposed skull, and the animal was positioned under a two-photon microscope objective. The electrode array was stereotaxically targeted to motor or visual cortex at a 30-35° angle, avoiding large pial vasculature. Electrode array implantation to a depth of 250-350 μm (Layer II/III) was completed at a speed of 200 μm s−1 with an oil hydraulic microdrive (MO-81, Narishige, Japan). The insertion speed was selected to model with widely used implantation protocols, as well as to minimize tissue dimpling during insertion [25, 36, 37]. Because imaging occurred during implantation and continuously for 30 minutes post-implantation, it was not possible to cement the device to the skull for these acute studies. Any motion related damage associated with this conformation was limited by ear head fixation. Prior to implantation, animals received an IP injection of sulforhodamine 101 (SR101, 0.05mL, 1 mg mL−1) as a transient vascular contrast agent. Animals were maintained in an anesthetic plane throughout the duration of the acute experiment (3-6h). At the conclusion of the experiment, propidium iodide (PI, 1 mg mL−1 in saline) was topically applied to the cortex for 20-30min to label cells with disrupted cell membranes (n = 3 of 4 acutely implanted transgenic GCaMP animals) [38]. PI was washed off with saline and animals were imaged while still anesthetized. All animals were euthanized afterwards.
3.2.2. Virus injection and chronic preparation
Through preliminary studies (not shown), we qualitatively determined that viral injection of Syn-GCamP6f showed more Ca++ activity in neurites when compared to transgenically expressed Thy1-GCamP6. Denser labeling is preferred for power spectral density analysis, but can prohibit counting and morphological analyses if labeled cells are too densely packed. Therefore, viral injections were performed for chronic imaging studies that revolved around power spectral density analysis, while transgenic animals were used for the other studies. We performed AAV-Syn-GCaMP6f (University of Pennsylvania Viral Vector Core) injections after craniotomy of C57BL6/J mice (8 animals were implanted, though n = 4 for chronic imaging studies due to premature death, surgical complications, or poor cranial window visibility). Injection was performed in aseptic conditions at multiple locations in visual, somatosensory, and motor cortices. Injection was completed with a micromanipulator, 5-10 μm diameter glass pipette, and micro-injector (Toohey Company, Fairfield, NJ, USA). Vasculature was avoided during injection and negligible bleeding was observed during or after injection. Following injection, the craniotomy was sealed with glass coverslips that were secured with dental cement. Headplates (W12mm × D19mm × 1mm) were affixed to the mouse skull with dental cement and cyanoacrylate to be used in awake recording (Narishige, Japan). After 2-4 weeks after injection—or after GCaMP expression was observed to be stable—animals were anesthetized, the cover glass was removed from the skull, and neural electrode arrays were inserted into a region of cortex with abundant GCaMP expression—within 500μm of the injection site—at a 30-35° angle at a speed of 200 μm s−1 as previously described [39]. Following insertion, electrode arrays were anchored to the mouse’s skull with dental composite. For 3 animals, we noted that a thick fibrous layer of tissue had grown over the craniotomy between virus injection and neural electrode implantation. This tissue was fully or partially removed before implantation. The craniotomy was then sealed with silicone elastomer (Kwik-Sil, World Precision Instruments, Sarasota, FL) and a clean glass coverslip.
3.3. Two-photon and fluorescence macroscope imaging
During acute implantation (pre-insertion, during insertion, and at 1-6h post-insertion) and at 1, 2, 4, 7, 14, 21, and 28 days post-insert for chronic preparations, animals were imaged by a scanning two-photon microscope system consisting of a Bruker scan head (Madison, WI) and a laser tuned to 920nm with 100fs pulses at a frequency of 80Mhz (Mai Tai DS or Insight DS+; Spectra-Physics, Menlo Park, CA). The laser power was maintained between 20-40 mW. Emitted light was collected through a 16×, 0.8 NA objective lens (Nikon Instruments, Melville, NY) and detected with photomultiplier tubes (Hamamatsu Photonics KK, Hamamatsu, Shizuoka, Japan). Z-stack images were collected with a size of either 1024 × 1024 or 512 × 512 pixels with a resolution of 0.4-1.6 μm pixel−1 and a Z step size of 2-3 μm for high-resolution stacks or 10-25μm for stacks collected during electrode insertion. Z-stack images were collected every 1-2 min for the first 25-30min post implant. Time series images of GCaMP activity were typically acquired with an optical zoom of 2-3× at a frame rate of 3-4Hz at a resolution of 1-1.5μm pixel−1 for 1-3 min. Animals received IP injections of SR101 prior to imaging.
For animals with a chronic preparation, on each day of two-photon imaging as well as during probe insertion, GCaMP activity was also imaged through an MVX-10 epifluorescence microscope (Olympus, Tokyo, Japan) and a CCD camera with exposure time of 48.5 ms (CoolSnap HQ2; Photometrics, Princeton, NJ). GCaMP was excited using a white light source (Sola II, Lumencor, Inc; Beaverton, OR) and a 470±20 nm fluorescence excitation filter. The fluorescence emission (525±25 nm) was imaged over a field-of-view of 4×4 mm2 at a frame rate of 10-20 Hz for 3-5min. All chronic imaging time-points were performed with awake animals that were head-fixed by headplate on a custom frame.
One additional animal was included in this study that was implanted with a functional 16-channel, 4-shank planar silicon electrodes with 125 μm shank-spacing (NeuroNexus, Ann Arbor, MI) in order to characterize the effect of high-amplitude electrical stimulation on tissue deformation. At one month post-implantation, electrical stimulation was applied to a 703 cm2 irridium electrode site using a current isolator box (AMPI) as previously described [5, 40]. The stimulus parameter consisted of a charge balanced asymmetric cathodic leading electrical rectangular pulse with a width of 50 μs and a trailing anodic pulse width of 250 μs using a k value of 0.55 at 130 Hz. On a separate electrode site, a “rejuvenation” protocol was carried out as previously published using a monopolar 4s 1.5V DC bias [41, 42]. The stainless steel bone screw in the contralateral calvarium was used as the ground. GCaMP activity was imaged with the two-photon microscope at 3 Hz.
3.4. Quantification and Statistical Analysis
3.4.1. Acute studies – cell counting and distance measurement
Z-stacks from acute studies were analyzed to determine the number of GCaMP active cells following implantation as a function of distance from the probe’s surface and time post-insert. Cells were counted manually based on elliptical morphology, with major axis length between 10-20 μm (average major axis length of measured cells: 12.69 ± 0.42 μm). Cells included both cells with GCaMP signal excluded and included within the nucleus. A sample of counted neurons were measured post-hoc to confirm that their fluorescence intensity was >2× that of local background signal. Distance of a GCaMP active neuron or PI(+) cell from the probe’s surface was determined by manually defining a 2D mask to outline the electrode array’s footprint in ImageJ (National Institutes of Health). Because the electrode array is implanted at a 30-35°, the 2D mask was digitally rotated using the “Interactive Stack Rotation” tool in ImageJ to align with the array[43]. A distance transform was then created with the 3D mask using the “bwdist” function in Matlab (MathWorks, Boston, MA). Positions of manually counted cells were cross referenced with the distance transform to determine the distance between each cell and the nearest-contact point of the electrode array. Statistical differences in the number of activated neurons as a function of distance (bins of 10μm) and time (bins of 1-1.6 minutes) were determined by non-repeated measures (Matlab) or one-way repeated measures ANOVA analysis (SPSS Statistics, IBM), respectively, both of which using Tukey’s post-hoc test (p < 0.05). Statistical differences between counts of GCaMP active cells and PI(+) cells as a function of distance were determined by two-way ANOVA with Tukey’s post-hoc tests (p < 0.05, Matlab). Images of GCaMP active cells at 0 min post-insert and PI(+) cells 3-6h post implant from the same animal were manually aligned in ImageJ using the electrode array as a stable landmark.
3.4.2. Acute studies – GCaMP intensity measurements
The fluorescence intensity of GCaMP of neurites in cortical Layer I was tracked from 1-2 minutes pre-insertion, to 27.2 min post-insertion (n = 5 animals). Average fluorescence intensities within 150×68 μm regions of interest were measured at the tissue-electrode interface and in a control region that was >350 μm from the device. Fluorescence was calculated as F/Fo, where Fo is the average fluorescence of an ROI pre-insertion and F is the average fluorescence of an ROI at a given time-point post-insert. Insertion site and control region fluorescences were compared by two-way repeated measures ANOVA with Tukey’s post-hoc tests (significance: p < 0.05; SPSS Statistics, IBM).
3.4.3. Acute studies – morphological analyses
Z-stack images were also used to determine cell morphology. Cell somas of GCaMP active cells during peak activation (immediately after probe insertion) were manually traced and ellipses were fitted to the trace in ImageJ. The length of the major (b) and minor (a) axes of the fitted ellipses were used to calculate cell shape strain index (CSSI; Equation 1; Figure 2a) as previously described [44]:
| (Equation 1) |
Figure 2.
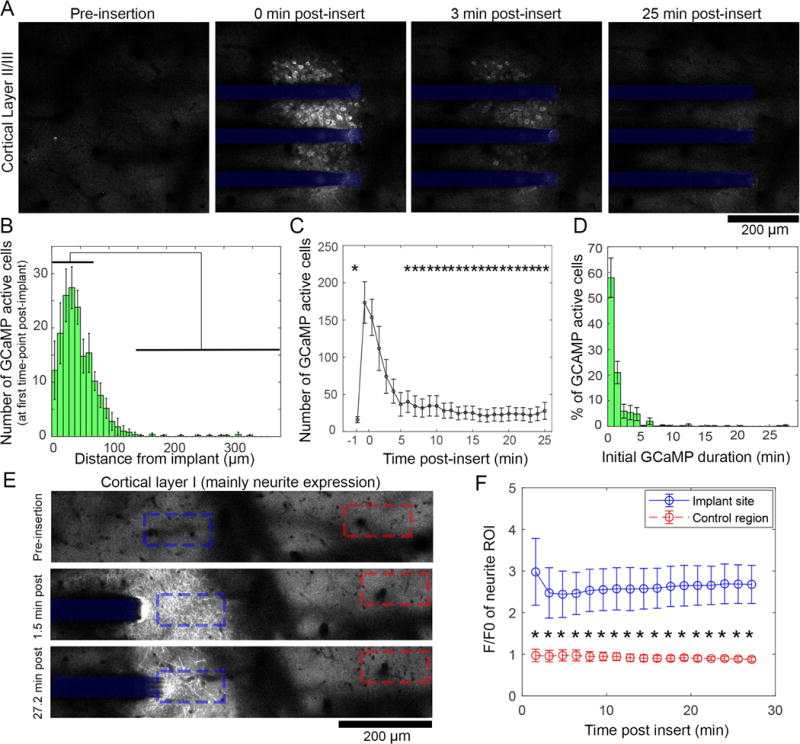
Widespread, long-lasting high Ca++ levels following electrode implantation. (A) Two-photon microscopy of electrode implantation into cortical layer II/III of Thy-1-GCaMP animals shows that neuronal soma Ca++ elevation occurs following implantation, and subsides by 25 min post-insert. (B) Quantification of the number of neurons activated in the minute post-implantation as a function of distance from the electrode shows that there are significantly more neurons activated between 0-70μm compared to >120μm from the implant (indicated by black bars, p<0.05, n = 5 animals). (C) The number of active cells dwindles rapidly after implant, with significantly more activated cells at 1-2min post-insert compared to pre-insertion (−1 min) as well as 6-25min (* indicate significant difference compared to 1 and 2 min post-insertion, p<0.05, n = 5 animals). Importantly, there was no difference in number of cells between pre-implant and 6-25 mins post-insert, suggesting activity returned to baseline. (D) Measuring the duration of GCaMP transients shows 42% of cells initially activated post-insert had influx longer than 1min, suggesting pathological activation (n = 5 animals). (E) Imaging of superficial cortical layer I, which predominately hosts GCaMP(+) neurites, shows similar widespread Ca++ elevation after implantation. High Ca++ levels in these neurites lasts for the duration of the initial imaging window (27.2 min). (F) There is a significant group-wise difference between the insertion site (blue) calcium and those of a distant control region (red, >350μm from implant) (repeated measures 2-way ANOVA p < 0.0001). All data presented as mean ± SEM.
CSSI assumes that, on average, a cell without strain is a circle with a mean diameter of Lo, while a strained cell becomes ellipsoid that can be represented by ∆L. Histograms of CSSI were generated with a bin size of 0.1 and statistically compared before and after insertion with two-way ANOVA with a two-sample Kolmogorov-Smirnov test (significance: p < 0.01).
Changes to neurite morphology were assessed with CNP-GFP and Thy1-GCaMP animals. Z-stacks from CNP-GFP mice were also analyzed for neurite orientation changes after neural electrode implantation. Neurite orientation was measured by performing a morphological opening operation with a line structuring element with a length of 25 pixels (optimized experimentally) at 11 different angles (15 to 180°, 15° intervals) on each image (‘imopen’ function in Matlab). Because 0° and 180° both represent horizontal lines, we included only 180° in our structuring element library to omit redundant filters. Neurite angle was determined to be the angle of the structuring element with the highest opening operation response for each pixel whose intensity was above a threshold value (Otsu’s thresholding method). Histograms of neurite orientation were calculated for regions of interest (50 × 75 μm rectangles) at the tissue-electrode interface in Layer I or in distant, healthy tissue regions (> 350 μm from the implant). Histograms between groups were compared with a two-sample Kolmogorov-Smirnov test (significance: p < 0.01).
In Thy1-GCaMP animals, neurite “blebbing” was tracked. Blebs are swollen, hypertrophic spherical bodies (2-8μm diameter, distinct from synaptic boutons which are < 2μm diameter) that develop along degenerating neurites following trauma [32, 45–47]. Blebs were automatically counted along Z-stacks in regions of interest that bounded the footprint of the electrode device and the tissue above the device. Blebs were also counted in distant regions from the implantation site (> 350 μm) to be used as controls. Both regions of interest were tracked at 1h and 3h post-insert. Automated bleb counting was performed via the Particle Analyzer function in ImageJ. Prior to using the Particle Analyzer, Z-stacks were first prepared by background subtraction (defined by of the Z-stack slice with the highest mean pixel intensity, where is the mean pixel intensity and σ is the pixel standard deviation), filtering with a 1-pixel radius median filter, and then binarized based on the ImageJ IsoData threshold variant method [48]. In order to avoid re-counting blebs along the Z-stack, every 4th slice (or every 8μm) was analyzed. Particles with radii between 2-8 μm were then counted. Changes in the density of blebs (blebs per 10 μm2) over time and between implantation region and distant regions were compared with repeated measures two-way ANOVAs with Tukey’s post-hoc tests (significance: p < 0.05). The distribution of bleb diameter was also quantified and compared between implant and distant regions at both time points with a two-sample Kolmogorov-Smirnov test (significance: p < 0.05).
3.4.4. Chronic studies
During electrode insertion, epifluorescence macroscope imaging revealed a subset of AAV-Syn-GCaMP6f animals that exhibited GCaMP activity that spread out from the implantation site across an expansive region of transduced cortex. The speed and duration of this Ca++ wave was quantified by tracking the margin of the Ca++ wave in 3-4 regions of interest on the cortex and averaging the velocity (μm/s) and duration (s) of Ca++ wave in these ROIs.
Following initial insertion imaging, macroscope and two-photon microscope time-series images were collected from days 2, 7, and 28 post-insert (n = 4 animals, with 4 additional animals removed from longitudinal studies due to premature death, surgical complication, or poor visibility through the cranial window). Power spectral density (PSD) of dF/Fo GCaMP signal, where Fo is the mean GCaMP intensity over time, from 2.5-5 min macroscope recordings was calculated for each pixel from 0.1-10Hz after computing the Fast-Fourier Transform for each series (Matlab) [49, 50]. The sum of PSD over the 0.1-1.2Hz frequency band was calculated, and the average value within a 600×600 μm ROI around the implant was taken at each time point. This band was selected as it contains the majority of GCaMP6 activity in the 4.3 subtype [29]. Values over time were statistically compared by one-way ANOVA with Tukey’s post-hoc tests (significance: p < 0.05).
4. Results
Previous studies have shown that neural probe implantation incurs neuronal cell death within 1h post-insert, but the mechanisms are unclear, including if there is other sub-lethal damage to neurons. In order to explore these unknowns, we implanted non-functional 4-shank silicon planar electrodes in to the cortex of mice with transgenically (n = 5 animals) or virally (n = 4 animals, with 4 additional animals removed from longitudinal studies due to premature death, surgical complication, or poor visibility through the cranial window) expressed calcium sensitive protein GCaMP in neurons to visualize changes in activity and morphology following neural probe implantation. Morphological changes were also assessed in mice with transgenically expressed GFP in oligodendrocytes and myelinated neurites (n = 3 animals) and mice with YFP or GCaMP expressed in cortical neurons (n = 4 animals). Cell membrane damage was tracked with the cell-impermeant dye propidium iodide (PI) (in a subset of acutely prepared transgenic Thy1-GCaMP animals, n = 3 animals). Changes were tracked acutely (up to 6h post insert) and chronically (from day 1 to 28 post insert) with two-photon microscopy (TPM) and epifluorescence macroscopy.
4.1. Neural probe insertion causes abnormal and long-lasting elevated calcium levels in neurons within 150μm of device
While observing neural probe insertion into the cortex of transgenic Thy1-GCaMP mice with an epifluorescence macroscope, we noted a visible increase in GCaMP activity around the implantation site (Figure 1a, Movie S1). By generating traces of average fluorescence intensity at the insertion site before and after insertion (Figure 1b), the dynamics of the insertion-related Ca++ activity are elaborated. Activity peaks roughly 4.1s post-insert, begins to drop by 8s, and stabilizes by 42s. Over the 54.1s imaging window, Ca++ signal did not return to pre-insertion baseline.
Figure 1.
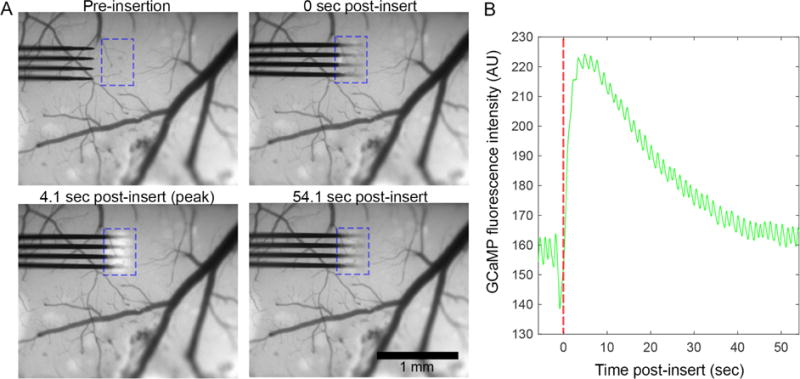
Electrode array implantation causes neuronal Ca++ elevation within 150 μm of the device. (A) Epifluorescence macroscope imaging of array implantation into the cortex of transgenic Thy-1-GCaMP6 animals reveals a visible increase in neuronal Ca++ in the vicinity of the implant site (outlined by a blue dotted box). (B) Traces of Ca++ signal within the dotted blue box in panel (A) show that Ca++ signal peaks by 4.1s post-insert, returns towards baseline by 19.4s, and begins to plateau above by 42s.
In order to resolve Ca++ dynamics during electrode insertion with sufficient X, Y, and Z resolution to study single cells and cellular processes, neural electrode insertion and the subsequent 25-30min post-insertion were imaged by TPM. 3D Z-stacks of the implantation site were imaged every 1-2min with a Z-step size of 10-25 μm. This enabled visualization of the entire implantation site from the meninges through Layer II/III of cortex with sufficient temporal resolution to capture broad changes in Ca++ activity. In accordance with macroscope imaging, GCaMP activity peaked immediately after insertion, and fell to relative silence in the minutes that followed (Figure 2A, Movie S2). During peak activation (0 min post-insert), activated neurons were largely confined within 150 μm of the implant, with significantly more active neurons between 0-70 μm from the probe compared to >120 μm from the implant (Figure 2B; one-way ANOVA shows significant difference across distance, p < 0.0001; all significant bin comparisons p < 0.05 in Tukey’s post-hoc tests). Peak activation lasted for the first 2 min post-insertion, which had significantly more activated cells within 200μm of the electrode than either pre-insertion or 6-25min post-insertion (Figure 2C; one-way ANOVA shows significant difference across time, p < 0.0001; significant bin comparisons p < 0.05 in Tukey’s post-hoc tests). Further, there was no difference between the number of neurons between pre-insertion and 6-25 min post-insertion, suggesting that activity returned to baseline. Finally, the duration of GCaMP transients of cells that were depolarized during implantation were much longer than reported values for normal GCaMP6 activity (half-decay time for fluorescence in GCaMP6 4.3 = 360 ± 300 ms), with 42% of GCaMP transients lasting more than 1 min (Figure 2D) [29]. Due to temporal resolution limitations, we were only able to sample GCaMP activity every 1-2 min, however, sustained GCaMP activity was only considered if fluorescence activity was sustained and uninterrupted between time points.
GCaMP(+) neurites in cortical layer I also showed high Ca++ levels over the first 27.2 min post-insert (Figure 2E). In contrast to neuron cell bodies, which had elevated Ca++ levels within the first minutes post-insert, neurite fluorescence was sustained through the initial 27.2 min compared to distant regions >350 μm from the implantation site. Tracing the average fluorescence intensity in ROIs at the implantation site (Figure 2E–F, blue) vs. ROIs at distant regions (red), there was a sustained statistically significant increase in GCaMP intensity at the implantation site (repeated measures two-way ANOVA, p < 0.0001).
4.2. Effect of dura resection on implantation-related calcium elevation
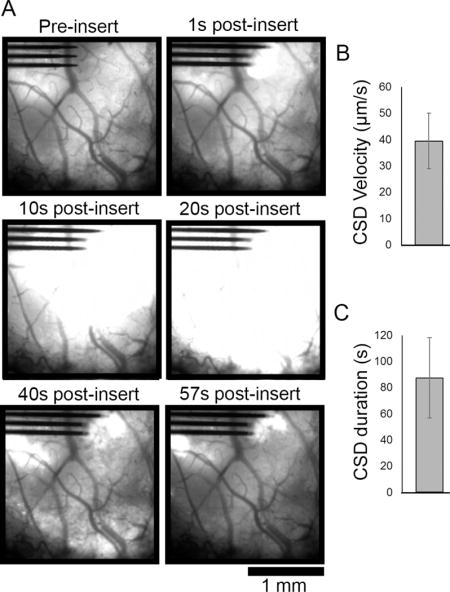
Animals that were injected with AAV-Syn GCaMP6f virus and prepared for chronic imaging studies were implanted under a fluorescence macroscope. A subset of these animals (3 out of 8 implanted animals) could not be successfully implanted without removal of a dense fibrous tissue over the surface of the brain that formed after virus injection surgery. These animals exhibited a wave of GCaMP activity after implantation that extended across the extent of the transduced cortex, far beyond the site of mechanical insertion impact (Figure 3A, Movie S3). The Ca++ wave had a velocity of 39.45 ± 10.52 μm/s (mean ± SEM; Figure 3B) and a duration of 87.35 ± 30.62 s (mean ± SEM; Figure 3C), which is consistent with reported values for cortical spreading depression (CSD) [51]. Virus injected animals without durotomy exhibited calcium elevation similar to transgenic animals (Figure 1).
Figure 3.
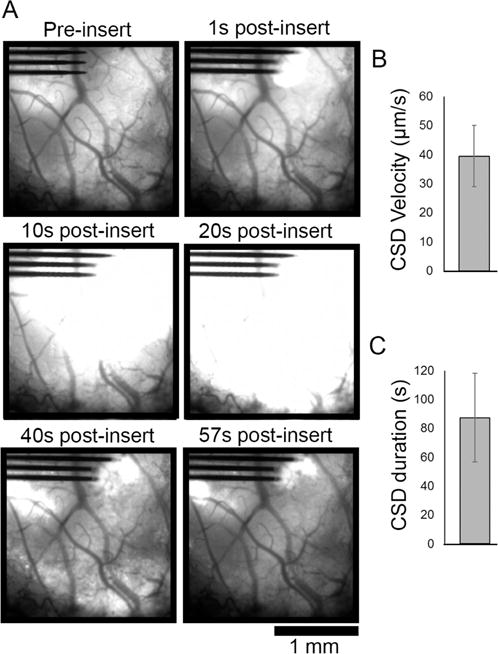
Electrode array insertion after partial or full durotomy of AAV-Syn-GCaMP6f animals resulted in cortical spreading depression (CSD) activity. (A) Fluorescence macroscope imaging of a subset (n = 3 of 8 implanted animals) of animals that transduced with GCaMP under control of synapsin promotor via AAV vector injection developed significant fibrosis under their cranial windows. After resection of the fibrous tissue, probe implantation created fast-moving GCaMP activity consistent with CSD that spreads across the transduced region of cortex that resolved by 57s post-insert. (B) CSD velocity was measured to be average 39.45 ± 10.52 μm/s and (C) duration was on average 87.35 ± 30.62 s (mean ± SEM, n = 3 animals).
4.3. Neuronal sub-cellular compartments are morphologically deformed following neural electrode insertion
Noting that neuronal deformation can cause abnormal neural activity [52, 53], we quantified the morphology of GCaMP active cells in transgenic Thy1-GCaMP animals during peak activation following neural electrode insertion. The mechanical strain of these cells were quantified by a Cell Shape Strain Index (CSSI) [44], which captures how much a cell deviates from a perfect circle by fitting an ellipse to a cell’s perimeter (Figure 4A; bottom: example average CSSI values are shown, with lower values indicating less strain and high values indicating more cellular strain). We noted that on average, cells were more strained after implantation compared with the same tissue prior to implantation (Figure 4B, cells with CSSI > 0.3 are indicated with red *). These changes were quantified by comparing distributions of CSSI before (138 neurons from 4 animals) and after implant (472 neurons from 4 animals). Despite unmatched sample sizes, there was a statistically significant difference between distributions of CSSI (Figure3C; Kolmogorov-Smirnov test, p < 0.0001).
Figure 4.
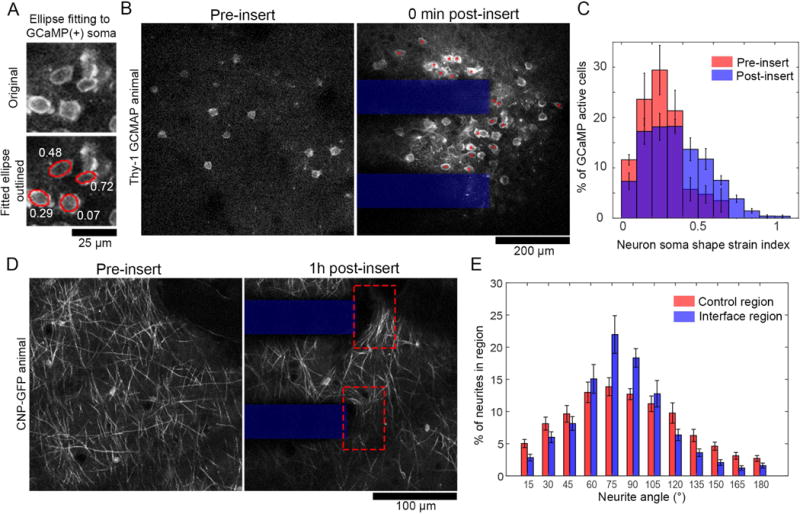
Neurons activated by electrode implantation are morphologically deformed. (A) Neuron soma morphology is measured by manual tracing cells and ellipse fitting (bottom, red traces). Neuron soma shape strain index (white text) measures the extent of ellipsoid deformation of a cell body. (B) Images of GCaMP(+) neuron somas before and after insertion. Red * indicate cells with a neuron soma shape strain index > 0.3. (C) Histograms of neuron soma shape strain index pre (red) and immediately post (blue) probe insertion. There is a significant difference between the group-wise distributions (Komogorov-Smirnov test, p <0.0001. (D) Transgenic animals with GFP expressed in oligodendrocytes under control of the CNP promotor show myelinated axons in layer I of cortex. After insertion (right), axons at the electrode-tissue interface (dotted red box) appear stretched perpendicular to the direction of insertion. (D) Each pixel with neurite signal was binned according to it’s orientation angle by morphological filtering. ROIs were 50×75μm boxes around either the electrode-tissue interface or tissue >350μm from the interface. Histograms of neurite orientation reveal significantly group-wise differences in distribution (Komogorov-Smirnov test, p < 0.0001). All data presented as mean ± SEM.
Deformation of neurites was also explored with transgenic CNP-GFP mice, with GFP expression in oligodendrocytes and myelinated neurites. Qualitatively, we noted that CNP(+) neurites appeared to be aligned across the face of the electrode after insertion (Figure 4D). This was quantitatively defined by determining neurite orientation through morphological opening operations with line structuring elements angled between 0-180° in 15° intervals. The neurite angle was selected to be the angle of the structuring element with the maximal morphological opening response. Comparing the distribution of neurite angles in regions of interest at the tissue-electrode interface to regions of interest in distant tissue (> 350 μm from the electrode), there was a statistically significant difference between neurite angle distributions (Figure 4E; Kolmogorov-Sminov test, p < 0.0001).
4.4. Sustained elevated Ca++ levels in neuronal sub-cellular compartments at 1h and 3h post-insert
The Ca++ event that had started during implantation continued through at least the first hours post-insert in the neurite and soma sub-cellular compartments of transgenic Thy1-GCaMP animals. In the neurites of cortical layer I, Ca++-laden spherical bodies formed by 1h post-insert and continued to develop through at least 3h post-insert in Thy1-GCaMP animals (Figure 5A). These elements were consistent with previous descriptions of axonal ‘blebs’, which are 2-8 μm in diameter with high calcium concentration [32, 45–47]. Automated particle analysis was used to estimate the density of blebs (in units of blebs / 10μm2 of tissue) in cortical layer I of Thy1-GCaMP mice at 1h and 3h post-insert at the implantation site as well as in tissue > 350 μm from the implantation site (Figure 5B, top). There was a significant group-wise difference between the implant site and distant regions for bleb density, but there was no effect of time (repeated measures two-way ANOVA, p < 0.001). Tukey’s post-hoc tests confirmed that there was significantly higher bleb density at the implantation site at 1h post insert, with a trending difference at 3h post-insert (p < 0.05 at 1h, p = 0.064 at 3h). The distribution of bleb diameters was also different between the implant site and distant regions at 1h and 3h post-implant, with a larger proportion of >2.5μm diameter blebs at the implant site (Figure 5B, bottom; Kolomogorov-Smirnov test, p <00001). Time-series images collected at 1h and 3h post-insert show that these blebs may still have fluctuations in calcium levels, but they showed sustained elevated calcium relative to background (Figure S3). In addition to differences in bleb density between the implant site and distant regions, we also qualitatively compared blebbing at the implant site before and after implantation (Figure S5). There were few blebs at the implant site prior to insertion, nor in the minutes that immediately followed insertion (Figure S5, middle; also, Figure 2B, where we elevated calcium levels in neurites after implantation, but without the beaded morphology typical of blebs). Rather, blebs appeared to form within the first hours after insertion.
Figure 5.
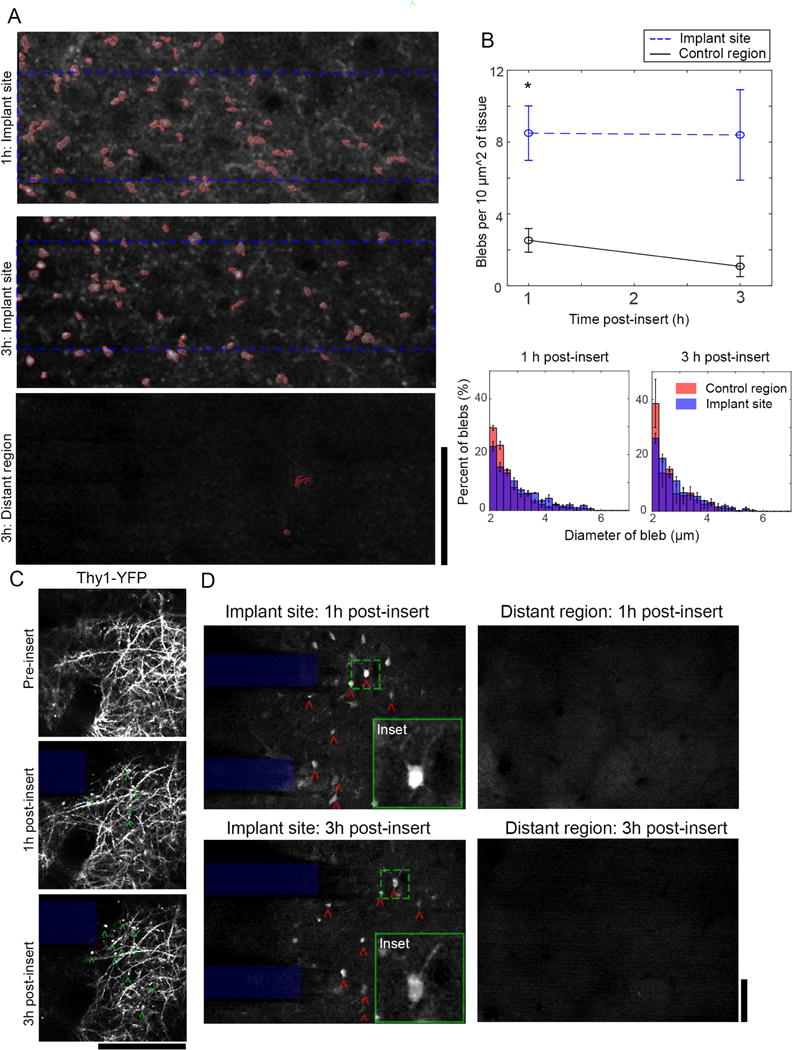
High Ca++ levels in neurite and soma sub-cellular compartments at the tissue-electrode interfaces persists through at least 3h post-insertion. (A) In layer I, Ca++-laden blebs in neurites were visible from 1-3h at the tissue-electrode interface (top), but not in distant cortical regions (bottom). Particle analysis was used to count blebs dorsal to the implanted electrode (dotted blue rectangle). (B) Top: There is a statistically significant increase in bleb density at the implant site compared to distant tissues, with Tukey’s post-tests confirming that there is a statistically significant increase at 1h and a trending increase at 3h post implant (repeated measures 2-way ANOVA, p < 0.01; Post-test for 1h: p < 0.05). Bottom: The distribution in diameter of blebs is significantly different between blebs at the implant site and distant region, with larger blebs prevalent at the implant site at both time-points (Kolmogorov-Smirnov test, p < 0.00001). Data presented as mean ± SEM. (C) Observation of bleb development (green ˆ) in Thy-1 YFP animals confirmed that blebs formed within layer I neurites. (D) A sub-population of Ca++-laden neurons with nuclear GCaMP inclusions (red ˆ) were tracked at 1-3h post-insertion in cortical layer II/III. These cells were only found within 150 m of the tissue-electrode interface (left), not in distant regions (right). Green dashed boxes indicate location of insets. Insets are 70×70μm; All scale bars = 100 μm.
In Thy1-GCaMP animals, blebs appeared mostly as isolated spheres that were disconnected from any neurite arborization. To determine if blebs were in fact isolated, we examined Thy1-YFP mice, which have YFP reporter expression to give a more stable and complete anatomical map of neurons (Figure 5C). While blebs formed in these animals on a similar time frame as the Thy1-GCaMP mice, they appeared to be connected to larger neurite structures. This suggests that the Ca++-laden blebs in Thy1-GCamP animals are not isolated, but rather highlight the discontinuous distribution of Ca++ in neurites in the vicinity of the tissue-electrode interface.
At 1-6h post-implant, there were few observable GCaMP transients in layer II/III neuronal somas at the tissue-electrode interface or in distant tissue > 350μm from the implant (Figure 5D). This is possibly due to the systemic effects of the ketamine-xylazine anesthesia[54]. Nonetheless, 3 of 4 animals that were imaged at 3h post-insert had highly fluorescent GCaMP signals in neurons at the tissue-electrode interface, but not in distant regions (Figure 5D, red ˆ). These neurons were abnormal in that they had GCaMP signal in both the cytosol as well as the nucleus, where as normal GCaMP signal is confined to the cytosol (Figure 5D, Insets) [55]. This may suggest that the nuclear membrane in these cells has been compromised and can no longer exclude GCaMP from entering.
4.4. Cells with membrane damage at 3-6h post-insert are geographically distinct from GCaMP(+) cells activated during electrode implantation
Mechanical deformation of neurons can damage and disrupt their cell membranes [45, 56]. In order to test cell membrane permeability in the vicinity of implanted electrodes, we topically applied the cell-impermeant dye propidium iodide (PI) to the cortical surface at the end of acute implantation studies of transgenic Thy1-GCaMP animals (3-6h post-insert) (Figure 6A, left). PI enters cells to stain their nuclei if the cell and nuclear membranes have been damaged[57]. By aligning images PI(+) cells at 3-6h post implant to images GCaMP activity at peak activation post-insert, it was clear that PI(+) cells were more proximate to the implantation site than GCaMP active cells (Figure 6A, middle and right). The distributions of PI(+) and GCaMP active cells as a function of distance from the implantation site were statistically different (Figure 6B, two-way ANOVA, p < 0.00005) with Tukey’s post-hoc tests indicating significantly more PI(+) cells than GCaMP active cells between 0-10μm from the probe’s surface (p <0.001), and significantly less PI(+) cells than GCaMP active cells between 20-50μm from the probe’s surface (p < 0.001).
Figure 6.
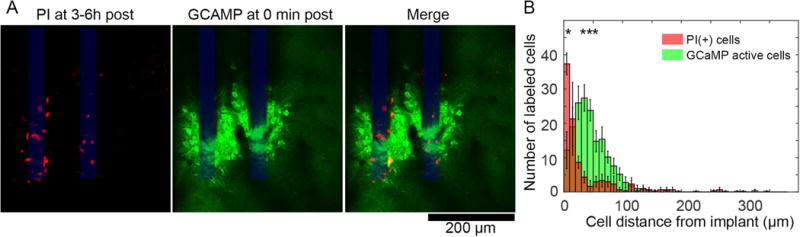
Cells with membrane dysfunction at 3-6h post-insert are geographically distinct from cells with high Ca++ levels during device insertion. (A) At 3 or 6h post insertion, propidium iodide (PI) was topically applied over cortex to label cells with disrupted cell membranes (left). Images at these time points were aligned to images of transgenic Thy1-GCaMP6 activity at 0 min post-insert using the electrode shanks as a stable land mark (middle and right). PI(+) cells appear to be closer to the electrode-tissue interface than GCaMP active cells. (B) A histogram of PI(+) (red) and GCaMP(+) (green) cells as a function of distance from the neural probe show that PI(+) cells are geographically distinct from the GCaMP(+) cells, with statistically significant groupwise effects (2-way ANOVA, * indicate significant post-hoc tests, p < 0.001, n = 4 animals for GCaMP active cells; n = 3 animals for PI cells). Data presented as mean ± SEM.
4.5. Increasing GCaMP activity within 150 μm of the electrode array over 28d post-insert
In order to study changes in Ca++ activity surrounding implanted electrodes in the early chronic phase post-insert, mice were injected with AAV-Syn-GCaMP6f virus (Figure 7). Viral injected animals were selected for chronic studies due to preliminary studies (not shown) indicating that viral injected AAV-Syn-GCaMP6f animals had a greater proportion of GCaMP expressing neurons.
Figure 7.
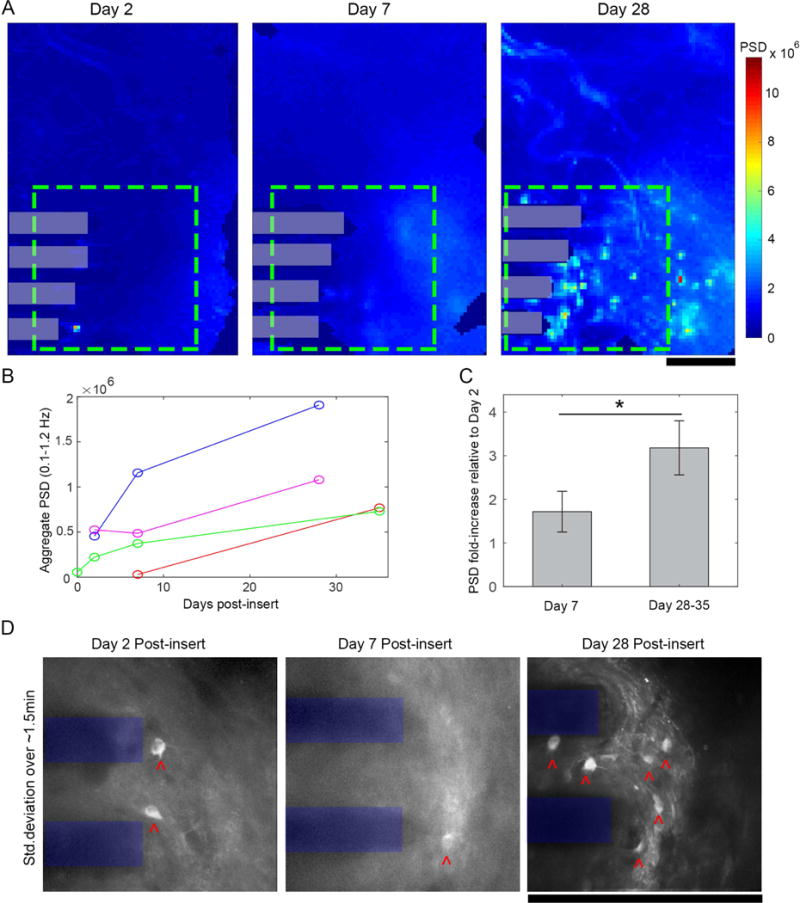
Chronic neural Ca++ activity surrounding a neural electrode increases after implantation. (A) Power spectral density (PSD) of 5 min epifluorescence macroscope recordings was summed for each pixel over 0.1-1.2Hz over 2-28 days post-insert. Power within a 600×600μm ROI (green dashed box) increased progressively over time post-insert (electrode shanks in gray boxes). (B) PSD increased over time in 4/4 animals (C) Relative to aggregate PSD at Day 2 post-insert, there were fold-increases in PSD at day 7 and day 28-35 post –insert, with a statistically significant increase on relative PSD over time (Student’s T-test, p < 0.05; mean ± SEM). (D) Standard deviation projections of TPM image series within the same ROI (electrode shanks shown in blue) reveals increasing numbers of GCaMP active neurons (neuronal somas indicated by red ˆ) over time post-insert. All scale bars 250 μm.
Following implantation, we estimated the degree of GCaMP activity in around the implant by quantifying the PSD over the 0.1-1.2Hz band (Figure 7A–C). Qualitatively, PSD increased from day 2 to day 28 post-insert (Figure 6A). Quantitative assessments of average 0.1-1.2Hz PSD within the 600×600 μm ROI (Figure 7A, green dashed box) confirmed these observations, with PSD showing an increasing trend for all (4/4) animals over the first month post-insert (Figure 7B). Further, by quantifying the relative PSD fold-increases at days 7 and 28-35 post-insert compared to day 2, we identified statistically significant elevation in power at days 28-35 (Figure 7C; 1.72 ± 0.47 v. 3.18 ± 0.62, mean ± SEM; Student’s t-test, p < 0.05, n = 3 of 4 animals, one animal excluded due to dural bleeding on Day 2). Two-photon microscopy was used to determine if the increase in PSD was also associated with an increase in dynamic calcium behavior in individual neurons (Movie S6). Standard deviation projections of time series images show that there are more active cells with time post-insert (Figure 7D, cells indicated by red. In these time-series movies, some axons which appeared to be stretched across the electrode’s surface (as described in section 3.2.) were able to exhibit GCaMP transients by 28d post-insert (Movie S6, right panel).
5. Discussion
While high-yield, high-SNR neural recording can be obtained from implanted neural electrodes, reproducibility across implants remain high, due to the variability in implantation trauma. Furthermore, a uniform trend of decline in recording quality months to years post neural electrode implantation suggest that the initial trauma of acute implantation may also create the origin of the chronic inflammation and neurodegeneration [6, 7, 9, 25, 26]. Beyond this, it has long been believed—but not conclusively demonstrated—that electrode implantation will further damage neurite arborization without necessarily killing neurons. This dynamic tissue damage pattern has been largely unexplored [24], but could explain observed changes to neuron phenotype following implantation [22, 23]. In the present study, we hypothesized that electrode implantation will mechanically distort neurons, leading to abnormal calcium activity and axonal degeneration. Morphological measurements of neuronal soma shape and neurite orientation confirmed that neurons were in fact mechanically distorted. Imaging of calcium before and after electrode insertion demonstrated that calcium levels increased after insertion, and persisted through at least 3h post-insert. Further, at 1-3h post-insert, neurites began to show signs of injury and possible degeneration. Despite this, a small population of cells demonstrated compromised membranes at 3-6h post-insert compared to the number of cells that initially expressed high calcium levels after implant. Over the first month post-insert, calcium activity in neurons surrounding the implanted devices increased, suggesting that cells recover after initial insult. Together, these findings allow for the following conclusions:
5.1. Mechanical deformation of cells may underlie high calcium levels in neuron cell bodies and neurites
Both neuronal soma and neurite sub-cellular compartments showed altered morphology after electrode implantation. The cell-shape strain index shows that neuron somas in the vicinity of the tissue-electrode interface were more elliptical than neurons in the same cortical region pre-insertion. This is likely due to the strain generated as the probe displaces tissue during insertion, as previously suggested [11, 44]. Changes in the distribution of neurite orientation at the tissue-electrode interface suggest that either neurites were stretched across the face of the device during insertion, or that neurites were pushed together during insertion. In either case, the orientation metric indicates that the neurites were mechanically distorted during probe entry. This suggests that the act of implantation mechanically distorted and strained neural tissue, as has previously been shown in implantations into ex vivo brain slices [36] as well as studies of in vivo brain dimpling during implantation [58]. Importantly, mechanical distortions of neuron somas and neurites has previously been shown to disrupt neuron membrane integrity [31, 45, 56], disrupt neurite cytoskeletal structure [32, 59, 60], and incur high cellular Ca++ influx [31–33]. One limitation of these morphological analyses was our inability to track cell-shape strain index and neurite orientation of the same somas and neurites before and after implantation. This is due to the gross deformation in the Z-axis of the tissue during implantation (over 60μm deformations at points), which complicated cell tracking. To account for this, we sampled neurons in the same region (tracked by blood vessel landmarks) before and after implantation, which gives the best approximation of strain, but cannot give the actual cell strain. Future studies may address this by using cell labels with sparser expression that can make cell-tracking more viable or using advanced 3D imaging modalities.
In this work, Ca++ flooded neurons and neurites at the tissue-electrode interface within 1 min of implantation. Importantly, over 42% of cells affected by this implantation-related Ca++ influx showed elevated Ca++ levels that lasted for over 1 min, which is > 90-1000× longer than action potential-related to single GCaMP6 4.3 transients [29]. Elevated Ca++ after mechanical damage to neurons can come from opening Ca++ channels and transporters [33, 61], mechanoporation [31, 56], or from release of intracellular calcium stores [32, 62]. The morphological results from this study show that many cells were in fact mechanically distorted after implantation, and propidium iodide staining at the end of experiments show that a subset of (non-neuron specific) cells had some degree of mechanoporation. While this may suggest that only a subset of cells that demonstrated abnormal Ca++ levels, it is also possible that more cells were initially mechanoporated, but were able to self-repair by the time of propidium iodide infusion [31, 56]. Whether distortion of cells led to mechanoporation or not, mechanical deformation of neuron somas and neurites is still sufficient to cause release of intracellular Ca++ stores and/or opening of voltage gated calcium channels and calcium transporters [32, 33, 61, 62]. These findings reinforce the importance of pursuing neural electrode footprints and insertion strategies that minimize mechanical strain and tissue distortion after implantation [63].
Unexpectedly, we found that removal of dura prior to implantation correlated with cortical spreading depolarizations (CSD) during implantation. CSDs are a global event that disrupts normal neural function, heightens the risk of neuronal injury and cell death, and is thought to underlie migraine pathology [64]. Because this phenomena was only observed in animals that had partial or full durotomy 2-4 weeks following AAV injection, we believe that the CSDs may have been related to this additional trauma. In this study, animals that developed thick fibrosis on the surface of the brain had previously received a craniotomy during the virus injection procedure [65, 66]. It is possible that fibrosis was related to the cover glass that remained on the surface of the brain between virus injection and implantation. Foreign bodies on the surface of the brain have previously been shown to incite fibrosis [39, 65]. Ultimately, this may suggest that repeated surgical interventions, epidural fibrosis, and/or duratomy could affect the nature of Ca++ activity following implantation. Alternatively, it is possible that CSDs were occurring in a larger subset of animals, but it is only apparent in some virus injected animals due to the virus’s variable expression pattern [67]. Future studies should explore these potential mechanisms and consider the impact of CSDs in regeneration and degeneration following electrode array implantation.
While most electrode implantations are designed to be performed at 90° relative to the surface of the brain, electrode arrays in this study were implanted at 30-35° in order to accommodate geometric constraints of the two photon microscope objective for dynamic spatiotemporal imaging [13, 25, 26, 28, 39, 47]. The angled insertion may have resulted in more shearing of vertical axonal projections than a perpendicular insertion, which has been suggested to generate more blebbing-type injury [45]. While this could also result in shearing damage penetrating arterioles and venules, we actively mapped and avoided these vessels during implantation as previously described [68]. Despite these concerns, we believe that even “perpendicular” implantations will still generate a distribution of local shear and compressive forces due to the natural variability in the angle of “vertical” axonal projections and the curvature of the brain. This is especially true of large, multi-shank arrays, which span large regions of brain curvature. With these considerations, the angled insertion of these experiments is still relevant for traditional “perpendicular” insertions.
5.2. Axonal transport disruption after mechanical deformation and Ca++ influx
Regardless of the mode of Ca++ entry, the prolonged high Ca++ levels observed after implantation suggests abnormal cell physiology and can jeopardize the health of the neurons. In addition to disrupting cellular ion balance, high concentrations of Ca++ can activate calcineurin and calpain, enzymes that can prevent neuronal Ca++ efflux and cause severe degradation of axonal cytoskeletal proteins [32, 62]. Mechanical deformation as well as calcium-activated calpain can cause disruption of microtubule structure, which is responsible for aggregation of axonal transport proteins and ions and the local swelling that defines blebs [32, 59]. This mechanism serves as a link between the current study’s observation of prolonged elevated Ca++ level and axonal blebbing. Our observation of blebs forming within the first hours post-insert is also consistent with other studies of mechanical trauma [31, 32]. Further, prolonged high Ca++ levels and axonal blebbing are known precursors to neuron cell death, neurite degeneration, and a loss of synaptic connectivity [31, 45, 61, 69]. Due to limitations of our acute preparation, it was not possible to track individual neurons for sufficient time to determine the fate of axons that exhibited blebbing or neurons with severe, high Ca++ levels. Nonetheless, whether these axons ultimately repaired or degenerated, the presence of blebbing is sufficient to assert that neural electrode implantation caused some axonal transport interruption, with potential for neurite degeneration.
5.3. Normal Ca++ activity increases over the first month post-insertion
After the initial Ca++ influx after probe insertion, there was little GCaMP activity observed in the first hours, both adjacent to the implant as well as in distant regions from the implant. This is likely due to ketamine/xylazine anesthesia, which is known to suppress spontaneous activity, but would not prevent Ca++ influx from mechanical or electrical stimulation [31, 54, 70]. A cohort of GCaMP-virus injected animals was prepared with cranial windows to track awake, spontaneous GCaMP activity over the first month post-insert overcome this limitation. We noted that from day 2 to day 28 post-insert, all animals showed an increase in PSD in calcium activity at the tissue-electrode interface, similar to previous reports [24]. Time-series videos of cells from this population confirmed that the Ca++ transients of these cells was < 1s, as has been reported for healthy, awake GCaMP6 4.3 subtype activity [29]. This is reminiscent of reports of neuronal suppression following TBI, followed by hyper-excitability at later time-points [71–73]. Noting our observations of axonal trauma following implant, a possible explanation for dynamic changes in neural activity may be on account of axon degeneration and regeneration. In tissue slice recordings following TBI, axotomized neurons show decreased excitability while intact neurons show an increase in excitability [69]. In vitro studies further corroborate this, showing that neurons lose a significant amount of connectivity and oscillatory behavior immediately following an impact [52, 61]. At later time-points, it is possible that synaptogenesis has occurred, leading to increases in neuron Ca++ activity as suggested by molecular studies of the brain following traumatic brain injury [74]. This ultimately suggests that acute injury may have long-lived consequences, and may instigate changes to the functional connectivity of neurons at the tissue-electrode interface.
An alternative–and potentially parallel—explanation is that gliotransmission could be modulating neuronal activity at the tissue-electrode interface [22]. This theory suggests that glia could cause both neuron hyper-excitability as well as neuron suppression at later time points post-implant. While the current study shows an increase in cells with GCaMP signaling with time post-insert, it is possible that there is still a population of GCaMP expressing, but silent neurons that is unaccounted for. These explanations should be further explored with longitudinal studies with Thy1-YFP mice that can be used get a more complete depiction of neurite health over time.
5.4. Beyond implantation trauma: other sources of mechanical injury
The present work suggests that the mechanical trauma of electrode array implantation is correlated with sub-cellular neuronal damage. While implantation is the most significant source of tissue deformation and stress from a neural electrode, there are other sources of mechanical injury at the tissue-electrode interface. Brain micromotion during respiration, heartbeat, and movement creates stress at the tissue-electrode interface, however the force of electrode penetration is >10× the force generated by micromotion [75]. The current work observes aberrant Ca++ activity in neuron somas and neurites during implantation, but not during awake and anesthetized micromotion in acute or chronic experiments. This may suggest that the potential contribution of micromotion to chronic neurodegeneration operates through different mechanisms than those suggested here.
Another potential source of tissue deformation is through aggressive electrical stimulation paradigms. It is well known that stimuli >+1.5V are outside the water window and cause electrolysis of water into O2 and H2 gas as well as pH excursions [76–81]. While it has long been speculated that such gas evolution could create local pressure and deformation of tissue, there have been few publications that explore this in vivo [82]. Using the methods described in this work, we explored this theory with in vivo GCaMP imaging. We examined current-controlled stimulation through high impedance electrode sites (Figure 8A), which can lead to voltage excursions outside of the water window even when safe Shannon Criteria is used k≪1.7 (k=0.55) [76–81]. We also tested “rejuvenation” stimulation, which employs a 1.5V DC bias for 4 s which is hypothesized to perforate the glial scar encapsulating the electrode site to restore neural recording capabilities of failed recording sites (Figure 8B) [41, 42]. Imaging GCaMP activity around the implant during these strong stimuli reveals formation of large gas bubbles (110.35μm diameter bubble for current-controlled stimulation, 37.14μm for the “rejuvenation stimulation) that generate mechanical strain to the local tissue (Figure 8A–B). There is an initial depolarization of sparse and distributed population of neural depolarization [83]. However, as the stimulus continues, a gas bubble forms around the electrode site. The growing gas bubble, in turn, pushes the nearby tissue away generating mechanical strain. Neurons within 50μm of the electrode site were displaced 9.0 5±1.12 μm (mean ± SEM; n = 11 neurons) during current-controlled stimulation. Cell-shape strain index (see Methods section 3.4.3.) of these same neurons increased 0.18 ± 0.076 (mean ± SEM). With the smaller gas bubble formed during “rejuvenation” stimulation, only one neuron was seen to be displaced (3.15μm; CSSI change = 0.08). Neurons in this strained region for both stimulation paradigms are activated. Most noticeably, neurons that were spontaneously firing prior to the stimulus ceased all activity following the stimulus (Figure 8A–B, > arrows). Other neurons near the electrode that were not spontaneously firing before the stimulus showed robust spontaneous firing 2 minutes following the recovery from the stimulus (Figure 8A–B, v arrows). It is unclear if this altered neuronal activity is due to intense electrical stimulation, tissue deformation by the microbubble, release of O2, H2, and change of pH, though each of these factors has the ability to modulate neuronal activity [82, 84]. Future studies should examine how the native neural networks are disrupted from these strong stimulus pulses. The present work suggests that care needs to be taken in selecting stimulation parameters that do not disrupt the local functional neural network.
Figure 8.
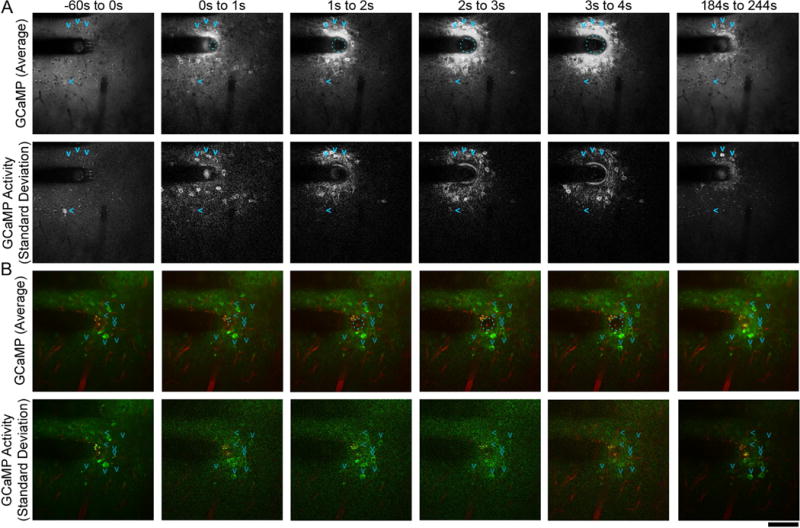
Gas evolution during stimulation alters resting state network activity. Gas evolution can be caused by 130 Hz current-controlled charge balanced asymmetric electrical stimulation with a Shannon k value of 0.55 (A) as well as monopolar 4s +1.5V ‘Rejuvenation’ electrical stimulation(B). Average GCaMP activity (top) and standard deviation of activity (bottom) projections across frames in the designated time periods show evolution of a gas bubble during stimulation (cyan dashed circle). The gas bubble deformed neurons, which showed sustained Ca++ influx with oscillatory behavior (standard deviation projection). GCaMP signal reduced after stimulation (184s to 244s), but still remained elevated relative to surrounding tissue. Some neurons (>; right arrow) were spontaneously firing before the stimulus ceased activity following gas evolution. In addition, other neurons (v; down arrows) that were quiescent prior to the stimulus began spontaneously firing following the gas evolution. Scale bar = 100 μm.
5.5. Future directions: new therapeutic avenues
The above results identify three related mechanisms that may explain how the mechanical trauma of electrode implantation leads to neuron loss and neural signal decline: prolonged high intracellular Ca++ levels, mechanoporation, and axonal cytoskeletal injury. The true impact of these phenomena will not be understood until studies are conducted with controlled interventions that modulate these damage patterns. Potential interventions for high Ca++ levels could be pre-incubation with Ca++ chelators such as EGTA [31], blockade of Na+ and Ca++ channels[33], or blocking the GluN2B subunit on NMDA receptors[61]. Mechanoporation can potentially be reduced by application of ‘membrane sealants’ such as polyethylene glycol [85, 86] or poloxamers [87]. Axonal cytoskeleton can be stabilized by selectively inhibiting the Ca++ activated protease calpain [31] or injection of the microtubule stabilizer paclitaxel [60]. One other strategy to address each of these issues is simply to reduce the mechanical trauma of implantation. This can be accomplished by altering the speed of insertion as well as the material, shape, and size of the device [63]. Reducing the overall volumetric footprint of the device reduces the tissue displacement during insertion resulting from the tissue accepting the probe’s volume [88–91].
While these strategies may spare many neurons and neurites from degeneration, the inherent trauma of neural electrode implantation is likely to still damage neural tissue. Therapies should also be focused on neural regeneration. Some approaches involve stem cell delivery to the implant site [92, 93] and encouraging neurite regrowth and neuronal survival through immobilized L1 cell adhesion molecule [25, 66, 94, 95], or neural protective drug release [96–101].
6. Conclusion
Using longitudinal, in vivo microscopy, we have for the first time identified sustained, high Ca++ levels in neuronal somas and neurites following electrode implantation. This is correlated with and potentially caused by mechanical distortion of somas and neurites as well as cell membrane disruption. Ca++-laden neurites develop spherical ‘blebs’ over the first hours post-implant, suggesting disruption in axonal transport and axonal damage. We ultimately show that healthy Ca++ activity increases over the first month post-implant, suggesting that neurons are repairing and potentially rewiring following implantation trauma. These results ultimately identify early damage patterns after neural electrode implant that may be promising therapeutic avenues to improve the long-term viability of implantable neural technologies.
Supplementary Material
Acknowledgments
This project was financially supported by NIH NINDS (Grant R01NS062019, 1R01NS094396, R01NS089688, 1R01094404). The authors would like to thank Vivek Jayaraman, Rex A. Kerr, Douglas S. Kim, Loren L. Looger and Karel Svoboda from the GENIE Project, Janelia Farm Research Campus (Howard Hughes Medical Institute) for generously allowing the use of GCaMP constructs. The authors would also like to thank Kip A. Ludwig for valuable discussions.
Footnotes
Publisher's Disclaimer: This is a PDF file of an unedited manuscript that has been accepted for publication. As a service to our customers we are providing this early version of the manuscript. The manuscript will undergo copyediting, typesetting, and review of the resulting proof before it is published in its final citable form. Please note that during the production process errors may be discovered which could affect the content, and all legal disclaimers that apply to the journal pertain.
Data availability: The raw/processed data required to reproduce these findings cannot be shared at this time as the data also forms part of an ongoing study.
References
- 1.Schwartz AB. Cortical neural prosthetics. Annual review of neuroscience. 2004;27:487–507. doi: 10.1146/annurev.neuro.27.070203.144233. [DOI] [PubMed] [Google Scholar]
- 2.Schwartz AB, Cui XT, Weber DJ, Moran DW. Brain-controlled interfaces: movement restoration with neural prosthetics. Neuron. 2006;52:205–20. doi: 10.1016/j.neuron.2006.09.019. [DOI] [PubMed] [Google Scholar]
- 3.Kipke DR, Shain W, Buzsaki G, Fetz E, Henderson JM, Hetke JF, Schalk G. Advanced Neurotechnologies for Chronic Neural Interfaces: New Horizons and Clinical Opportunities. Journal of Neuroscience. 2008;28:11830–11838. doi: 10.1523/JNEUROSCI.3879-08.2008. [DOI] [PMC free article] [PubMed] [Google Scholar]
- 4.Brandman DM, Cash SS, Hochberg LR. Review: Human Intracortical recording and neural decoding for brain-computer interfaces. IEEE Trans Neural Syst Rehabil Eng. 2017 doi: 10.1109/TNSRE.2017.2677443. [DOI] [PMC free article] [PubMed] [Google Scholar]
- 5.Iordanova B, Vazquez AL, Kozai TDY, Fukuda M, Kim SG. Optogenetic investigation of the variable neurovascular coupling along the interhemispheric circuits. Journal of Cerebral Blood Flow & Metabolism. 2018;38(4):627–640. doi: 10.1177/0271678X18755225. [DOI] [PMC free article] [PubMed] [Google Scholar]
- 6.McConnell GC, Rees HD, Levey AI, Gutekunst CA, Gross RE, Bellamkonda RV. Implanted neural electrodes cause chronic, local inflammation that is correlated with local neurodegeneration. Journal of neural engineering. 2009;6:056003. doi: 10.1088/1741-2560/6/5/056003. [DOI] [PubMed] [Google Scholar]
- 7.Potter KA, Buck AC, Self WK, Capadona JR. Stab injury and device implantation within the brain results in inversely multiphasic neuroinflammatory and neurodegenerative responses. J Neural Eng. 2012;9(4):046020. doi: 10.1088/1741-2560/9/4/046020. [DOI] [PubMed] [Google Scholar]
- 8.Biran R, Martin DC, Tresco PA. Neuronal cell loss accompanies the brain tissue response to chronically implanted silicon microelectrode arrays. Experimental Neurology. 2005;195:115–126. doi: 10.1016/j.expneurol.2005.04.020. [DOI] [PubMed] [Google Scholar]
- 9.Ravikumar M, Sunil S, Black J, Barkauskas DS, Haung AY, Miller RH, Selkirk SM, Capadona JR. The roles of blood-derived macrophages and resident microglia in the neuroinflammatory response to implanted intracortical microelectrodes. Biomaterials. 2014;35:8049–64. doi: 10.1016/j.biomaterials.2014.05.084. [DOI] [PMC free article] [PubMed] [Google Scholar]
- 10.Wellman SM, Kozai TDY. Understanding the Inflammatory Tissue Reaction to Brain Implants To Improve Neurochemical Sensing Performance. ACS Chemical Neuroscience. 2017 doi: 10.1021/acschemneuro.7b00403. [DOI] [PMC free article] [PubMed] [Google Scholar]
- 11.Kozai TDY, Jaquins-Gerstl A, Vazquez AL, Michael AC, Cui XT. Brain Tissue Responses to Neural Implants Impact Signal Sensitivity and Intervention Strategies. ACS Chemical Neuroscience. 2015;6(1):48–67. doi: 10.1021/cn500256e. [DOI] [PMC free article] [PubMed] [Google Scholar]
- 12.Kozai TDY, Gugel Z, Li X, Gilgunn PJ, Khilwani R, Ozdoganlar OB, Fedder GK, Weber DJ, Cui XT. Chronic tissue response to carboxymethyl cellulose based dissolvable insertion needle for ultra-small neural probes. Biomaterials. 2014;35(34):9255–68. doi: 10.1016/j.biomaterials.2014.07.039. [DOI] [PubMed] [Google Scholar]
- 13.Wellman SM, Kozai TDY. In vivo spatiotemporal dynamics of NG2 glia activity caused by neural electrode implantation. Biomaterials. 2018;164:121–133. doi: 10.1016/j.biomaterials.2018.02.037. [DOI] [PMC free article] [PubMed] [Google Scholar]
- 14.Buzsáki G. Large-scale recording of neuronal ensembles. Nature Neuroscience. 2004;7:446–451. doi: 10.1038/nn1233. [DOI] [PubMed] [Google Scholar]
- 15.Buzsáki G, Anastassiou CA, Koch C. The origin of extracellular fields and currents — EEG, ECoG, LFP and spikes. Nature Reviews Neuroscience. 2012;13:407–420. doi: 10.1038/nrn3241. [DOI] [PMC free article] [PubMed] [Google Scholar]
- 16.Henze DA, Borhegyi Z, Csicsvari J, Mamiya A, Harris KD, Buzsáki G. Intracellular Features Predicted by Extracellular Recordings in the Hippocampus In Vivo. Journal of Neurophysiology. 2000;84 doi: 10.1152/jn.2000.84.1.390. [DOI] [PubMed] [Google Scholar]
- 17.Kozai TDY, Li X, Bodily LM, Caparosa EM, Zenonos GA, Carlisle DL, Friedlander RM, Cui XT. Effects of caspase-1 knockout on chronic neural recording quality and longevity: insight into cellular and molecular mechanisms of the reactive tissue response. Biomaterials. 2014;35:9620–34. doi: 10.1016/j.biomaterials.2014.08.006. [DOI] [PMC free article] [PubMed] [Google Scholar]
- 18.Kozai TDY, Du Z, Gugel ZV, Smith MA, Chase SM, Bodily LM, Caparosa EM, Friedlander RM, Cui XT. Comprehensive chronic laminar single-unit, multi-unit, and local field potential recording performance with planar single shank electrode arrays. Journal of Neuroscience Methods. 2015;242(1):15–40. doi: 10.1016/j.jneumeth.2014.12.010. [DOI] [PMC free article] [PubMed] [Google Scholar]
- 19.Rousche PJ, Normann RA. Chronic recording capability of the Utah Intracortical Electrode Array in cat sensory cortex. J Neurosci Methods. 1998;82(1):1–15. doi: 10.1016/s0165-0270(98)00031-4. [DOI] [PubMed] [Google Scholar]
- 20.Chestek CA, Gilja V, Nuyujukian P, Foster JD, Fan JM, Kaufman MT, Churchland MM, Rivera-Alvidrez Z, Cunningham JP, Ryu SI, Shenoy KV. Long-term stability of neural prosthetic control signals from silicon cortical arrays in rhesus macaque motor cortex. Journal of neural engineering. 2011;8:045005. doi: 10.1088/1741-2560/8/4/045005. [DOI] [PMC free article] [PubMed] [Google Scholar]
- 21.Barrese JC, Rao N, Paroo K, Triebwasser C, Vargas-Irwin C, Franquemont L, Donoghue JP. Failure mode analysis of silicon-based intracortical microelectrode arrays in non-human primates. Journal of neural engineering. 2013;10:066014. doi: 10.1088/1741-2560/10/6/066014. [DOI] [PMC free article] [PubMed] [Google Scholar]
- 22.Salatino JW, Ludwig KA, Kozai TDY, Purcell EK. Glial responses to implanted electrodes in the brain. Nature Biomedical Engineering. 2017;1(11):862–877. doi: 10.1038/s41551-017-0154-1. [DOI] [PMC free article] [PubMed] [Google Scholar]
- 23.Salatino JW, Winter BM, Drazin MH, Purcell EK. Functional remodeling of subtype-specific markers surrounding implanted neuroprostheses. J Neurophysiol. 2017;118(1):194–202. doi: 10.1152/jn.00162.2017. [DOI] [PMC free article] [PubMed] [Google Scholar]
- 24.Michelson NJ, Vazquez AL, Eles JR, Salatino JW, Purcell EK, Williams JJ, Cui XT, Kozai TDY. Multi-scale, multi-modal analysis uncovers complex relationship at the brain tissue-implant neural interface: New Emphasis on the Biological Interface. Journal of Neural Engineering. 2018;15(033001) doi: 10.1088/1741-2552/aa9dae. [DOI] [PMC free article] [PubMed] [Google Scholar]
- 25.Eles JR, Vazquez AL, Snyder NR, Lagenaur CF, Murphy MC, Kozai TDY, Cui XT. Neuroadhesive L1 coating attenuates acute microglial attachment to neural electrodes as revealed by live two-photon microscopy. Biomaterials. 2017;113:279–292. doi: 10.1016/j.biomaterials.2016.10.054. [DOI] [PMC free article] [PubMed] [Google Scholar]
- 26.Kozai TDY, Vazquez AL, Weaver CL. In vivo two-photon microscopy reveals immediate microglial reaction to implantation of microelectrode through. Journal of neural engineering. 2012;9 doi: 10.1088/1741-2560/9/6/066001. [DOI] [PMC free article] [PubMed] [Google Scholar]
- 27.Karumbaiah L, Saxena T, Carlson D, Patil K, Patkar R, Gaupp EA, Betancur M, Stanley GB, Carin L, Bellamkonda RV. Relationship between intracortical electrode design and chronic recording function. Biomaterials. 2013;34:8061–8074. doi: 10.1016/j.biomaterials.2013.07.016. [DOI] [PubMed] [Google Scholar]
- 28.Kozai TDY, Jaquinsgerstl AS, Vazquez AL, Michael AC, Cui XT. Dexamethasone retrodialysis attenuates microglial response to implanted probes in vivo. Biomaterials. 2016;87:157–169. doi: 10.1016/j.biomaterials.2016.02.013. [DOI] [PMC free article] [PubMed] [Google Scholar]
- 29.Dana H, Chen TW, Hu A, Shields BC, Guo C, Looger LL, Kim DS, Svoboda K. Thy1-GCaMP6 transgenic mice for neuronal population imaging in vivo. PLoS One. 2014;9(9):e108697. doi: 10.1371/journal.pone.0108697. [DOI] [PMC free article] [PubMed] [Google Scholar]
- 30.Zündorf G, Reiser G. Calcium Dysregulation and Homeostasis of Neural Calcium in the Molecular Mechanisms of Neurodegenerative Diseases Provide Multiple Targets for Neuroprotection. Antioxidants & Redox Signaling. 2011;14(7):1275–1288. doi: 10.1089/ars.2010.3359. [DOI] [PMC free article] [PubMed] [Google Scholar]
- 31.Williams PR, Marincu BN, Sorbara CD, Mahler CF, Schumacher AM, Griesbeck O, Kerschensteiner M, Misgeld T. A recoverable state of axon injury persists for hours after spinal cord contusion in vivo. Nat Commun. 2014;5:5683. doi: 10.1038/ncomms6683. [DOI] [PubMed] [Google Scholar]
- 32.Maxwell WL, Povlishock JT, Graham DL. A mechanistic analysis of nondisruptive axonal injury: a review. J Neurotrauma. 1997;14(7):419–40. doi: 10.1089/neu.1997.14.419. [DOI] [PubMed] [Google Scholar]
- 33.Wolf JA, Stys PK, Lusardi T, Meaney D, Smith DH. Traumatic axonal injury induces calcium influx modulated by tetrodotoxin-sensitive sodium channels. J Neurosci. 2001;21(6):1923–30. doi: 10.1523/JNEUROSCI.21-06-01923.2001. [DOI] [PMC free article] [PubMed] [Google Scholar]
- 34.Deng Y, Kim B, He X, Kim S, Lu C, Wang H, Cho SG, Hou Y, Li J, Zhao X, Lu QR. Direct Visualization of Membrane Architecture of Myelinating Cells in Transgenic Mice Expressing Membrane-Anchored EGFP. Genesis (New York, NY : 2000) 2014;52(4):341–349. doi: 10.1002/dvg.22751. [DOI] [PMC free article] [PubMed] [Google Scholar]
- 35.Feng G, Mellor RH, Bernstein M, Keller-Peck C, Nguyen QT, Wallace M, Nerbonne JM, Lichtman JW, Sanes JR. Imaging neuronal subsets in transgenic mice expressing multiple spectral variants of GFP. Neuron. 2000;28(1):41–51. doi: 10.1016/s0896-6273(00)00084-2. [DOI] [PubMed] [Google Scholar]
- 36.Bjornsson CS, Oh SJ, Al-Kofahi YA, Lim YJ, Smith KL, Turner JN, De S, Roysam B, Shain W, Kim SJ. Effects of insertion conditions on tissue strain and vascular damage during neuroprosthetic device insertion. Journal of neural engineering. 2006;3:196–207. doi: 10.1088/1741-2560/3/3/002. [DOI] [PubMed] [Google Scholar]
- 37.Andrei A, Welkenhuysen M, Nuttin B, Eberle W. A response surface model predicting the in vivo insertion behavior of micromachined neural implants. Journal of Neural Engineering. 2012;9:016005. doi: 10.1088/1741-2560/9/1/016005. [DOI] [PubMed] [Google Scholar]
- 38.Roth TL, Nayak D, Atanasijevic T, Koretsky AP, Latour LL, McGavern DB. Transcranial amelioration of inflammation and cell death after brain injury. Nature. 2014;505:223–8. doi: 10.1038/nature12808. [DOI] [PMC free article] [PubMed] [Google Scholar]
- 39.Kozai TDY, Eles JR, Vazquez AL, Cui XT. Two-photon imaging of chronically implanted neural electrodes: Sealing methods and new insights. Journal of Neuroscience Methods. 2016;258:46–55. doi: 10.1016/j.jneumeth.2015.10.007. [DOI] [PMC free article] [PubMed] [Google Scholar]
- 40.Iordanova B, Vazquez AL, Poplawsky AJ, Fukuda M, Kim SG. Neural and hemodynamic responses to optogenetic and sensory stimulation in the rat somatosensory cortex. J Cereb Blood Flow Metab. 2015;35(6):922–32. doi: 10.1038/jcbfm.2015.10. [DOI] [PMC free article] [PubMed] [Google Scholar]
- 41.Otto KJ, Johnson MD, Kipke DR. Voltage pulses change neural interface properties and improve unit recordings with chronically implanted microelectrodes. Ieee T Bio-Med Eng. 2006;53(2):333–340. doi: 10.1109/TBME.2005.862530. [DOI] [PubMed] [Google Scholar]
- 42.Johnson MD, Otto KJ, Kipke DR. Repeated Voltage Biasing Improves Unit Recordings by Reducing Resistive Tissue Impedances. IEEE Transactions on Neural Systems and Rehabilitation Engineering. 2005;13(2):160–165. doi: 10.1109/TNSRE.2005.847373. [DOI] [PubMed] [Google Scholar]
- 43.Saalfeld S. Interactive Stack Rotation. 2010 [Google Scholar]
- 44.Du ZJ, Kolarcik CL, Kozai TDY, Luebben SD, Sapp SA, Zheng XS, Nabity JA, Cui XT. Ultrasoft microwire neural electrodes improve chronic tissue integration. Acta Biomater. 2017;53:46–58. doi: 10.1016/j.actbio.2017.02.010. [DOI] [PMC free article] [PubMed] [Google Scholar]
- 45.Bar-Kochba E, Scimone MT, Estrada JB, Franck C. Strain and rate-dependent neuronal injury in a 3D in vitro compression model of traumatic brain injury. Scientific Reports. 2016;6:30550. doi: 10.1038/srep30550. [DOI] [PMC free article] [PubMed] [Google Scholar]
- 46.Canty AJ, Teles-Grilo Ruivo LM, Nesarajah C, Song S, Jackson JS, Little GE, De Paola V. Synaptic elimination and protection after minimal injury depend on cell type and their prelesion structural dynamics in the adult cerebral cortex. J Neurosci. 2013;33(25):10374–83. doi: 10.1523/JNEUROSCI.0254-13.2013. [DOI] [PMC free article] [PubMed] [Google Scholar]
- 47.Michelson NJ, Vazquez AL, Eles JR, Salatino JW, Purcell EK, Williams JJ, Cui XT, Kozai TDY. Multi-scale, multi-modal analysis uncovers complex relationship at the brain tissue-implant neural interface: New Emphasis on the Biological Interface. Journal of Neural Engineering. 2017 doi: 10.1088/1741-2552/aa9dae. [DOI] [PMC free article] [PubMed] [Google Scholar]
- 48.Ridler T, Calvard S. Picture Thresholding Using an Iterative Selection Method. IEEE Transactions on Systems, Man, and Cybernetics. 1978;8:630–632. [Google Scholar]
- 49.Tibau E, Valencia M, Soriano J. Identification of neuronal network properties from the spectral analysis of calcium imaging signals in neuronal cultures. Frontiers in Neural Circuits. 2013;7:199. doi: 10.3389/fncir.2013.00199. [DOI] [PMC free article] [PubMed] [Google Scholar]
- 50.Uhlen P. Spectral analysis of calcium oscillations. Science’s STKE : signal transduction knowledge environment. 2004;2004(258):pl15. doi: 10.1126/stke.2582004pl15. [DOI] [PubMed] [Google Scholar]
- 51.Farkas E, Pratt R, Sengpiel F, Obrenovitch TP. Direct, live imaging of cortical spreading depression and anoxic depolarisation using a fluorescent, voltage-sensitive dye. J Cereb Blood Flow Metab. 2008;28(2):251–62. doi: 10.1038/sj.jcbfm.9600569. [DOI] [PMC free article] [PubMed] [Google Scholar]
- 52.Patel TP, Ventre SC, Meaney DF. Dynamic changes in neural circuit topology following mild mechanical injury in vitro. Ann Biomed Eng. 2012;40(1):23–36. doi: 10.1007/s10439-011-0390-6. [DOI] [PMC free article] [PubMed] [Google Scholar]
- 53.Prado GR, Ross JD, DeWeerth SP, LaPlaca MC. Mechanical trauma induces immediate changes in neuronal network activity. J Neural Eng. 2005;2(4):148–58. doi: 10.1088/1741-2560/2/4/011. [DOI] [PubMed] [Google Scholar]
- 54.Chen Q, Cichon J, Wang W, Qiu L, Jin S, Lee R, Campbell Nolan R, DeStefino N, Goard Michael J, Fu Z, Yasuda R, Looger Loren L, Arenkiel Benjamin R, Gan W-B, Feng G. Imaging Neural Activity Using Thy1-GCaMP Transgenic Mice. Neuron. 2012;76(2):297–308. doi: 10.1016/j.neuron.2012.07.011. [DOI] [PMC free article] [PubMed] [Google Scholar]
- 55.Tian L, Hires SA, Mao T, Huber D, Chiappe ME, Chalasani SH, Petreanu L, Akerboom J, McKinney SA, Schreiter ER, Bargmann CI, Jayaraman V, Svoboda K, Looger LL. Imaging neural activity in worms, flies and mice with improved GCaMP calcium indicators. Nature methods. 2009;6(12):875–881. doi: 10.1038/nmeth.1398. [DOI] [PMC free article] [PubMed] [Google Scholar]
- 56.Geddes DM, Cargill RS, 2nd, LaPlaca MC. Mechanical stretch to neurons results in a strain rate and magnitude-dependent increase in plasma membrane permeability. J Neurotrauma. 2003;20(10):1039–49. doi: 10.1089/089771503770195885. [DOI] [PubMed] [Google Scholar]
- 57.Whalen MJ, Dalkara T, You Z, Qiu J, Bermpohl D, Mehta N, Suter B, Bhide PG, Lo EH, Ericsson M, Moskowitz MA. Acute plasmalemma permeability and protracted clearance of injured cells after controlled cortical impact in mice. Journal of cerebral blood flow and metabolism : official journal of the International Society of Cerebral Blood Flow and Metabolism. 2008;28(3):490–505. doi: 10.1038/sj.jcbfm.9600544. [DOI] [PMC free article] [PubMed] [Google Scholar]
- 58.Casanova F, Carney PR, Sarntinoranont M. In vivo evaluation of needle force and friction stress during insertion at varying insertion speed into the brain. Journal of Neuroscience Methods. 2014;237:79–89. doi: 10.1016/j.jneumeth.2014.08.012. [DOI] [PMC free article] [PubMed] [Google Scholar]
- 59.Tang-Schomer MD, Johnson VE, Baas PW, Stewart W, Smith DH. Partial interruption of axonal transport due to microtubule breakage accounts for the formation of periodic varicosities after traumatic axonal injury. Experimental neurology. 2012;213:364–372. doi: 10.1016/j.expneurol.2011.10.030. [DOI] [PMC free article] [PubMed] [Google Scholar]
- 60.Tang-Schomer MD, Patel AR, Baas PW, Smith DH. Mechanical breaking of microtubules in axons during dynamic stretch injury underlies delayed elasticity, micrtubule disassembly, and axon degeneration. The FASEB Journal. 2010;24:1401–1410. doi: 10.1096/fj.09-142844. [DOI] [PMC free article] [PubMed] [Google Scholar]
- 61.Patel TP, Ventre SC, Geddes-Klein D, Singh PK, Meaney DF. Single-Neuron NMDA Receptor Phenotype Influences Neuronal Rewiring and Reintegration following Traumatic Injury. The Journal of Neuroscience. 2014;34(12):4200–4213. doi: 10.1523/JNEUROSCI.4172-13.2014. [DOI] [PMC free article] [PubMed] [Google Scholar]
- 62.Johnson VE, Stewart W, Smith DH. Axonal Pathology in Traumatic Brain Injury. Experimental neurology. 2013;246:35–43. doi: 10.1016/j.expneurol.2012.01.013. [DOI] [PMC free article] [PubMed] [Google Scholar]
- 63.Wellman SM, Eles JR, Ludwig KA, Seymour JP, Michelson NJ, McFadden WE, Vazquez AL, Kozai TDY. A Materials Roadmap to Functional Neural Interface Design. Advanced Functional Materials. doi: 10.1002/adfm.201701269. 1701269-n/a. [DOI] [PMC free article] [PubMed] [Google Scholar]
- 64.Kramer DR, Fujii T, Ohiorhenuan I, Liu CY. Cortical spreading depolarization: Pathophysiology, implications, and future directions. Journal of clinical neuroscience : official journal of the Neurosurgical Society of Australasia. 2016;24:22–7. doi: 10.1016/j.jocn.2015.08.004. [DOI] [PubMed] [Google Scholar]
- 65.Degenhart AD, Eles J, Dum R, Mischel JL, Smalianchuk I, Endler B, Ashmore RC, Tyler-Kabara EC, Hatsopoulos NG, Wang W, Batista AP, Cui XT. Histological evaluation of a chronically-implanted electrocorticographic electrode grid in a non-human primate. Journal of neural engineering. 2016;13:046019. doi: 10.1088/1741-2560/13/4/046019. [DOI] [PMC free article] [PubMed] [Google Scholar]
- 66.Cody PA, Eles JR, Lagenaur CF, Kozai TD, Cui XT. Unique electrophysiological and impedance signatures between encapsulation types: An analysis of biological Utah array failure and benefit of a biomimetic coating in a rat model. Biomaterials. 2018;161:117–128. doi: 10.1016/j.biomaterials.2018.01.025. [DOI] [PMC free article] [PubMed] [Google Scholar]
- 67.Wellman SM, Eles JR, Ludwig KA, Seymour JP, Michelson NJ, McFadden WE, Vazquez AL, Kozai TD. A Materials Roadmap to Functional Neural Interface Design. Advanced Functional Materials. 2018;28(12):201701269. doi: 10.1002/adfm.201701269. [DOI] [PMC free article] [PubMed] [Google Scholar]
- 68.Kozai TDY, Marzullo TC, Hooi F, Langhals NB, Majewska AK, Brown EB, Kipke DR. Reduction of neurovascular damage resulting from microelectrode insertion into the cerebral cortex using in vivo two-photon mapping. Journal of neural engineering. 2010;7:046011. doi: 10.1088/1741-2560/7/4/046011. [DOI] [PMC free article] [PubMed] [Google Scholar]
- 69.Greer JE, Povlishock JT, Jacobs KM. Electrophysiological Abnormalities in both Axotomized and Nonaxotomized Pyramidal Neurons following Mild Traumatic Brain Injury. The Journal of Neuroscience. 2012;32(12):6682–6687. doi: 10.1523/JNEUROSCI.0881-12.2012. [DOI] [PMC free article] [PubMed] [Google Scholar]
- 70.Wright PW, Brier LM, Bauer AQ, Baxter GA, Kraft AW, Reisman MD, Bice AR, Snyder AZ, Lee JM, Culver JP. Functional connectivity structure of cortical calcium dynamics in anesthetized and awake mice. PLoS One. 2017;12(10):e0185759. doi: 10.1371/journal.pone.0185759. [DOI] [PMC free article] [PubMed] [Google Scholar]
- 71.Alwis DS, Yan EB, Morganti-Kossmann MC, Rajan R. Sensory cortex underpinnings of traumatic brain injury deficits. PLoS One. 2012;7(12):e52169. doi: 10.1371/journal.pone.0052169. [DOI] [PMC free article] [PubMed] [Google Scholar]
- 72.Cantu D, Walker K, Andresen L, Taylor-Weiner A, Hampton D, Tesco G, Dulla CG. Traumatic Brain Injury Increases Cortical Glutamate Network Activity by Compromising GABAergic Control. Cerebral cortex (New York, NY : 1991) 2015;25(8):2306–20. doi: 10.1093/cercor/bhu041. [DOI] [PMC free article] [PubMed] [Google Scholar]
- 73.Carron SF, Alwis DS, Rajan R. Traumatic Brain Injury and Neuronal Functionality Changes in Sensory Cortex. Frontiers in Systems Neuroscience. 2016;10(47) doi: 10.3389/fnsys.2016.00047. [DOI] [PMC free article] [PubMed] [Google Scholar]
- 74.Hall KD, Lifshitz J. Diffuse traumatic brain injury initially attenuates and later expands activation of the rat somatosensory whisker circuit concomitant with neuroplastic responses. Brain Res. 2010;1323:161–73. doi: 10.1016/j.brainres.2010.01.067. [DOI] [PMC free article] [PubMed] [Google Scholar]
- 75.Sridharan A, Rajan SD, Muthuswamy J. Long-term changes in the material properties of brain tissue at the implant–tissue interface. Journal of Neural Engineering. 2013;10:066001. doi: 10.1088/1741-2560/10/6/066001. [DOI] [PMC free article] [PubMed] [Google Scholar]
- 76.Kozai TDY, Vazquez AL. Photoelectric artefact from optogenetics and imaging on microelectrodes and bioelectronics: New Challenges and Opportunities. Journal of Materials Chemistry. 2015;B3:4965–4978. doi: 10.1039/C5TB00108K. [DOI] [PMC free article] [PubMed] [Google Scholar]
- 77.Kozai TDY, Alba NA, Zhang H, Kotov NA, Gaunt RA, Cui XT. Nanostructured Coatings for Improved Charge Delivery to Neurons. In: De Vittorio M, Martiradonna L, Assad J, editors. Nanotechnology and Neuroscience: Nano-electronic, Photonic and Mechanical Neuronal Interfacing. Springer New York; New York, NY: 2014. pp. 71–134. [Google Scholar]
- 78.Cogan SF, Ludwig KA, Welle CG, Takmakov P. Tissue damage thresholds during therapeutic electrical stimulation. Journal of Neural Engineering. 2016;13(2):021001. doi: 10.1088/1741-2560/13/2/021001. [DOI] [PMC free article] [PubMed] [Google Scholar]
- 79.Merrill DR, Bikson M, Jefferys JG. Electrical stimulation of excitable tissue: design of efficacious and safe protocols. Journal of Neuroscience Methods. 2005;141(2):171–98. doi: 10.1016/j.jneumeth.2004.10.020. [DOI] [PubMed] [Google Scholar]
- 80.Cogan SF, Guzelian AA, Agnew WF, Yuen TG, McCreery DB. Over-pulsing degrades activated iridium oxide films used for intracortical neural stimulation. Journal of Neuroscience Methods. 2004;137(2):141–50. doi: 10.1016/j.jneumeth.2004.02.019. [DOI] [PubMed] [Google Scholar]
- 81.Huang CQ, Carter PM, Shepherd RK. Stimulus induced pH changes in cochlear implants: an in vitro and in vivo study. Ann Biomed Eng. 2001;29(9):791–802. doi: 10.1114/1.1397793. [DOI] [PubMed] [Google Scholar]
- 82.Merrill DR, Bikson M, Jefferys JG. Electrical stimulation of excitable tissue: design of efficacious and safe protocols. J Neurosci Methods. 2005;141(2):171–98. doi: 10.1016/j.jneumeth.2004.10.020. [DOI] [PubMed] [Google Scholar]
- 83.Histed MH, Bonin V, Reid RC. Direct activation of sparse, distributed populations of cortical neurons by electrical microstimulation. Neuron. 2009;63(4):508–22. doi: 10.1016/j.neuron.2009.07.016. [DOI] [PMC free article] [PubMed] [Google Scholar]
- 84.Sinning A, Hubner CA. Minireview: pH and synaptic transmission. FEBS letters. 2013;587(13):1923–8. doi: 10.1016/j.febslet.2013.04.045. [DOI] [PubMed] [Google Scholar]
- 85.Shi R. Polyethylene glycol repairs membrane damage and enhances functional recovery: a tissue engineering approach to spinal cord injury. Neuroscience Bulletin. 2013;29(4):460–466. doi: 10.1007/s12264-013-1364-5. [DOI] [PMC free article] [PubMed] [Google Scholar]
- 86.Smucker P, Hekmatyar SK, Bansal N, Rodgers RB, Shapiro SA, Borgens RB. Intravenous polyethylene glycol successfully treats severe acceleration-induced brain injury in rats as assessed by magnetic resonance imaging. Neurosurgery. 2009;64(5):984–90. doi: 10.1227/01.NEU.0000342406.43816.13. discussion 990. [DOI] [PubMed] [Google Scholar]
- 87.Moloughney JG, Weisleder N. Poloxamer 188 (P188) as a Membrane Resealing Reagent in Biomedical Applications. Recent patents on biotechnology. 2012;6(3):200–211. doi: 10.2174/1872208311206030200. [DOI] [PMC free article] [PubMed] [Google Scholar]
- 88.Kozai TDY, Catt K, Du Z, Na K, Srivannavit O, Haque RUM, Seymour J, Wise KD, Yoon E, Cui XT. Chronic In Vivo Evaluation of PEDOT/CNT for Stable Neural Recordings. IEEE transactions on bio-medical engineering. 2016;63:111–9. doi: 10.1109/TBME.2015.2445713. [DOI] [PMC free article] [PubMed] [Google Scholar]
- 89.Kozai TDY, Langhals NB, Patel PR, Deng X, Zhang H, Smith KL, Lahann J, Kotov NA, Kipke DR. Ultrasmall implantable composite microelectrodes with bioactive surfaces for chronic neural interfaces. Nat Mater. 2012;11(12):1065–73. doi: 10.1038/nmat3468. [DOI] [PMC free article] [PubMed] [Google Scholar]
- 90.Patel PR, Zhang H, Robbins MT, Nofar JB, Marshall SP, Kobylarek MJ, Kozai TDY, Kotov NA, Chestek CA. Chronic In Vivo Stability Assessment of Carbon Fiber Microelectrode Arrays. J Neural Eng. 2016;13(6):066002. doi: 10.1088/1741-2560/13/6/066002. [DOI] [PMC free article] [PubMed] [Google Scholar]
- 91.Patel PR, Na K, Zhang H, Kozai TDY, Kotov NA, Yoon E, Chestek CA. Insertion of linear 8.4 mu m diameter 16 channel carbon fiber electrode arrays for single unit recordings. Journal of Neural Engineering. 2015;12(4) doi: 10.1088/1741-2560/12/4/046009. [DOI] [PMC free article] [PubMed] [Google Scholar]
- 92.Purcell EK, Seymour JP, Yandamuri S, Kipke DR. In vivo evaluation of a neural stem cell-seeded prosthesis. Journal of neural engineering. 2009;6:026005. doi: 10.1088/1741-2560/6/2/026005. [DOI] [PMC free article] [PubMed] [Google Scholar]
- 93.Azemi E, Gobbel GT, Cui XT. Seeding neural progenitor cells on silicon-based neural probes. J Neurosurg. 2010;113(3):673–81. doi: 10.3171/2010.1.JNS09313. [DOI] [PubMed] [Google Scholar]
- 94.Azemi E, Lagenaur CF, Cui XT. The surface immobilization of the neural adhesion molecule L1 on neural probes and its effect on neuronal density and gliosis at the probe/tissue interface. Biomaterials. 2011;32:681–92. doi: 10.1016/j.biomaterials.2010.09.033. [DOI] [PMC free article] [PubMed] [Google Scholar]
- 95.Kolarcik CL, Bourbeau D, Azemi E, Rost E, Zhang L, Lagenaur CF, Weber DJ, Cui XT. In vivo effects of L1 coating on inflammation and neuronal health at the electrode-tissue interface in rat spinal cord and dorsal root ganglion. Acta biomaterialia. 2012;8:3561–75. doi: 10.1016/j.actbio.2012.06.034. [DOI] [PMC free article] [PubMed] [Google Scholar]
- 96.Luo X, Matranga C, Tan S, Alba N, Cui XT. Carbon nanotube nanoreservior for controlled release of anti-inflammatory dexamethasone. Biomaterials. 2011;32(26):6316–23. doi: 10.1016/j.biomaterials.2011.05.020. [DOI] [PMC free article] [PubMed] [Google Scholar]
- 97.Wadhwa R, Lagenaur CF, Cui XT. Electrochemically controlled release of dexamethasone from conducting polymer polypyrrole coated electrode. Journal of Controlled Release. 2006;110:531–541. doi: 10.1016/j.jconrel.2005.10.027. [DOI] [PubMed] [Google Scholar]
- 98.Weaver CL, LaRosa JM, Luo X, Cui XT. Electrically Controlled Drug Delivery from Graphene Oxide Nanocomposite Films. ACS Nano. 2014;8(2):1834–1843. doi: 10.1021/nn406223e. [DOI] [PMC free article] [PubMed] [Google Scholar]
- 99.Rennaker RL, Miller J, Tang H, Wilson DA. Minocycline increases quality and longevity of chronic neural recordings. J Neural Eng. 2007;4(2):L1–5. doi: 10.1088/1741-2560/4/2/L01. [DOI] [PMC free article] [PubMed] [Google Scholar]
- 100.Potter KA, Buck AC, Self WK, Callanan ME, Sunil S, Capadona JR. The effect of resveratrol on neurodegeneration and blood brain barrier stability surrounding intracortical microelectrodes. Biomaterials. 2013;34(29):7001–15. doi: 10.1016/j.biomaterials.2013.05.035. [DOI] [PubMed] [Google Scholar]
- 101.Zhong Y, Bellamkonda RV. Controlled release of anti-inflammatory agent alpha-MSH from neural implants. J Control Release. 2005;106(3):309–18. doi: 10.1016/j.jconrel.2005.05.012. [DOI] [PubMed] [Google Scholar]
Associated Data
This section collects any data citations, data availability statements, or supplementary materials included in this article.