Abstract
Objectives:
The aim of this systematic review with meta-analysis was to assess the accuracy and reproducibility of dental measurements obtained from digital study models generated from CBCT compared with those acquired from plaster models.
Methods:
The electronic databases Cochrane Library, Medline (via PubMed), Scopus, VHL, Web of Science, and System for Information on Grey Literature in Europe were screened to identify articles from 1998 until February 2016. The inclusion criteria were: prospective and retrospective clinical trials in humans; validation and/or comparison articles of dental study models obtained from CBCT and plaster models; and articles that used dental linear measurements as an assessment tool. The methodological quality of the studies was carried out by Quality Assessment of Diagnostic Accuracy Studies-2 (QUADAS-2) tool. A meta-analysis was performed to validate all comparative measurements.
Results:
The databases search identified a total of 3160 items and 554 duplicates were excluded. After reading titles and abstracts, 12 articles were selected. Five articles were included after reading in full. The methodological quality obtained through QUADAS-2 was poor to moderate. In the meta-analysis, there were statistical differences between the mesiodistal widths of mandibular incisors, maxillary canines and premolars, and overall Bolton analysis. Therefore, the measurements considered accurate were maxillary and mandibular crowding, intermolar width and mesiodistal width of maxillary incisors, mandibular canines and premolars, in both arches for molars.
Conclusions:
Digital models obtained from CBCT were not accurate for all measures assessed. The differences were clinically acceptable for all dental linear measurements, except for maxillary arch perimeter. Digital models are reproducible for all measurements when intraexaminer assessment is considered and need improvement in interexaminer evaluation.
Keywords: Orthodontics, cone-beam computed tomography, dental models
Introduction
Dental models are essential for performing dental analysis. Characteristics such as tooth size, overjet, overbite, crowding, arch discrepancy and Bolton analysis are fundamental in diagnosis and for successful treatment results.1–4 Furthermore, they are relevant for educational use, serve as documentation for orthodontic research5 and represent the legal document.6
Technological advancement has allowed the production of dental models in the digital format, which affects the orthodontic clinics7 by the current trend to replace the plaster models by three-dimensional (3D) digital models.5,8 However, their comparability to plaster models needs to be proved since the measurement procedure with digital caliper in plaster models is considered the gold standard or reference standard in orthodontic research.1,3,5,7,9–12 Plaster models also have advantages such as easy and low cost production.13
Since the introduction of digital models in 1990,14 studies have been extensively performed to investigate models obtained by laser scanning,3,7,12,15 holographic scanning,16,17 stereophotogrammetry,18 intraoral scanning19 and, most recently, CBCT.1,8,9,19–30
The use of such different types of digital models has increased due to their advantages over plaster models. They are not susceptible to physical damage or degradation, the digital archive facilitates communication between professionals and with patients, and eliminates the need and cost of physical space to store them.14,18,31,32 In addition, it is possible to perform virtual setups to simulate results of orthodontic treatment;32–35 apply qualitative-measures ordinal tests, as the indexes or orthodontic scales,13,14,23,32 and superimpose images to follow up progress and monitor treatment outcomes.36 Digital images of CBCT scan also add information, such as bone levels, root positions and the condition of the temporomandibular joint.37 However, it should be considered that these models omit the soft-tissue outline, therefore there is more information of hard tissue in comparison to plaster models. Furthermore, it is still questionable whether the use of software to perform measurements and calculations facilitates and accelerates the process of dental analysis.9,38
The main disadvantages of digital models are that their acquisition depends on a high-cost technology, although quickly evolving, and has limitations related to security and privacy, as well as to the risk of loss of electronically filed information.38
There is no consensus between systematic reviews on which types of digital models would be applicable in orthodontics. Two reviews evaluated the validity of digital models31,32 and two assessed the validity and reliability of these models.14,15 Numerous types of acquisition of digital models have been covered on the existing studies included on systematic reviews, and only one review individualized a type of acquisition of digital models to be evaluated.15 Studies evaluating measurements on digital models generated by CBCT scan were included in two reviews;14,15 however, there was no standardization in relation to how to obtain these models through tomography and what types of models were compared. These differences make it difficult to obtain a clear result with regard to accuracy and reproducibility of digital models.
Considering the technological development and increased use of CBCT in orthodontics, the production of digital models from the patient's CBCT scans was made possible,9,21,37 avoiding the acquisition of impressions and eliminating the disadvantages of this procedure.21,23,37 As a result of this technological progress, many studies have been conducted using digital models obtained from the patient's CBCT scan.1,8,9,20,22,25–30,39,40 However, no systematic review aimed at analyzing the accuracy and reproducibility of linear dental measurements in these models compared with plaster models. Possibly, this occurs because of occlusal distortions in dental models generated from CBCT scan and limitations that are associated with the individuals submitted to this examination. However, the constant technological evolution of CBCT may make it a single-examination diagnostic method.37
The terms accuracy and reproducibility were considered in this systematic review for the evaluation of measurements. Accuracy refers to the agreement between the values obtained on the index test and reference standard, and it can be replaced by the term validity. The term reproducibility refers to the precision of successive measurements on the same test.41,42
The purpose of this systematic review and meta-analysis was to assess the accuracy and reproducibility of linear dental measurements on digital study models generated from CBCT scan compared with plaster models.
Methods and materials
The report of this systematic review was based on the guidelines and directives of the Preferred Reporting Items for Systematic Reviews and Meta-Analyses: the PRISMA statement.43 The protocol was registered in the PROSPERO database under the number CRD42015029859 (http://www.crd.york.ac.uk/PROSPERO).
The selection of keywords for the electronic search and the eligibility criteria were based on the following question elaborated with the PICO/PECO format: in orthodontic patients' (P), CBCT scans (E) are dental linear measurements performed on digital study models generated from those examinations compared with the same measurements on plaster models (C) accurate and reproducible (O)?
The following were the criteria for inclusion of eligible studies: (1) prospective and retrospective clinical trials in humans, (2) validation and/or comparison articles of dental study models generated from CBCT scans and plaster models and (3) articles that assessed accuracy and/or reproducibility of dental linear measurements between dental study models generated from patient's CBCT scan and plaster models. The following were the criteria for exclusion: (1) animal studies, (2) in vitro studies, (3) case reports, (4) case series, (5) review articles, (6) opinion articles, (7) editorials, (8) books, (9) technical articles and (10) articles with measurements in direct images of CBCT without obtaining the digital dental study models.
The literature search to identify studies was conducted through electronic search in the following databases: Medline database (via PubMed), Scopus, Web of Science, VHL, Cochrane Library and System for Information on Grey Literature in Europe. Search strategies for each base were prepared with the help and guidance of a librarian using keywords and free terms related to the subject of research to reach the largest number of articles related to the review question. There were no restrictions for language. The search strategy for Medline database is provided in Table 1. This filter was applied due to the development of CBCT in 1998.44
Table 1.
Search strategy for Medline database (via PubMed)
| Medline | (((((((((Orthodontics[MeSH Terms]) OR Odontometry[MeSH Terms]) OR “Dental Arch”[MeSH Terms]) OR Orthodontic[Title/Abstract]) OR Odontometry[Title/Abstract]) OR Skulls[Title/Abstract]) OR Teeth[Title/Abstract])) AND ((((((“Cone-Beam Computed Tomography”[MeSH Terms]) OR “Imaging, Three-Dimensional”[MeSH Terms]) OR “Cone-Beam Computed Tomography”[Title/Abstract]) OR “Three-Dimensional Imaging”[Title/Abstract]) OR CBCT[Title/Abstract]) OR 3D[Title/Abstract])) AND (((((((((“Dental Models”[MeSH Terms]) OR “Image Processing, Computer-assisted”[MeSH Terms]) OR “Dental Models”[Title/Abstract]) OR “Dental Casts”[Title/Abstract]) OR “Digital Models”[Title/Abstract]) OR “Digital Model”[Title/Abstract]) OR “Study Models”[Title/Abstract]) OR “Virtual Models”[Title/Abstract]) OR “Plaster Models”[Title/Abstract]) |
Duplicate articles were eliminated after the final result of the search. Then, the titles and abstracts were read independently by two reviewers and the articles that met the inclusion criteria were selected for reading in full. When the title and abstract did not provide sufficient information for eligibility, the research was also examined in full. A manual search was conducted in the references of the selected articles to identify possible relevant titles not found by electronic search. Disagreements between the two reviewers were resolved by a third reviewer in consensus meeting.
The methodological quality of the selected studies was evaluated by two reviewers, through the Quality Assessment of Diagnostic Accuracy Studies checklist (QUADAS-2),45,46 using the Review Manager software v. 5.3 (Copenhagen: The Nordic Cochrane Centre, The Cochrane Collaboration, 2014).
QUADAS-2 consists of two main topics for analysis: “Risk of bias” and “Concerns regarding applicability”. From these topics, the following domains are filled for each study: patient selection, index test, reference standard, and flow and timing.
The evaluator can formulate new questions or remove existing questions. Then, the question “If a threshold was used, was it prespecified?” was excluded from the second domain (index test), and five others questions were added to the same domain to extract additional data for the assessment of studies: was the field of view described; was the CBCT scanner described; was the voxel size described; was the type of software for models acquisition described; was the type of software for models measurements described? (Appendix A).
Each study was assigned “yes”, “no” or “unclear” for each question. The risk of bias was judged as low when all questions of each domain were answered “yes”. A potential risk of bias was assigned when any question was answered “no”. The “unclear” category was used when insufficient data prevented judgement.
In this systematic review, we set that values >0.5 mm would be clinically significant for mean differences of mesiodistal tooth width and transversal widths, and >2.0 mm for sums of measurements.4,47
Data were extracted from selected articles and organized in tables, according to the following aspects: author and year of publication, sample size, characteristics of participants, index test, reference standard, numbers of examiners, readings per examiner, measurements and findings.
The meta-analysis was performed gathering studies which validated the measurements of crowding in dental arch, intermolar width, Bolton discrepancy and mesiodistal tooth width in different subgroups. The mean difference was presented subtracting the measurements of plaster models from the measurements of the digital models generated from CBCT scan in all studies. The data were assessed in the Comprehensive Meta-Analysis software v. 3.2.00089 (Biostat Inc., Englewood, New Jersey,USA) with the random effects 4 model, and the heterogeneity among studies was tested through Q-value, I2 index and tau.2 When the p-value was <0.05, differences were considered statistically significant. When the heterogeneity was high, a sensitivity analysis was performed.
Results
Study selection
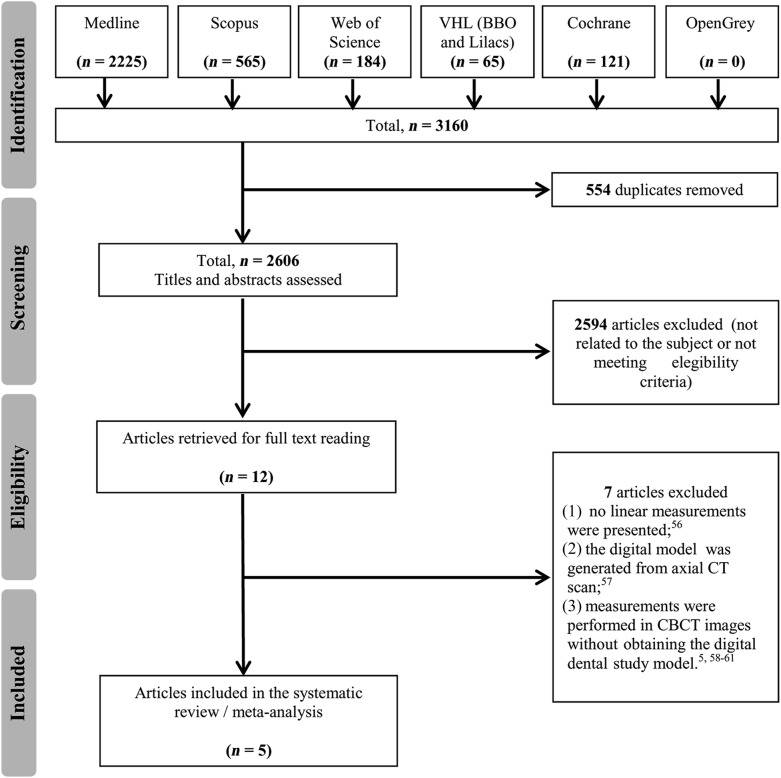
The search of all databases provided a total of 3160 studies. The duplicates were removed and 2606 titles and abstracts were read, and 12 included studies met the eligibility criteria. After full text reading, seven articles were excluded for the following reasons: (1) no linear measurements were presented;48 (2) the digital models was generated from the axial CT scan;49 (3) measurements were performed in CBCT images without obtaining the digital dental study models.2,50–53 A flow diagram describing the selection process and the results is illustrated in Figure 1. No article was found in the manual search. To clarify doubts about the digital model generation, the authors were contacted50,53 with no success.
Figure 1.
Flow diagram of selected studies (Preferred Reporting Items for Systematic Reviews and Meta-Analyses). BBO, Brazilian Dentistry Bibliography; LILACS, Latin American and Caribbean Health Sciences Literature; VHL, Virtual Health Library.
Study characteristics
The selected studies were conducted in Republic of Korea,25 China,26 USA1,9 and Canada.8 Three studies were published in English,1,8,9 one was published in Korean and the last one in Chinese.25,26
Five comparative articles were found as a result of the systematic literature search and eligibility criteria.1,8,9,25,26 All of them included dental linear measurements comparing the investigated methods, and samples of the dental plaster models and models generated directly from patient's CBCT scans. The latter were reported as digital imaging and communications in medicine files,8,26 STL files1,26 or not specified.9,25
The sample size ranged from 20 upper models to 30 sets of models. All selected studies presented a sample of orthodontic patients with permanent dentition. One study26 included patients with crowding up to 5 mm, and the other two studies1,25 excluded dentition with metal restorations that damaged the image quality. All studies presented CBCT scans with a voxel size of 0.3 × 0.3 × 0.3 mm.1,8,9,25,26
All five selected studies assessed the accuracy and intraexaminer reproducibility,1,8,9,25,26 and three studies evaluated the interexaminer reproducibility1,8,9 of linear measurements. Four digital model systems were assessed in the studies: Accurex,25 Mimics,26 Rapidiform1 and Anatomodels.8,9 The number of examiners that performed the measurements ranged between one and five, and the number of reading repetitions were not uniform between the studies. The data extracted from individual studies was presented in Table 2.
Table 2.
Data extracted from studies included
| Author, year | Sample size | Characteristics of participants | Index test/reference standard | Examiners (readings per examiner) | Measurements | Findings |
|---|---|---|---|---|---|---|
| Lim and Lim (2009)25 | 20 sets of models | Orthodontic patient. Permanent dentition with no interproximal metal restorations | Accurex/digital caliper | One examiner (repeated twice at 2-week intervals) | Maxillary and mandibular arch: tooth size (first molar to first molar), sum of anterior teeth, sum of all teeth, required space, available space, arch length discrepancy, intercanine width, intermolar width and Bolton discrepancy (anterior and overall) | CBCT images showed significantly smaller overall Bolton discrepancy measurements. The ranges of measurement errors of the digital models generated from CBCT were clinically acceptable. These models can be used for model analysis. |
| Lv et al (2012)26 | 20 upper models | Orthodontic patients with fully erupted permanent dentitions; crowding up to 5 mm | Mimics/digital caliper | One examiner (second measurement made 2 weeks later) | Tooth crown widths, dental arch width, dental arch length and crowding | The consistency of the results was high, and some differences were accepted clinically. Therefore, it is possible to substitute PM for digital models obtained from CBCT. The ICC from repeated measurements was <0.75. The measurements obtained from these digital models were smaller than on PM. |
| Akyalcin et al (2013)1 | 30 sets of models | Orthodontic patients between the ages of 14 and 30 years, and without metal restorations | Rapidiform/digital caliper | Two examiners working independently (repeated all measurements twice 3–4 weeks later) | Maxillary and mandibular arch length discrepancies (crowding) | The findings demonstrated that CBCT-generated models are not perfect yet: mean bias (−0.45 ± 1.10) and confidence interval (−2.65 to 1.74). The correlation between CBCT-generated models and PM is 0.85. |
| Grunheid et al (2014)9 | 30 upper models | Patients with a variety of typical malocclusions, fully erupted permanent dentitions including incisors, canines, premolars and first molars | Anatomodels/digital calipers | Three (second measurement made 3 weeks later in six cases randomly selected) | Mesiodistal tooth width | The bias, limit of agreement interval and mean squared error from repeatability comparisons of measurements performed on PM were 0.048 mm, 0.704 mm and 0.035 mm, respectively, and the values for their comparisons in digital models generated from CBCT were 0.06 mm, 0.987 mm and 0.063 mm. The bias, limit of agreement interval and mean squared error from comparison of measurements obtained from PM and digital models generated from CBCT were 0.191 mm, 1.521 mm and 0.181 mm, respectively. |
| Luu et al (2014)8 | 30 sets of models | Patients with fully erupted permanent dentition | Anatomodels/digital caliper | 5 (1 examiner repeated the measurements in 10 subjects 5 times at intervals of 10 days, with assessments limited to 5 cases per day) | Intermolar width, intercanine width, mesiodistal widths, arch perimeter, arch crowding, Bolton 6, Bolton 12, overbite and overjet | SMA using digital models obtained from CBCT was reliable but not always valid when compared with PM. The validity of measurements on digital models compared with PM showed low mean differences. The ICC demonstrated excellent intraexaminer reproducibility and good to excellent interexaminer reproducibility. |
CBCT, Cone Beam Computed Tomography; ICC, Intraclass Correlation Coefficient; PM, Plaster Model; SMA, Study Model Analysis.
Risk of bias of included studies
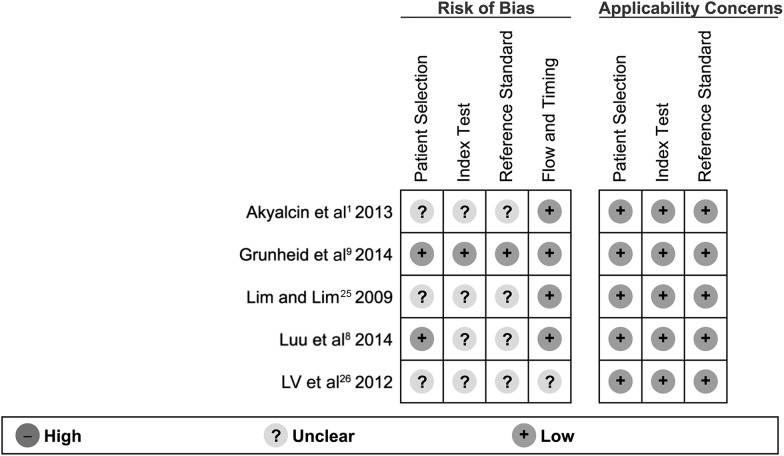
According to QUADAS-2, the risk of bias is low to moderate. The domains that may introduce bias were patient selection, index test and reference standard (Figures 2 and 3). No concerns regarding applicability were detected in all included studies. The lack of description of sample randomization1,25,26 and blinding1,8,25,26 were the main sources of bias. Likewise, the field of view8 and appropriate interval between the methods26 were not described in specific studies (Table 3). No article was eliminated after QUADAS-2 tool application.
Figure 2.
Risk of bias and applicability concerns summary.
Figure 3.
Risk of bias and applicability concerns graph.
Table 3.
Quality assessment of included studies
| Signalling question | Lim and Lim (2009)25 | Lv et al (2012)26 | Akyalcin et al (2013)1 | Grunheid et al (2014)9 | Luu et al (2014)8 |
|---|---|---|---|---|---|
| Was a consecutive or random sample of patients enrolled? | Unclear | Unclear | Unclear | Yes | Yes |
| Was a case–control design avoided? | Yes | Yes | Yes | Yes | Yes |
| Did the study avoid inappropriate exclusions? | Yes | Yes | Yes | Yes | Yes |
| Were the index test results interpreted without knowledge of the results of the reference standard? | Unclear | Unclear | Unclear | Yes | Yes |
| Was the field of view described? | Yes | Yes | Yes | Yes | Unclear |
| Was the CBCT scanner described? | Yes | Yes | Yes | Yes | Yes |
| Was the voxel size described? | Yes | Yes | Yes | Yes | Yes |
| Was the type of software models acquisition described? | Yes | Yes | Yes | Yes | Yes |
| Was the type of software model measurements described? | Yes | Yes | Yes | Yes | Yes |
| Is the reference standard likely to correctly classify the target condition? | Yes | Yes | Yes | Yes | Yes |
| Were the reference standard results interpreted without knowledge of the results of the index tests? | Unclear | Unclear | Unclear | Yes | Unclear |
| Was there an appropriate interval between the index test and reference standard? | Yes | Unclear | Yes | Yes | Yes |
| Did all patients receive the same reference standard? | Yes | Yes | Yes | Yes | Yes |
| Were all patients included in the analysis? | Yes | Yes | Yes | Yes | Yes |
Synthesis of results
Results of the selected studies included accuracy (Supplementary Table A), intraexaminer (Supplementary Table B) and interexaminer reproducibility (Supplementary Table C) of linear measurements on digital models when compared with plaster models. Included studies selected the following linear measurements: mesiodistal tooth width, intercanine width, interpremolar width, intermolar width, sum of anterior teeth, sum of all teeth, required space, available space/arch perimeter, arch crowding, arch length and arch length discrepancy.
Accuracy
The measurements selected to evaluate accuracy were organized into four groups: arch length and crowding, tooth width, arch width and Bolton discrepancy.
Arch length and crowding
Four studies assessed the accuracy of measurements associated to space analysis and crowding.1,8,25,26 The differences between measurements of crowding ranged from 1.068,26 to 1.75 mm.8 Luu et al8 showed a high discrepancy (3.38 mm) for the maxillary perimeter measurement. Two authors1,8 used intraclass correlation coefficient (ICC) when they compared arch length obtained from plaster models and digital models and found a correlation that ranged from poor to excellent between the methods. The poor correlation was identified for maxillary perimeter measurement8 (Supplementary Table A).
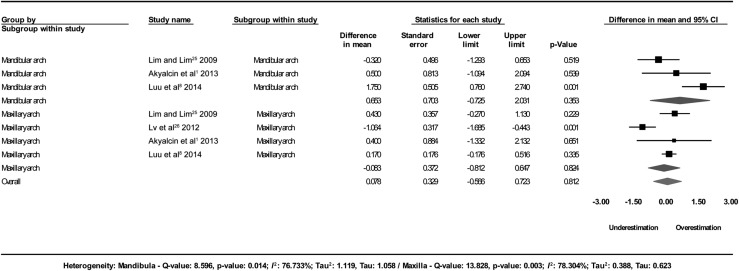
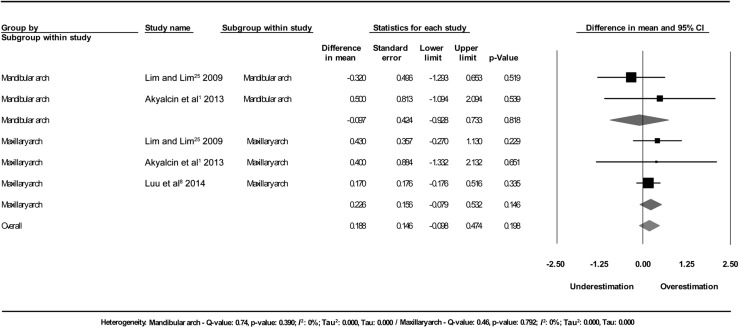
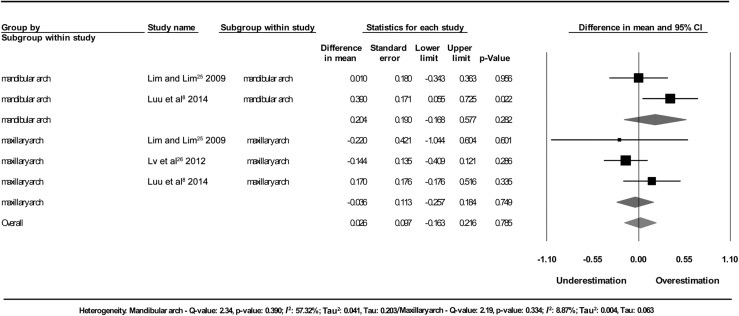
In the meta-analysis, the included studies trended towards overestimating crowding measurement on digital models compared with plaster models in the maxillary arch. However, in the mandibular arch, Lim and Lim25 underestimated this measurement on digital models. There were no significant differences in the subgroups and when both arches were considered together (Figure 4). In this comparison, the heterogeneity in both subgroups was high (I2: maxillary arch, 78.30%; mandibular arch, 76.73%). A sensitivity analysis was performed and the heterogeneity decreased (I2 = 0% in both subgroups) when the articles by Luu et al8 and Lv et al26 were removed from the mandibular and the maxillary arch, respectively (Figure 5). This may have happened because of the high number of examiners8 or because the lower arch was not included in the comparisons.26 However, although the effect size changed, the conclusion that no significant difference was found in the subgroups or in the overall analysis remained.
Figure 4.
Comparison of crowding measurement obtained on digital model generated from CBCT and plaster model. CI, confidence interval.
Figure 5.
Comparison of crowding measurement obtained on digital model generated from CBCT and plaster model when performing sensitivity analysis. CI, confidence interval.
Tooth width
Differences in tooth width were measured in three studies.8,25,26 The mean difference ranged from 0.01 mm, measured in the lower lateral incisor,25 to 0.47 mm, in the upper central incisor.8 Most tooth width measurements in digital models were lower than in plaster models, according to the results reported by Lim and Lim25 and Lv et al,26 and were higher in the results of Luu et al.8 The ICC calculated by Luu et al verified a correlation that ranged from poor to good in the majority of measurements. Tooth width was evaluated by Grunheid et al9 through Bland–Altman analysis, and they found a bias of 0.191 mm with limit of agreement interval width of 1.521 and a mean squared error of 0.181 mm (Supplementary Table A).
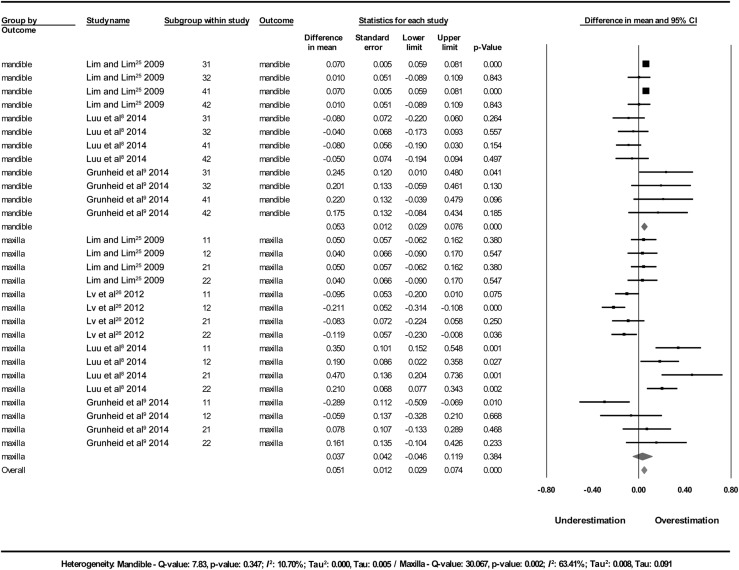
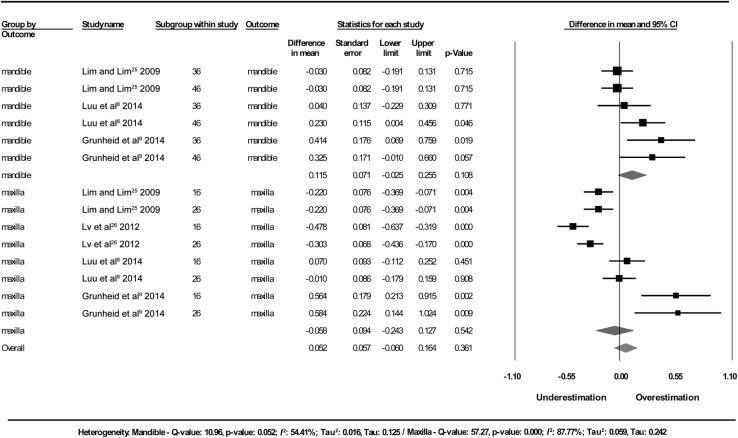
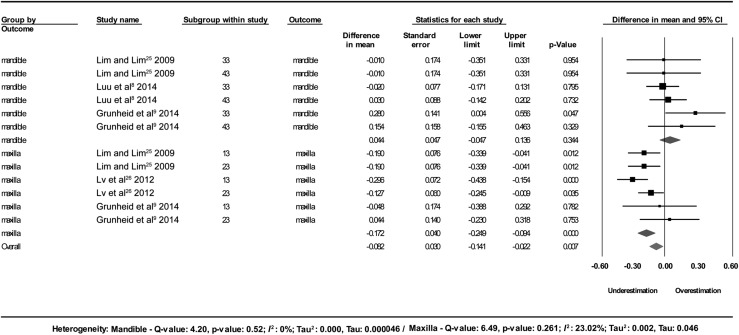
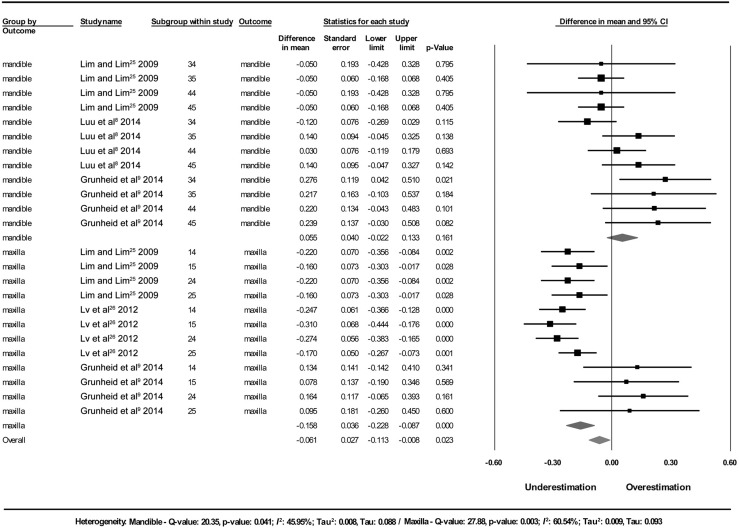
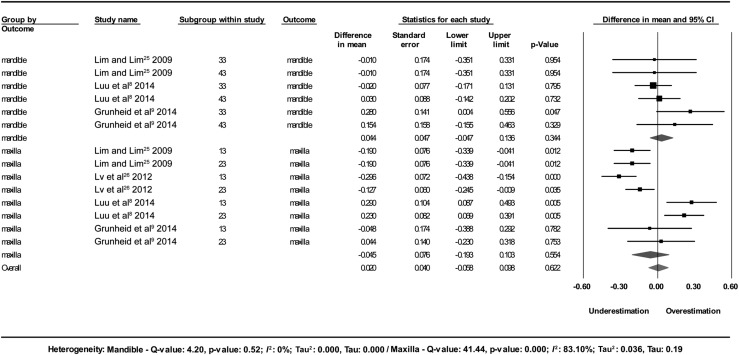
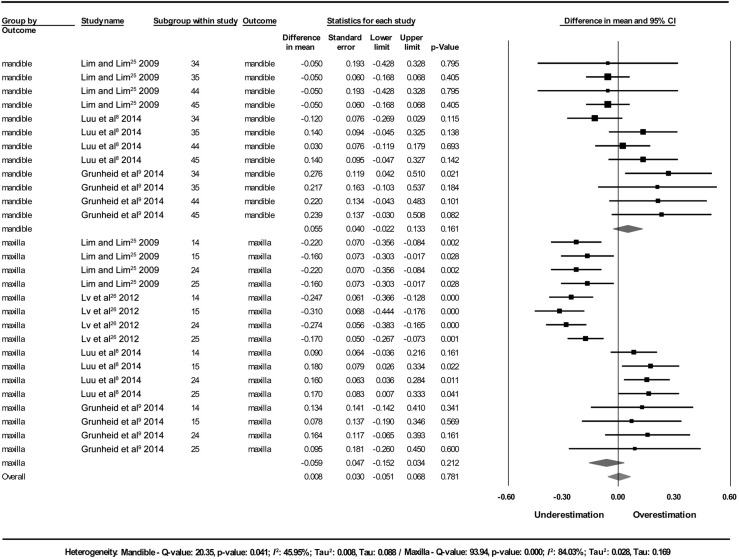
In the meta-analysis, the data from the study of Lim and Lim25 was duplicated (right and left sides) since the authors presented only one value for each tooth in the maxillary and mandibular arches. The teeth measurements were assessed with the following subgroups: incisors, canines, premolars and molars (Figures 6–9). When the heterogeneity was high, a sensitivity analysis was performed. When the article by Luu et al8 was removed from the canine and premolar comparisons in the maxilla subgroup, the heterogeneity decreased (Figures 10 and 11) as measured by the I2 index (from 83.10% to 23.02% in the canines comparison; from 84.03% to 60.54% in the premolars comparison). In the molars comparison, no article removal in the performance of the sensitivity analysis made a difference in the high heterogeneity. The width of the incisors was overestimated in the mandibular arch and the width of canines and premolars was underestimated in the maxillary arch, with significant differences after sensitivity analysis.
Figure 6.
Comparison of mesiodistal tooth width (incisors) obtained on digital model generated from CBCT and plaster model. CI, confidence interval.
Figure 9.
Comparison of mesiodistal tooth width (molars) obtained on digital model generated from CBCT and plaster model. CI, confidence interval.
Figure 10.
Comparison of mesiodistal tooth width (canines) obtained on digital model generated from CBCT and plaster model when performing sensitivity analysis. CI, confidence interval.
Figure 11.
Comparison of mesiodistal tooth width (premolars) obtained on digital model generated from CBCT and plaster model when performing sensitivity analysis. CI, confidence interval.
Figure 7.
Comparison of mesiodistal tooth width (canines) obtained on digital model generated from CBCT and plaster model. CI, confidence interval.
Figure 8.
Comparison of mesiodistal tooth width (premolars) obtained on digital model generated from CBCT and plaster model. CI, confidence interval.
Arch width
Transverse dimensions were measured in three studies.8,25,26 The mean differences ranged from 0.0125 to 0.39 mm,8 both measured at mandibular first molar.8,25 Statistically significant differences were found on mandibular intermolar width,8 and maxillary intercanine width in individual studies.25 Luu et al identified an excellent correlation by ICC (Supplementary Table A). In the meta-analysis, only the intermolar width comparison was possible, and no significant difference was observed (Figure 12).
Figure 12.
Comparison of intermolar width obtained on digital model generated from CBCT and plaster model. CI, confidence interval.
Bolton analysis discrepancy
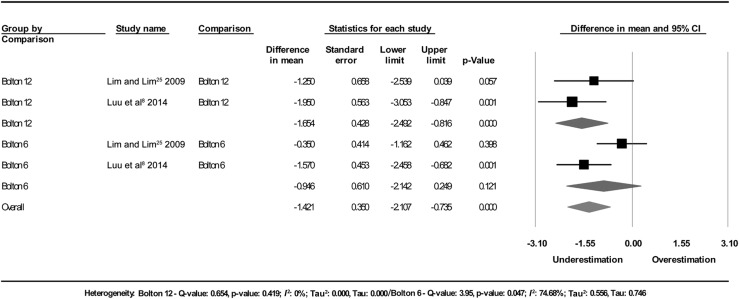
Regarding Bolton discrepancy, differences were compared in two studies.8,25 The mean differences ranged from −0.35 to −1.95 mm, measured for anterior and overall Bolton discrepancies, respectively, measured for anterior25 and overall Bolton discrepancies.8 A statistically significant difference was observed for anterior8 and overall Bolton discrepancies in individual studies.8,25 A poor correlation was verified by Luu et al when the ICC was calculated. Lim and Lim25 applied Pearson correlation and verified a correlation of 0.764 and 0.718, respectively, for anterior Bolton and overall Bolton discrepancies (Supplementary Table A). The meta-analysis was performed between two studies,8,25 and there was a significant difference in the Bolton analysis (Figure 13) to overall Bolton discrepancy and no significant difference to anterior Bolton discrepancy.
Figure 13.
Comparison of Bolton analysis obtained on digital model generated from CBCT and plaster model. CI, confidence interval.
Reproducibility
The results of reproducibility were presented subdivided as intra- and interexaminer reproducibilities. The studies assessed this feature by using different tests: ICC,1,8,26 the Bland–Altman method9 and paired t-tests25 and ANOVA8 for mean differences. The ICC showed that the reproducibility may be considered good when >0.75 and as excellent when >0.9.54 The limits of agreement of the Bland–Altman method and the mean differences reported were compared with the clinically significant values considered in this review. The paired t-test results were considered significant when p < 0.05.
Intraexaminer reproducibility
All included studies assessed intraexaminer reproducibility of linear measurements on digital models.1,8,9,25,26 The ICC parameters were verified in three studies,1,8,26 all of them >0.75, demonstrating a good reproducibility. The limits of agreement of tooth width reported by Grunheid et al9 were in absolute values as high as 0.5 mm, and 95% of the mean differences were below this value, which was considered clinically insignificant according to the parameters adopted in this review. Lim and Lim25 showed statistically significant mean differences in the repeated measures of mesiodistal width of the lower lateral incisor and lower second premolar when the paired t-test was applied, whereas Luu et al8 showed statistically significant mean differences in the repeated measures of the upper first molar, in the maxillary intermolar width, arch perimeter and arch crowding. However, the absolute mean differences for mesiodistal tooth width of the significant findings were <0.28 mm and for the sum of measurements were <1.71 mm, which were considered clinically insignificant (Supplementary Table B).
Interexaminer reproducibility
The interexaminer reproducibility was reported in three studies.1,8,9 The ICC parameters verified by Akyalcin et al1 and Luu et al8 were, respectively, >0.92 and >0.559 for all measurements and >0.75 for 67% of the measurements. The limits of agreement of tooth width reported by Grunheid et al9 were in absolute values as high as 2.3 mm, which was considered clinically significant. Luu et al8 showed statistically significant mean differences in the repeated measures of the upper canine and second premolar, lower lateral and central incisors, maxillary intermolar width, mandibular intercanine width and maxillary and mandibular perimeter and crowding. The absolute mean differences for mesiodistal tooth width of the significant findings were <0.34 mm, which were considered clinically insignificant. However, for sum of measurement values were as high as 5.72 mm, which were considered clinically significant (Supplementary Table C).
Discussion
Modifying what is traditional, reliable and valid requires the use of arguments obtained through numerous, extensive and qualified research.
Dental models have been reported to be an essential record of patient's occlusion and extremely used in the decision of treatment planning.13 Although plaster models are currently considered the gold or reference standard for orthodontic diagnostics,1,8,9,13,25,26,49,55 measurements in plaster models may involve errors,8,9 and there are a few known reports.1,14,18,31,32 Some random and systematic errors in measurements in these models may be a result of the measuring instrument, difficulties in the measurement process, operator skill and/or by alginate expansion because of imbibition of water.8
Nowadays, there is a tendency to incorporate digital models in orthodontic practice, but their potential advantages14,18,31,32 would be rejected if the accuracy and reproducibility of their analysis methods were not comparable with those taken on plaster models with digital calipers.9 Digital models generated from the patient's mouth impressions might be associated with some errors such as alginate shrinkage during transportation to companies that generate digital models,7 and/or loss of information because of the scanning process.9 However, previous systematic reviews have concluded that digital models are accurate and are reproducibly and clinically acceptable for dental measurements.14,15,31,32
Although almost all digital models are made from alginate impressions, which are directly scanned or poured in plaster to obtain the study models and then scanned,9 the digital models could also be obtained from the CBCT scan of the patients' heads when they have already been submitted to the examination for other clinical reasons. The use of dental models generated from the CBCT scan would bring the advantage of sparing the impression procedure, added to the other benefits of digital models. Nevertheless, digital models generated from CBCT scans exhibit limited anatomical reproduction of the occlusal and interproximal tooth parts.1,9
When analyzing the methodological quality of the selected studies, we found gaps in few signalling questions, according to the QUADAS-2 tool. Most studies have not clearly described blinding of the investigators when the results of the tests were interpreted, and the samples randomized.1,25,26 No concerns about applicability of the methods used in the studies were identified, and all of them matched the review question. The lack of information about an appropriate interval between the acquisition of plaster and digital models could cause bias as a result of oral diseases or trauma which could change the morphology of the teeth that would be submitted for measurements.26 In the quantitative analysis performed through the meta-analysis, all previous selected studies were included because of the small number of studies identified in the screening, although one26 of them presented an unclear risk of bias.
Only one article9 used Bland–Altman analysis to evaluate accuracy and reproducibility, respectively, by the degree of agreement between the measurements on digital models and those on plaster models, and between replicate measurements. Future studies could include this method that is simple and easy to demonstrate agreement and reliability.
Regarding previous systematic reviews, only Rossini et al14 selected an article1 that was in common with our systematic review. This review14 was the latest published in the literature and conducted the search strategy until November 2014. The difference between the results of the included articles is probably due to different review questions, a search strategy that provided a large literature scan and the differences in our selection criteria. We chose to focus on quantitative linear measurements on digital models generated from direct patient CBCT scans and compared solely with plaster models.
The accuracy of dental linear measurements obtained from digital models generated from the CBCT scan compared with those obtained from the plaster models showed clinically insignificant mean differences for mesiodistal tooth width, and transversal widths (−0.036 to 0.204) and for sums of measurements (−0.097 to −1.654), according to the values assigned in our study, although statistically significant differences were found in some subgroups analyzed. This agrees with the findings of previous reviews.14,15
Only maxillary perimeter was judged to be clinically significant when compared between digital and plaster models according to Luu et al.8 However, only one article assessed this parameter and more researches are necessary to confirm these results. The ICC for this measurement was poor when evaluated in the included studies.1,8
In orthodontic treatment, the assessment of crowding and intermolar width are frequently used in dental models. The heterogeneity was null (I2 = 0%, Figure 5) and moderate (I2 = 57% Figure 12) in these groups, and the values trended towards overestimating the measures in the maxillary arch while underestimating them in the mandibular arch.
When plaster models and digital models generated from the CBCT scan were compared in the meta-analysis, the values were overestimated in the mandibular arch while underestimated for mesiodistal width measurements of teeth in the maxillary arch (Figures 6 and 9–11). That may have happened because of the difference in the size of the maxillary and mandibular teeth, the low accuracy of interproximal surfaces, random errors on landmark positions and the methodological acquisition of the segmentation process.
Our findings, summarizing the evidence of intraexaminer reproducibility of the linear dental measurements acquired from CBCT digital models of the included articles agree with the results of the reviews of Luu et al8 and Rossini et al.14 However, regarding interexaminer reproducibility, differently from Rossini et al,14 we identified problems, which shows that the methods may need further improvement, especially operator training should be emphasized and images could also be enhanced.49
Most mean differences obtained from the comparison of measurements performed on the plaster models and digital models generated from CBCT scan suggest that one should contraindicate these digital models for study model analysis mainly on borderline cases. Other known reasons to avoid this method were in dental arches with restorations cases,51 and for patients with primary and mixed dentitions because they are at increased risk of exposure to ionizing radiation.56
Precision of 0.01 mm is adopted to take measurements in plaster models and digital models software in general,1,7,9,12,13,26 therefore these digital models generated from CBCT are in fact limited by the resolution of CBCT scan.8,9 These standardizations already affect the quality of the images, especially digital models generated from CBCT scan. All selected studies for this review used 0.3 × 0.3 × 0.3-mm voxel size.1,8,9,25,26 Added to this, the image quality might be affected by scanning artefacts, patient's movement while performing CBCT scan9,25 and by the poor reconstruction of occlusal surface in some cases,9 and these problems might affect dental measurements. When poor image quality of occlusal surface is obtained, the arch width measurement would probably be questionable.
One limitation of this review is that the findings were extracted from only five articles.1,8,9,25,26 We suggest further research on this subject so that more information is added to the scientific community and can strengthen the evidence available. Another potential weakness is that the files of digital models obtained from CBCTs are not in the same format or are not specified by authors.
As demonstrated in our systematic review with meta-analysis, the digital models generated from CBCT scan are not perfect yet. We do not intend to suggest the replacement of plaster models or some digital models, that have proven to be accurate and reproducible, by models generated from CBCT scans, but we advise to take the opportunity of using these models when already part of the diagnostic record of the patient. And in the future we may probably use a unique register of the patient with CBCT and take several analysis of this record.
Conclusions
Based on the moderate level of evidence, it may be concluded that:
– Digital models obtained from CBCT are accurate for the following maxillary and mandibular dental measures: crowding, intermolar width and mesiodistal width of maxillary incisors, mandibular canines and premolars, and molars in both arches;
– The differences were clinically acceptable for all dental linear measurements, except for arch perimeter
– Digital models generated from CBCT are reproducible for all measurements when intraexaminer assessment is considered and need improvement in interexaminer evaluation.
Acknowledgments
Acknowledgments
The authors thank Daniele Masterson by the help and guidance on search strategies for each electronic database.
Appendix A
Table A1.
QUADAS-2 adapted
| Risk of bias | Concerns regarding applicability |
|---|---|
| Patient selection | Patient selection |
| Was a consecutive or random sample of patients enrolled? | Are there concerns that the included patients and settings do not match the review question? |
| Was a case–control design avoided? | |
| Did the study avoid inappropriate exclusions? | |
| Index test | Index test |
| Were the index test results interpreted without knowledge of the results of the reference standard? | Are there concerns that the index test, its conduct, or interpretation differ from the review question? |
| Was the field of view described? | |
| Was the CBCT scanner described? | |
| Was the voxel size described? | |
| Was the type of software for models acquisition described? | |
| Was the type of software for models measurements described? | |
| Reference standard | Reference standard |
| Is the reference standard likely to correctly classify the target condition? | Are there concerns that the target condition as defined by the reference standard does not match the question? |
| Were the reference standard results interpreted without knowledge of the results of the index tests? | |
| Flow and timing | |
| Was there an appropriate interval between index test and reference standard? | |
| Did all patients receive the same reference standard? | |
| Were all patients included in the analysis? |
Contributor Information
Jamille B Ferreira, Email: jamillebarros@hotmail.com.
Ilana O Christovam, Email: emaildailana@yahoo.com.br.
David S Alencar, Email: davidsalencar@hotmail.com.
Claudia T Mattos, Email: claudiatrindademattos@gmail.com.
Adriana Cury-Saramago, Email: adrianacury@id.uff.br.
References
- 1.Akyalcin S, Dyer DJ, English JD, Sar C. Comparison of 3-dimensional dental models from different sources: diagnostic accuracy and surface registration analysis. Am J Orthod Dentofacial Orthop 2013; 144: 831–7. doi: https://doi.org/10.1016/j.ajodo.2013.08.014 [DOI] [PubMed] [Google Scholar]
- 2.Kim J, Heo G, Lagravere MO. Accuracy of laser-scanned models compared to plaster models and cone-beam computed tomography. Angle Orthod 2014; 84: 443–50. doi: https://doi.org/10.2319/051213-365.1 [DOI] [PMC free article] [PubMed] [Google Scholar]
- 3.Leifert MF, Leifert MM, Efstratiadis SS, Cangialosi TJ. Comparison of space analysis evaluations with digital models and plaster dental casts. Am J Orthod Dentofacial Orthop 2009; 136: 16.e1–4; discussion 16. doi: https://doi.org/10.1016/j.ajodo.2008.11.019 [DOI] [PubMed] [Google Scholar]
- 4.Mullen SR, Martin CA, Ngan P, Gladwin M. Accuracy of space analysis with emodels and plaster models. Am J Orthod Dentofacial Orthop 2007; 132: 346–52. doi: https://doi.org/10.1016/j.ajodo.2005.08.044 [DOI] [PubMed] [Google Scholar]
- 5.Shastry S, Park JH. Evaluation of the use of digital study models in postgraduate orthodontic programs in the United States and Canada. Angle Orthod 2014; 84: 62–7. doi: https://doi.org/10.2319/030813-197.1 [DOI] [PMC free article] [PubMed] [Google Scholar]
- 6.Malik OH, Abdi-Oskouei M, Mandall NA. An alternative to study model storage. Eur J Orthod 2009; 31: 156–9. doi: https://doi.org/10.1093/ejo/cjn071 [DOI] [PubMed] [Google Scholar]
- 7.Santoro M, Galkin S, Teredesai M, Nicolay OF, Cangialosi TJ. Comparison of measurements made on digital and plaster models. Am J Orthod Dentofacial Orthop 2003; 124: 101–5. doi: https://doi.org/10.1016/s0889-5406(03)00152-5 [DOI] [PubMed] [Google Scholar]
- 8.Luu NS, Mandich MA, Flores-Mir C, El-Bialy T, Heo G, Carey JP, et al. The validity, reliability, and time requirement of study model analysis using cone-beam computed tomography-generated virtual study models. Orthod Craniofac Res 2014; 17: 14–26. doi: https://doi.org/10.1111/ocr.12024 [DOI] [PubMed] [Google Scholar]
- 9.Grunheid T, Patel N, De Felippe NL, Wey A, Gaillard PR, Larson BE. Accuracy, reproducibility, and time efficiency of dental measurements using different technologies. Am J Orthod Dentofacial Orthop 2014; 145: 157–64. doi: https://doi.org/10.1016/j.ajodo.2013.10.012 [DOI] [PubMed] [Google Scholar]
- 10.Pacheco-Pereira C, De Luca Canto G, Major PW, Flores-Mir C. Variation of orthodontic treatment decision-making based on dental model type: a systematic review. Angle Orthod 2015; 85: 501–9. doi: https://doi.org/10.2319/051214-343.1 [DOI] [PMC free article] [PubMed] [Google Scholar]
- 11.Quimby ML, Vig KW, Rashid RG, Firestone AR. The accuracy and reliability of measurements made on computer-based digital models. Angle Orthod 2004; 74: 298–303. [DOI] [PubMed] [Google Scholar]
- 12.Stevens DR, Flores-Mir C, Nebbe B, Raboud DW, Heo G, Major PW. Validity, reliability, and reproducibility of plaster vs digital study models: comparison of peer assessment rating and Bolton analysis and their constituent measurements. Am J Orthod Dentofacial Orthop 2006; 129: 794–803. doi: https://doi.org/10.1016/j.ajodo.2004.08.023 [DOI] [PubMed] [Google Scholar]
- 13.Abizadeh N, Moles DR, O'Neill J, Noar JH. Digital versus plaster study models: how accurate and reproducible are they?. J Orthod 2012; 39: 151–9. doi: https://doi.org/10.1179/1465312512z.00000000023 [DOI] [PubMed] [Google Scholar]
- 14.Rossini G, Parrini S, Castroflorio T, Deregibus A, Debernardi CL. Diagnostic accuracy and measurement sensitivity of digital models for orthodontic purposes: a systematic review. Am J Orthod Dentofacial Orthop 2016; 149: 161–70. doi: https://doi.org/10.1016/j.ajodo.2015.06.029 [DOI] [PubMed] [Google Scholar]
- 15.Luu NS, Nikolcheva LG, Retrouvey JM, Flores-Mir C, El-Bialy T, Carey JP, et al. Linear measurements using virtual study models. Angle Orthod 2012; 82: 1098–106. doi: https://doi.org/10.2319/110311-681.1 [DOI] [PMC free article] [PubMed] [Google Scholar]
- 16.Martensson B, Rydén H. The holodent system, a new technique for measurement and storage of dental casts. Am J Orthod Dentofacial Orthop 1992; 102: 113–19. [DOI] [PubMed] [Google Scholar]
- 17.Redlich M, Weinstock T, Abed Y, Schneor R, Holdstein Y, Fischer A. A new system for scanning, measuring and analyzing dental casts based on a 3D holographic sensor. Orthod Craniofac Res 2008; 11: 90–5. doi: https://doi.org/10.1111/j.1601-6343.2007.00417.x [DOI] [PubMed] [Google Scholar]
- 18.Bell A, Ayoub AF, Siebert P. Assessment of the accuracy of a three-dimensional imaging system for archiving dental study models. J Orthod 2003; 30: 219–23. doi: https://doi.org/10.1093/ortho/30.3.219 [DOI] [PubMed] [Google Scholar]
- 19.Akyalcin S, Cozad BE, English JD, Colville CD, Laman S. Diagnostic accuracy of impression-free digital models. Am J Orthod Dentofacial Orthop 2013; 144: 916–22. doi: https://doi.org/10.1016/j.ajodo.2013.04.024 [DOI] [PubMed] [Google Scholar]
- 20.Baumgaertel S, Palomo JM, Palomo L, Hans MG. Reliability and accuracy of cone-beam computed tomography dental measurements. Am J Orthod Dentofacial Orthop 2009; 136: 19–25; discussion 25–18. [DOI] [PubMed] [Google Scholar]
- 21.Creed B, Kau CH, English JD, Xia JJ, Lee RP. A comparison of the accuracy of linear measurements obtained from cone beam computerized tomography images and digital models. Semin Orthod 2011; 17: 49–56. [DOI] [PMC free article] [PubMed] [Google Scholar]
- 22.Hernandez Y, Tarazona B, Zamora N, Cibrian R, Luis Gandia J, Paredes V. Comparative study of reproducibility and accuracy in measuring mesiodistal tooth sizes using three different methods: 2D digital, 3D CBCT, and 3D CBCT segmented. Oral Radiol 2015; 31: 165–72. doi: https://doi.org/10.1007/s11282-015-0204-x [Google Scholar]
- 23.Kau CH, Littlefield J, Rainy N, Nguyen JT, Creed B. Evaluation of CBCT digital models and traditional models using the Little's index. Angle Orthod 2010; 80: 435–9. doi: https://doi.org/10.2319/083109-491.1 [DOI] [PMC free article] [PubMed] [Google Scholar]
- 24.Lightheart KG, English JD, Kau CH, Akyalcin S, Bussa HI Jr, McGrory KR, et al. Surface analysis of study models generated from OrthoCAD and cone-beam computed tomography imaging. Am J Orthod Dentofacial Orthop 2012; 141: 686–93. doi: https://doi.org/10.1016/j.ajodo.2011.12.019 [DOI] [PubMed] [Google Scholar]
- 25.Lim MY. Lim SH. Comparison of model analysis measurements among plaster model, laser scan digital model, and cone beam CT image. Korean J Orthod 2009; 39: 6–17. [Google Scholar]
- 26.Lv Y, Yan B, Wang L, Lou DH. The reliability of dento-maxillary models created by cone-beam CT and rapid prototyping:a comparative study. [In Chinese.] Shanghai Kou Qiang Yi Xue 2012; 21: 175–9. [PubMed] [Google Scholar]
- 27.Tarazona B, Llamas JM, Cibrián R, Gandia JL, Paredes V. Evaluation of the validity of the Bolton Index using cone-beam computed tomography (CBCT). Med Oral Patol Oral Cir Bucal 2012; 17: e878–83. [DOI] [PMC free article] [PubMed] [Google Scholar]
- 28.Tarazona B, Llamas JM, Cibrian R, Gandia JL, Paredes V. A comparison between dental measurements taken from CBCT models and those taken from a digital method. Eur J Orthod 2013; 35: 1–6. doi: https://doi.org/10.1093/ejo/cjr005 [DOI] [PubMed] [Google Scholar]
- 29.Wiranto MG, Engelbrecht WP, Nolthenius HE, van der Meer WJ, Ren Y. Validity, reliability, and reproducibility of linear measurements on digital models obtained from intraoral and cone-beam computed tomography scans of alginate impressions. Am J Orthod Dentofacial Orthop 2013; 143: 140–7. doi: https://doi.org/10.1016/j.ajodo.2012.06.018 [DOI] [PubMed] [Google Scholar]
- 30.de Waard O, Rangel FA, Fudalej PS, Bronkhorst EM, Kuijpers-Jagtman AM, Breuning KH. Reproducibility and accuracy of linear measurements on dental models derived from cone-beam computed tomography compared with digital dental casts. Am J Orthod Dentofacial Orthop 2014; 146: 328–36. doi: https://doi.org/10.1016/j.ajodo.2014.05.026 [DOI] [PubMed] [Google Scholar]
- 31.De Luca Canto G, Pacheco-Pereira C, Lagravere MO, Flores-Mir C, Major PW. Intra-arch dimensional measurement validity of laser-scanned digital dental models compared with the original plaster models: a systematic review. Orthod Craniofac Res 2015; 18: 65–76. doi: https://doi.org/10.1111/ocr.12068 [DOI] [PubMed] [Google Scholar]
- 32.Fleming PS, Marinho V, Johal A. Orthodontic measurements on digital study models compared with plaster models: a systematic review. Orthod Craniofac Res 2011; 14: 1–16. doi: https://doi.org/10.1111/j.1601-6343.2010.01503.x [DOI] [PubMed] [Google Scholar]
- 33.Im J, Cha JY, Lee KJ, Yu HS, Hwang CJ. Comparison of virtual and manual tooth setups with digital and plaster models in extraction cases. Am J Orthod Dentofacial Orthop 2014; 145: 434–42. doi: https://doi.org/10.1016/j.ajodo.2013.12.014 [DOI] [PubMed] [Google Scholar]
- 34.Kihara T, Tanimoto K, Michida M, Yoshimi Y, Nagasaki T, Murayama T, et al. Construction of orthodontic setup models on a computer. Am J Orthod Dentofacial Orthop 2012; 141: 806–13. doi: https://doi.org/10.1016/j.ajodo.2011.10.027 [DOI] [PubMed] [Google Scholar]
- 35.Rischen RJ, Breuning KH, Bronkhorst EM, Kuijpers-Jagtman AM. Records needed for orthodontic diagnosis and treatment planning: a systematic review. PLoS One 2013; 8: e74186. doi: https://doi.org/10.1371/journal.pone.0074186 [DOI] [PMC free article] [PubMed] [Google Scholar]
- 36.Cevidanes LH, Oliveira AE, Grauer D, Styner M, Proffit WR. Clinical application of 3D imaging for assessment of treatment outcomes. Semin Orthod 2011; 17: 72–80. doi: https://doi.org/10.1053/j.sodo.2010.08.012 [DOI] [PMC free article] [PubMed] [Google Scholar]
- 37.Kau CH, Olim S, Nguyen JT. The future of orthodontic diagnostic records. Semin Orthod 2011; 17: 39–45. doi: https://doi.org/10.1053/j.sodo.2010.08.008 [Google Scholar]
- 38.Palmer NG, Yacyshyn JR, Northcott HC, Nebbe B, Major PW. Perceptions and attitudes of Canadian orthodontists regarding digital and electronic technology. Am J Orthod Dentofacial Orthop 2005; 128: 163–7. doi: https://doi.org/10.1016/j.ajodo.2005.02.015 [DOI] [PubMed] [Google Scholar]
- 39.Al-Rawi B, Hassan B, Vandenberge B, Jacobs R. Accuracy assessment of three-dimensional surface reconstructions of teeth from cone beam computed tomography scans. J Oral Rehabil 2010; 37: 352–8. doi: https://doi.org/10.1111/j.1365-2842.2010.02065.x [DOI] [PubMed] [Google Scholar]
- 40.White AJ, Fallis DW, Vandewalle KS. Analysis of intra-arch and interarch measurements from digital models with 2 impression materials and a modeling process based on cone-beam computed tomography. Am J Orthod Dentofacial Orthop 2010; 137: 456.e1–9; discussion 456–7. doi: https://doi.org/10.1016/j.ajodo.2009.09.019 [DOI] [PubMed] [Google Scholar]
- 41.Bossuyt PM, Reitsma JB, Bruns DE, Gatsonis CA, Glasziou PP, Irwig LM, et al. The STARD statement for reporting studies of diagnostic accuracy: explanation and elaboration. Clin Chem 2003; 49: 7–18. doi: https://doi.org/10.1373/49.1.7 [DOI] [PubMed] [Google Scholar]
- 42.Houston WJ. The analysis of errors in orthodontic measurements. Am J Orthod 1983; 83: 382–90. doi: https://doi.org/10.1016/0002-9416(83)90322-6 [DOI] [PubMed] [Google Scholar]
- 43.Moher D, Liberati A, Tetzlaff J, Altman DG; PRISMA Group. Preferred reporting items for systematic reviews and meta-analyses: the PRISMA statement. Plos Med 2009; 6: e1000097. doi: https://doi.org/10.1371/journal.pmed.1000097 [DOI] [PMC free article] [PubMed] [Google Scholar]
- 44.Mozzo P, Procacci C, Tacconi A, Martini PT, Andreis IA. A new volumetric CT machine for dental imaging based on the cone-beam technique: preliminary results. Eur Radiol 1998; 8: 1558–64. doi: https://doi.org/10.1007/s003300050586 [DOI] [PubMed] [Google Scholar]
- 45.Whiting P, Rutjes AW, Reitsma JB, Bossuyt PM, Kleijnen J. The development of QUADAS: a tool for the quality assessment of studies of diagnostic accuracy included in systematic reviews. BMC Med Res Methodol 2003; 3: 25. [DOI] [PMC free article] [PubMed] [Google Scholar]
- 46.Whiting PF, Rutjes AW, Westwood ME, Mallett S, Deeks JJ, Reitsma JB, et al. QUADAS-2: a revised tool for the quality assessment of diagnostic accuracy studies. Ann Intern Med 2011; 155: 529–36. doi: https://doi.org/10.7326/0003-4819-155-8-201110180-00009 [DOI] [PubMed] [Google Scholar]
- 47.Asquith J, Gillgrass T, Mossey P. Three-dimensional imaging of orthodontic models: a pilot study. Eur J Orthod 2007; 29: 517–22. doi: https://doi.org/10.1093/ejo/cjm044 [DOI] [PubMed] [Google Scholar]
- 48.Hassan B, Couto Souza P, Jacobs R, de Azambuja Berti S, van der Stelt P. Influence of scanning and reconstruction parameters on quality of three-dimensional surface models of the dental arches from cone beam computed tomography. Clin Oral Investig 2010; 14: 303–10. doi: https://doi.org/10.1007/s00784-009-0291-3 [DOI] [PMC free article] [PubMed] [Google Scholar]
- 49.El-Zanaty HM, El-Beialy AR, Abou El-Ezz AM, Attia KH, El-Bialy AR, Mostafa YA. Three-dimensional dental measurements: an alternative to plaster models. Am J Orthod Dentofacial Orthop 2010; 137: 259–65. doi: https://doi.org/10.1016/j.ajodo.2008.04.030 [DOI] [PubMed] [Google Scholar]
- 50.Celikoglu M, Nur M, Kilkis D, Sezgin OS, Bayram M. Mesiodistal tooth dimensions and anterior and overall Bolton ratios evaluated by cone beam computed tomography. Aust Orthod J 2013; 29: 153–8. [PubMed] [Google Scholar]
- 51.Gamba TO, Oliveira ML, Flores IL, Cruz AD, Almeida SM, Haiter-Neto F, et al. Influence of cone-beam computed tomography image artifacts on the determination of dental arch measurements. Angle Orthod 2014; 84: 274–8. doi: https://doi.org/10.2319/040313-255.1 [DOI] [PMC free article] [PubMed] [Google Scholar]
- 52.Kim J, Lagravére MO. Accuracy of bolton analysis measured in laser scanned digital models compared with plaster models (Gold standard) and cone-beam computer tomography images. Korean J Orthod 2016; 46: 13–19. [DOI] [PMC free article] [PubMed] [Google Scholar]
- 53.Kumar AA, Phillip A, Kumar S, Rawat A, Priya S, Kumaran V. Digital model as an alternative to plaster model in assessment of space analysis. J Pharm Bioallied Sci 2015; 7(Suppl. 2): S465–469. doi: https://doi.org/10.4103/0975-7406.163506 [DOI] [PMC free article] [PubMed] [Google Scholar]
- 54.Mattos CT, Cruz CV, da Matta TC, Pereira Lde A, Solon-de-Mello Pde A, Ruellas AC, et al. Reliability of upper airway linear, area, and volumetric measurements in cone-beam computed tomography. Am J Orthod Dentofacial Orthop 2014; 145: 188–97. doi: https://doi.org/10.1016/j.ajodo.2013.10.013 [DOI] [PubMed] [Google Scholar]
- 55.Peluso MJ, Josell SD, Levine SW, Lorei BJ. Digital models: an introduction. Semin Orthod 2004; 10: 226–38. doi: https://doi.org/10.1053/j.sodo.2004.05.007 [Google Scholar]
- 56.Ludlow JB, Timothy R, Walker C, Hunter R, Benavides E, Samuelson DB, et al. Effective dose of dental CBCT-a meta analysis of published data and additional data for nine CBCT units. Dentomaxillofac Radiol 2015; 44: 20140197. [DOI] [PMC free article] [PubMed] [Google Scholar]


