Abstract
Changes in photoperiod length are transduced into neuroendocrine signals by melatonin (MEL) secreted by the pineal gland triggering seasonally adaptive responses in many animal species. Siberian hamsters, transferred from a long-day ‘summer-like’ photoperiod (LD) to a short-day ‘winter-like’ photoperiod (SD), exhibit a naturally-occurring reversal in obesity. Photoperiod-induced changes in adiposity are mediated by the duration of MEL secretion and can be mimicked by exogenously administered MEL into animals housed in LD. Evidence suggests that MEL increases the sympathetic nervous system (SNS) drive to white adipose tissue (WAT). Here, we investigated whether MEL-driven seasonally adaptive losses in body fat are associated with WAT lipolysis and browning. Hamsters were subcutaneously administered vehicle (LD + VEH) or 0.4 mg/kg MEL (LD + MEL) daily for 10 weeks while animals housed in SD served as a positive control. MEL and SD exposure significantly decreased the retroperitoneal (RWAT), inguinal (IWAT), epididymal (EWAT) WAT, food intake and caused testicular regression compared with the LD + VEH group. MEL/SD induced lipolysis in the IWAT and EWAT, browning of the RWAT, IWAT, and EWAT, and increased UCP1 expression in the IBAT. Additionally, MEL/SD significantly increased the number of shared MEL receptor 1a and dopamine beta-hydroxylase-immunoreactive neurons in discrete brain sites, notably the paraventricular hypothalamic nucleus, dorsomedial hypothalamic nucleus, arcuate nucleus, locus coeruleus and dorsal motor nucleus of vagus. Collectively, these findings support our hypothesis that SD-exposed Siberian hamsters undergo adaptive decreases in body adiposity due to SNS-stimulated lipid mobilization and generalized WAT browning.
Keywords: Siberian hamsters, melatonin, sympathetic nervous system, dopamine beta-hydroxylase, beigeing, white adipose tissue
INTRODUCTION
Seasonally adaptive responses such as changes in adiposity are induced by seasonal changes in photoperiod length. Siberian hamsters (Phodopus sungorus) have proven to be an outstanding model with which to study these naturally-occurring changes in obesity. During exposure to a long-day ‘summer-like’ photoperiod (LD) hamsters become obese (i.e., 50 % body fat) but display a naturally-occurring adaptive loss of ~30 % body fat when transferred to a short-day ‘winter-like’ photoperiod (SD) [1, 2]. These photoperiod-dependent effects are mediated by changes in the duration of melatonin (MEL) secreted by the pineal gland. The seasonal changes in lipid mass can be mimicked in the laboratory by manipulating the duration of circulating MEL. For example, exogenously administered MEL can be used to increase the duration of circulating MEL in hamsters housed in LD resulting in a loss of body fat mimicking that seen in SD (for review see: [3, 4]). The MEL receptor subtype mediating the body fat and other photoperiodic responses is the MEL1a receptor (for review see: [4], [5]).
Although MEL plays a critical role in regulating the seasonal rhythmicity of body weight, it does not stimulate lipolysis in vitro [6] indicating that other signals are responsible for triggering SD-induced loss of body fat. The sympathetic nervous system (SNS) innervation of white adipose tissue (WAT) is sufficient and necessary for the initiation of WAT lipolysis [7]. Importantly, we determined that MEL1a receptor mRNA is colocalized in neurons that comprise the central SNS outflow circuitry from the brain to WAT [8]. We also found that exposure to SD photoperiod stimulates the SNS drive to WAT as indicated by increases in norepinephrine turnover [9]. Taken together these data support the hypothesis that MEL activation of MEL1a on the central SNS efferent neurons to WAT triggers lipolysis and ultimately reverses the obese phenotype of LD animals by accelerating SNS drive on WAT.
It has been reported that MEL decreases body mass due to increases in energy expenditure in the BAT [10, 11]. Another potential factor in seasonal obesity reversal is the ability to harness heat production by converting white adipocytes to a beige phenotype via specific increases in the SNS drive to these browned WAT depots (for review see: [12]). Evidence suggests that recruitment of classical brown adipocytes in WAT can be induced by various metabolic stimuli such as cold exposure or browning agents, as the result of β3-adrenoceptor (β3-AR) stimulation (for review see: [12, 13]). This process involves induction of mitochondrial uncoupling protein 1 (UCP1), which uncouples oxidative phosphorylation from ATP synthesis, releasing chemical energy as heat. In turn, the expression of UCP1 is regulated by specific transcriptional factors, most notably peroxisome proliferator-activated receptor-γ coactivator-1α (PGC-1α) ([14]; for review see: [15]). Both UCP1 and PGC-1α are found at high levels in multilocular brown adipocytes of the brown adipose tissue (BAT), thus serving as brown/beige fat-specific markers. In support of the SNS impact on WAT browning, Himms-Hagen and colleagues [16] demonstrated that chronic administration of the specific β3-AR agonist, CL316,243, triggered the multilocular phenotype of WAT adipocytes. Moreover, we previously reported that Siberian hamsters transferred from LD to SD in the laboratory without lowering ambient temperature exhibit increased β3-AR, PGC-1α and UCP1 mRNA expression in the retroperitoneal WAT (RWAT), the only fat pad examined thereat [17].
It has been shown that the dorsomedial hypothalamic nucleus (DMH), containing orexigenic neuropeptide Y (NPY), is critical in inducing browning phenotype of adipocytes specifically in the inguinal IWAT (IWAT) [18]. Selective knockdown of NPY in the DMH triggers IWAT browning and chemical IWAT SNS denervation blocks browning response [18] suggesting that browning effect is mediated by WAT SNS innervation. In this study, we tested the hypothesis that MEL-driven seasonally adaptive losses in body fat are due to SNS-stimulated lipolysis, browning of WAT and increased energy expenditure as a result of enhanced UCP1 expression in the BAT.
METHODS
Animals and photoperiodic conditions
Adolescent male Siberian hamsters (Phodopus sungorus; 2 months old, total n = 45) from our breeding colony were single-housed in a long-day (LD) photoperiod (16h:8h light:dark cycle with lights on at 0300 Eastern Standard Time; at 22 ± 2 °C) with ad libitum access to water and regular chow (#5001; 3.4 kcal/g, protein – 29.8 %, fat – 13.4 %, carbohydrates – 56.7 %; Ralston Purina, St. Louis, MO) for 2 wks before they were randomly assigned to one of two photoperiodic conditions. One third of LD hamsters (n = 15) were transferred to SD photoperiodic condition (8h:16h light:dark cycle; at 22 ± 2 °C) while the remaining two-thirds of hamsters (n = 30) continued to be housed in LD. Half of the LD hamsters were given a single subcutaneous injection of ethanolic saline (1:9 parts; LD + VEH group) or MEL [16 μg in 0.15 ml ethanolic saline MEL (LD + MEL), prepared fresh daily from a stock solution of 500 μg/ml MEL in 100 % ethanol] daily for 10 wks at 3 hours before lights out. SD animals served as a positive control. Body mass and food intake were measured at 0900 hours weekly throughout the experiment as previously described [19]. All procedures were approved by the Georgia State University Institutional Animal Care and Use Committee and are in accordance with Public Health Service and United States Department of Agriculture guidelines.
Tissue sampling and Western blotting
After 10 wks all animals were euthanized with pentobarbital sodium (300 mg/kg) and approximately 100 mg of each fat pad [the interscapular brown adipose tissue (IBAT), IWAT, RWAT, epididymal WAT (EWAT)] as well as testes were rapidly removed snap frozen in liquid nitrogen and stored at −80 °C. The tissues were homogenized in cold homogenization buffer [50 mM HEPES, 100 mM NaCl, 10.0 % SDS, 2 mM EDTA, 0.5 mM DTT, 1 mM benzamidine, protease inhibitor cocktail (Calbiochem, EMD Chemicals, Gibbstown, NJ), and phosphatase inhibitor cocktail (Thermo Fischer Scientific, Rockford, IL)] and then centrifuged at 13,000 g for 10 min at 4 °C. The supernatants were measured for protein content using the bicinchoninic acid protein assay kit (Thermo Fisher Scientific, Rockford, IL). Samples containing 10 μg of protein were mixed with loading buffer, heated at 95 °C for 5 min, electrophoresed on a low-bis SDS-PAGE [10.0 %:0.08 % acrylamide:bis] and transferred to polyvinylidene difluoride membranes. Each membrane represented a single gel and was cut in half so that immunoblotting could be done on duplicate lanes with different antibodies. The membranes were reacted with primary rabbit anti-UCP-1 (1:1000; Abcam, Cambridge, MA), PGC-1α (1:1000; Novus Biologicals, Littleton, CO), hormone-sensitive lipase (HSL), phosphorylated HSL (pHSL) and β-actin (each 1:1000; Cell Signaling Technology, Danvers, MA) antibodies for 2 days at 4 °C followed by incubation with secondary goat anti-rabbit IgG HRP-linked antibody, 1:1000; Cell Signaling Technology, Danvers, MA) antibody for 2 h at room temperature. The immunoblots were rinsed and incubated with LumiGLO chemiluminescent kit (Cell Signaling Technology, Danvers, MA) to visualize bands. The IBAT depots from Siberian hamsters were used as a positive control for UCP-1 and PGC-1α Western blotting showing the resulting proteins of the expected size.
Histology
Following fat pad extraction, hamsters were transcardially perfused with 0.9 % heparinized saline followed by 4.0 % paraformaldehyde in 0.1 M PBS. The brains were collected, postfixed in the same fixative for 3–4 h and then transferred to a 30.0 % sucrose solution in 0.1 M PBS with 0.1 % sodium azide at 4 °C overnight until the brains were sectioned on a freezing stage sliding microtome at 30 μm. For the double-label fluorescent immunohistochemistry, free-floating brain sections were rinsed in 0.1 M PBS (2 × 15 min) and 0.1 % sodium borohydride in 0.1 M PBS followed by 30 min incubation in a blocking solution of 10.0 % normal horse serum (NHS) and 0.3 % Triton X-100 in 0.1 M PBS. Sections were then incubated in the mixture of primary rabbit anti-MEL1a (1:200; NBP1-71113, Novus Biologicals, Littleton, CO) and mouse anti-dopamine beta-hydroxylase (DBH) (1:500; clone 4F10.2, EMD Millipore, Billerica, MA) antibodies containing 1.0 % NHS and 0.3 % Triton X-100 in 0.1 M PBS for 48 h at 4 °C. Following rinsing with 0.1 M PBS (3 × 15 min), sections were incubated in the mixture of the secondary donkey anti-rabbit Alexa 488 (1:500; Jackson Immunoresearch, West Grove, PA) and donkey anti-mouse Cy3 (1:500; Jackson Immunoresearch) antibodies in 0.1 M PBS overnight at room temperature. For immunohistochemical controls, the primary antibody was either omitted or preadsorbed with the immunizing recombinant peptide (H00004543-Q01, Novus Biologicals) overnight at 4 °C resulting in no immunoreactive (-ir) staining. Brain sections were mounted onto slides (Superfrost Plus) and coverslipped using ProLong Gold Antifade Reagent (Life Technologies, Grand Island, NY).
Quantitative and statistical analysis
Intensity of Western blot bands was quantified with ImageJ (US National Institutes of Health, Bethesda, MA). Data are presented as percentage values normalized to LD + VEH control.
Brain images were viewed and captured using 100× and 200× magnification with an Olympus DP73 imaging photomicroscope (Olympus, Tokyo, Japan) with appropriate filters for Alexa 488 and Cy3. The single-labeled MEL1a and DBH images were evaluated and overlaid with the aid of CellSens (Olympus) and the Adobe Photoshop CS5 (Adobe Systems, San Jose, CA) software. Singly-labeled MEL1- or DBH-ir and doubly-labeled MEL1a + DBH-ir neurons were counted in every sixth section using the manual tag feature of the Adobe Photoshop CS5 software thus eliminating the likelihood of counting the same neurons more than once. Absolute neuronal numbers in the brain were averaged across each examined region from all animals. A mouse brain atlas [20] was used to identify brain areas because no Siberian hamster brain atlas is available and because of the similarity in size and shape of most of the brain structures between Siberian hamsters and mice. For the preparation of the photomicrographs, we used Adobe Photoshop CS5 (Adobe Systems) only to adjust the brightness, contrast and sharpness, to remove artifactual obstacles (i.e., obscuring bubbles) and to make the composite plates.
Data were analyzed by one-way repeated measures analysis of variance (ANOVA) followed by Holm-Sidak’s or Bonferroni’s least significant difference (PLSD) post-hoc tests using NCSS (version 2007, Kaysville, UT). Western blot values were analyzed by ANOVA and Student’s t-test. Significance was set at P < 0.05. For simplicity and clarity, exact test results and exact P values are not presented.
RESULTS
Weekly body mass and food intake
Chronic LD + MEL injections and SD photoperiod exposure caused decreases in body mass from Week 2 that became statistically significant starting Week 4 until the end of the experimental period (P < 0.05; Fig. 1A). Weekly food intake did not differ between groups until Week 3 whereupon food intake was suppressed in the chronic LD + MEL and SD photoperiod groups compared to that of the LD + VEH group starting Week 5 (P < 0.05; Fig. 1B). In accordance with our previous studies [2, 21], consistent decreases in body mass preceded intermittent decreases in food intake in LD + MEL-treated or SD photoperiod-exposed hamsters suggesting that SD-related changes in food intake are likely a consequence of changes in body mass. In order to examine if body mass differences between the groups were due to the developmental increases in body mass in LD + VEH animals, we compared body mass losses of SD animals at each weekly point to the baseline body mass (data not shown). None of the body mass losses of SD animals throughout 10 weeks were significantly lower than those at the baseline (P values ranging from 0.2 to 0.993) suggesting that SD photoperiod affects not only reproductive function but also downregulates developmental processes. These changes may represent adaptive preparatory responses to enhance winter survival in Siberian hamsters.
Fig. 1.
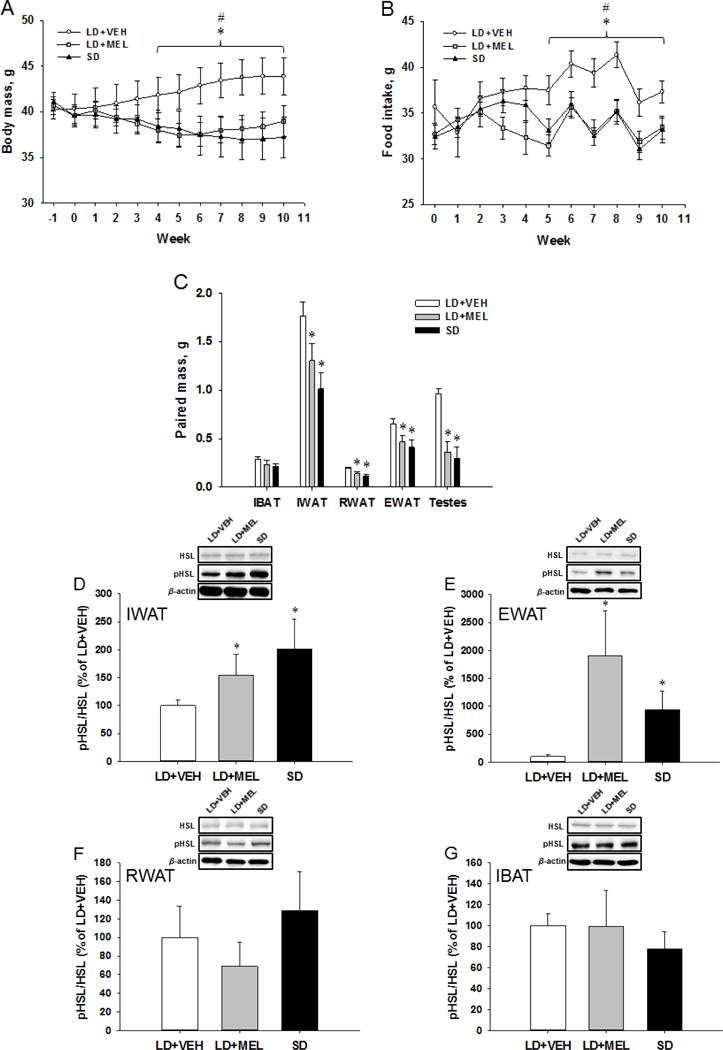
(A) Weekly body mass gain and (B) food intake. (C) Paired adipose and testes masses following 10 weeks of chronic MEL or SD exposure. Ratios of phosphorylated hormone-sensitive lipase (pHSL) over the total HSL are shown in the (D) IWAT, (E) EWAT, (F) RWAT and (G) IBAT fat depots of Siberian hamsters after 10-week MEL injections or SD exposure. Data are presented as percentage values normalized to LD + VEH controls. n = 15. *P < 0.05 vs. LD + MEL, #P < 0.05 vs. SD.
Adipose tissue and testes masses
Terminal adipose tissue analyses indicated that chronic LD + MEL or SD photoperiod induced marked decreases in fat mass. Specifically, in both the LD + MEL and SD groups IWAT, RWAT and EWAT fat pad mass was profoundly lower than in the LD + VEH group whereas IBAT fat pad mass was not significantly different among the groups (P < 0.05; Fig. 1C). WAT mass decreases were accompanied with one of the most obvious physiological changes that occur in response to SD-like MEL signaling, that is, testes regression. Hamsters in the LD + MEL and SD groups had significantly reduced paired testis size and mass compared with the LD + VEH group (P < 0.05; Fig. 1C). These results are in line with previous studies by us [2, 22] and others [23]. Five hamsters whose testes did not regress in response to LD + MEL treatment or SD photoperiod were considered non-responders and excluded from the study. Four hamsters failed to respond to the MEL treatment and also were excluded.
Effects of MEL and photoperiod on lipolytic activity
To measure changes in lipolytic activity, we performed Western blot analysis for HSL and pHSL in adipose tissue. The necessity of HSL for SNS-induced lipolysis has been previously demonstrated by a severe reduction of lipolysis products, i.e. glycerol and free fatty acids, in isolated adipocytes from HSL knockout mice [24]. SNS stimulation in WAT activates protein kinase A (PKA), which subsequently phosphorylates HSL at three serine sites 563, 659 and 660 in rodents, leading to the translocation of HSL to lipid droplets [25]. Activated PKA also phosphorylates perilipin A on lipid droplets, which functions as a scaffolding protein exposing the lipid droplet to HSL. Therefore, the ratio of pHSL/HSL provides important information indicating increases/decreases of lipolysis. This ratio was quantified by dividing the optical density for the signal produced from pHSL by the optical density for total HSL and normalized to the LD + VEH control group. There was a significant increase in the ratio of pHSL to HSL in the chronic LD + MEL and SD photoperiod groups compared with the LD + VEH group in the IWAT (P < 0.05; Fig. 1D) and EWAT (P < 0.05; Fig. 1E). No significant differences were observed between groups in the ratio of pHSL to HSL in either the RWAT (Fig. 1F) or IBAT (Fig. 1G).
Effects of MEL and photoperiod on the browning of WAT
To detect browning of WAT depots, we also performed Western blots for the markers of white adipocyte browning, thermogenic 32-kDa UCP-1 and ~91 kDa PGC1α, which induces the transcription of downstream thermogenic genes, including UCP-1 [15]. UCP1 and PGC1α protein levels were significantly higher in the IWAT of the chronic LD + MEL and SD groups compared with the LD + VEH group (P < 0.05; Fig. 2A,E). In addition, the SD group had a tendency of higher UCP1 and PGC1α protein compared with the LD + MEL group, however without statistical significance (Fig. 2A,E). Similarly, UCP1 protein was found to be significantly higher (P < 0.05) in the EWAT of the chronic LD + MEL and SD groups than in controls (P < 0.05 vs. SD; Fig. 2B). We also found UCP1 levels were significantly higher in the EWAT of LD + MEL group than that of the SD group (P < 0.05; Fig. 2B). Surprisingly, PGC1α protein in the EWAT was significantly lower in the LD + MEL and SD groups compared with the LD + VEH controls (P < 0.05; Fig. 2F). UCP-1 and PGC1α protein in the RWAT was significantly higher in the chronic LD + MEL and SD groups when compared with the LD + VEH controls (P < 0.05; Fig. 2C,G). There also were significantly higher levels of UCP1 in the SD group compared with the LD + MEL group (P < 0.05; Fig. 2C). UCP-1 protein in the IBAT was significantly higher in the chronic LD + MEL and SD groups as compared with the LD + VEH group (P < 0.05; Fig. 2D). There were no significant differences in PGC1α protein levels between groups (Fig. 2H).
Fig. 2.
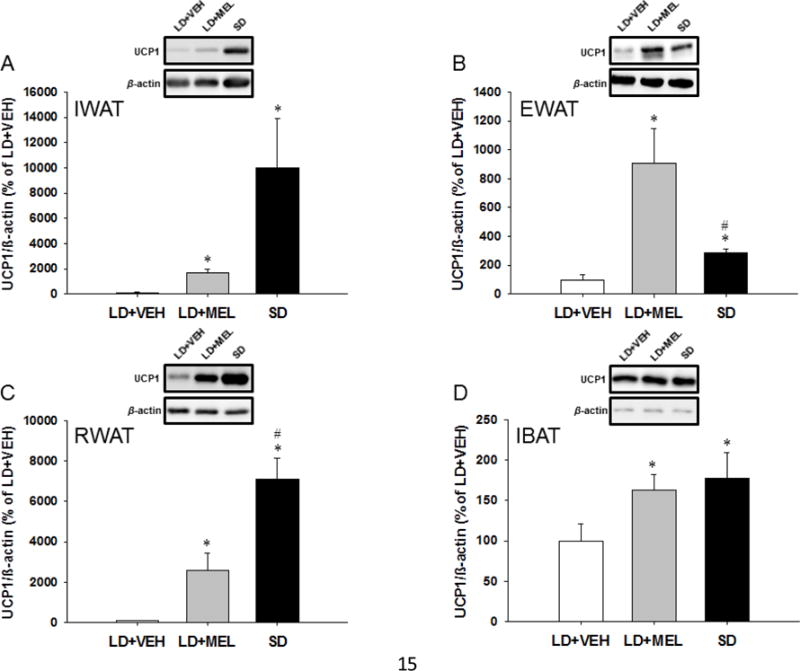
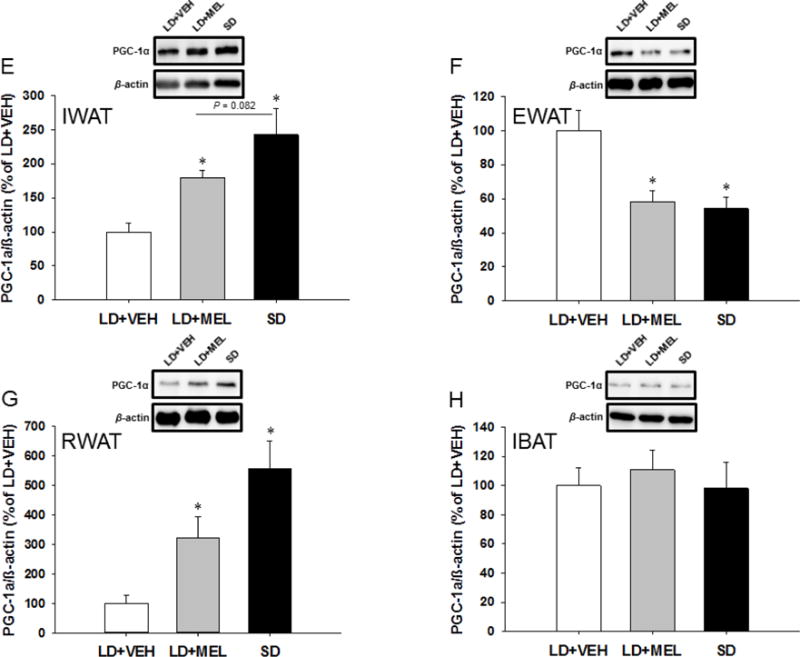
Effect of MEL administration or SD exposure on browning. UCP1 and PGC-1α protein expression in (A,E) IWAT, (B,F) EWAT, (C,G) RWAT and (D,H) IBAT. n = 15. *P < 0.05 vs. LD + VEH, #P < 0.05 vs. LD + MEL.
Co-localization of MEL1a and dopamine beta-hydroxylase
On the basis of our previous finding that SD photoperiod increases the SNS drive to WAT [9] and demonstration that surgical SNS denervation of WAT blocks SD-induced lipid mobilization [26], we performed immunohistochemistry for the MEL 1a and the marker for the central noradrenergic nervous system DBH to determine whether MEL1a was co-localized in the central SNS circuits ultimately innervating WAT.
The results of the immunohistochemical analysis revealed clusters of neurons containing MEL1a-ir, DBH-ir and MEL1a + DBH-ir in a variety of brain regions [higher magnification images of the (a) arcuate nucleus (Arc), (b) paraventricular hypothalamic nucleus (PVH), (c) nucleus accumbens (Acb) and (d-f) locus coeruleus (LC) are shown in Fig. 3].
Fig. 3.
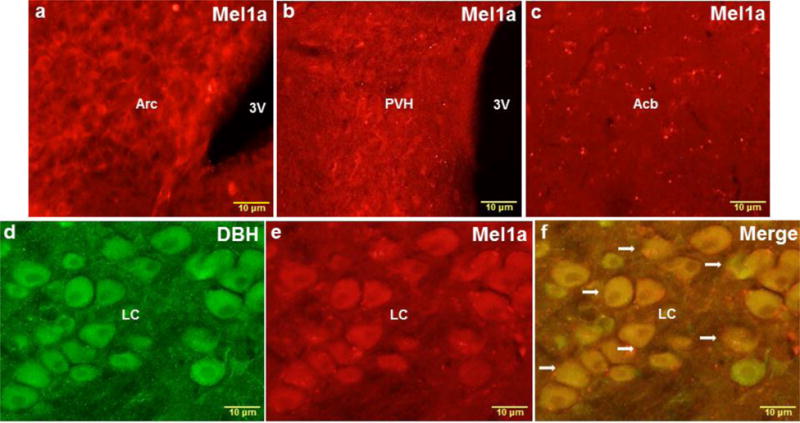
Representative higher magnification images of the Arc (a), PVH (b), Acb (c) and LC (d-f) showing single MEL1a (red), single DBH (green) and colocalized DBH + MEL1a (arrows) immunostaining. 3V, third ventricle; Acb, nucleus accumbens; Arc, arcuate nucleus; LC, locus coeruleus; PVH, paraventricular hypothalamic nucleus. n = 15. Scale bar = 10 μm.
Chronic LD + MEL and/or SD photoperiod significantly increased the numbers of MEL1a-ir neurons in multiple brain regions. Specifically, MEL1a-ir was significantly greater in the DMH, PVH and suprachiasmatic nucleus (SCh) of the hypothalamus; and the HDB of the anterior forebrain in both LD + MEL and SD groups than in the LD + VEH group (Ps < 0.05, Fig. 7A). In addition, we observed greater MEL1a-ir in the LD + MEL but not the SD photoperiod in the Acb (P < 0.05, Fig. 7A). In the PVA and Arc MEL1a-ir was greater in the SD group compared with the LD + VEH group (P < 0.05, Fig. 7A). MEL1a-ir in the LC of the midbrain appeared to be greater in the SD photoperiod group than in the LD + VEH group although this difference did not reach statistical significance (Fig. 7A).
Fig. 7.
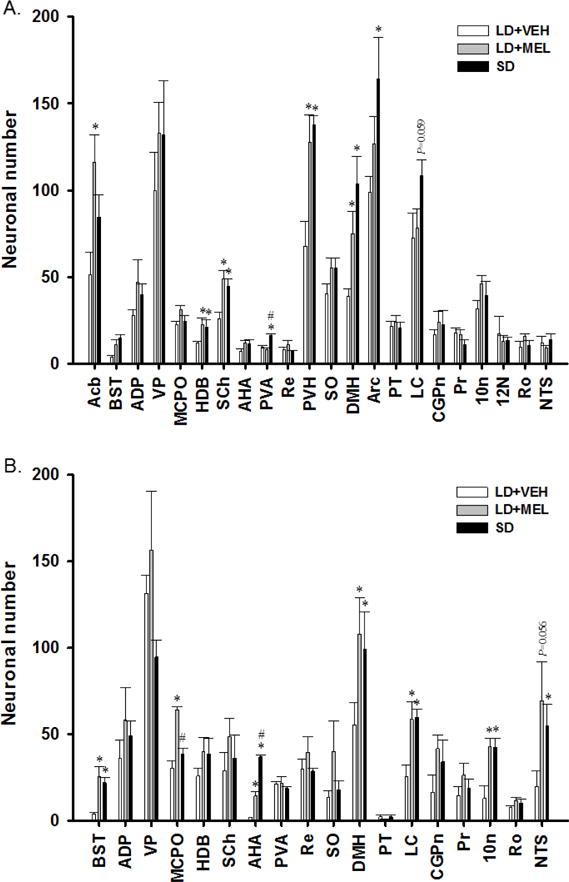
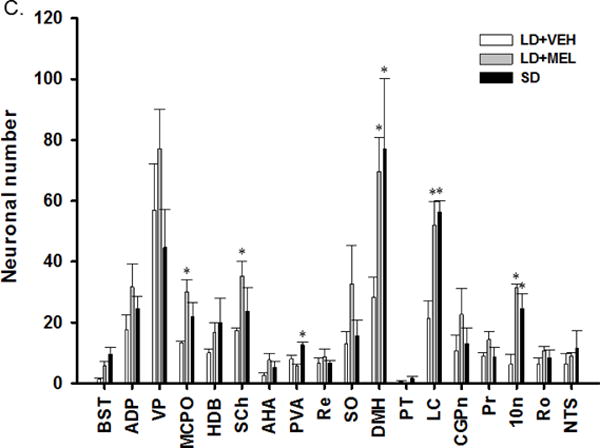
Quantification analyses of (A) single MEL1a, (B) single DBH and (C) double MEL1a + DBH immunoreactive neurons in the brain of Siberian hamsters following 10 weeks of vehicle injections, MEL injections and SD exposure. 10N, dorsal motor nucleus of vagus; 12N, hypoglossal nucleus; Acb, accumbens nucleus; ADP, anterodorsal preoptic nucleus; AHA, anterior hypothalamic area, anterior part; Arc, arcuate hypothalamic nucleus; BST, bed nucleus of the stria terminalis; CGPn, central gray of the pons; DMH, dorsomedial hypothalamic nucleus; HDB, nucleus of the horizontal limb of the diagonal band; LC, locus coeruleus; MCPO, magnocellular preoptic nucleus; NTS, nucleus of the solitary tract; Pr, prepositus nucleus; PT, pars tuberalis; PVA, paraventricular thalamic nucleus, anterior part; PVH, paraventricular hypothalamic nucleus; Re, reuniens thalamic nucleus; Ro, nucleus of Roller; SCh, suprachiasmatic nucleus; SO, supraoptic nucleus; VP, ventral pallidum. n = 15. *P < 0.05 vs. LD + VEH.
Chronic LD + MEL and/or SD exposure also had a profound effect on DBH-ir. Both LD + MEL and SD photoperiod exposure resulted in higher DBH-ir in multiple brain regions, including the dorsal motor nucleus of vagus (10N) (Fig. 4 and 7B), LC (Fig. 5 and 7B), DMH (Fig. 7B) as well as the bed nucleus of the stria terminalis (BST), magnocellular preoptic nucleus (MCPO) and anterior hypothalamic area (AHA) (Ps < 0.05, Fig 7B) than in the LD + VEH group. SD exposed hamsters had significantly more DBH-ir cells in the nucleus of the solitary tract (NTS) (Fig. 7B). Although LD + MEL treatment tended to result in more DBH-ir in the NTS than in hamsters treated with LD + VEH, this difference did not reach statistical significance (Fig. 4 and 7B).
Fig. 4.
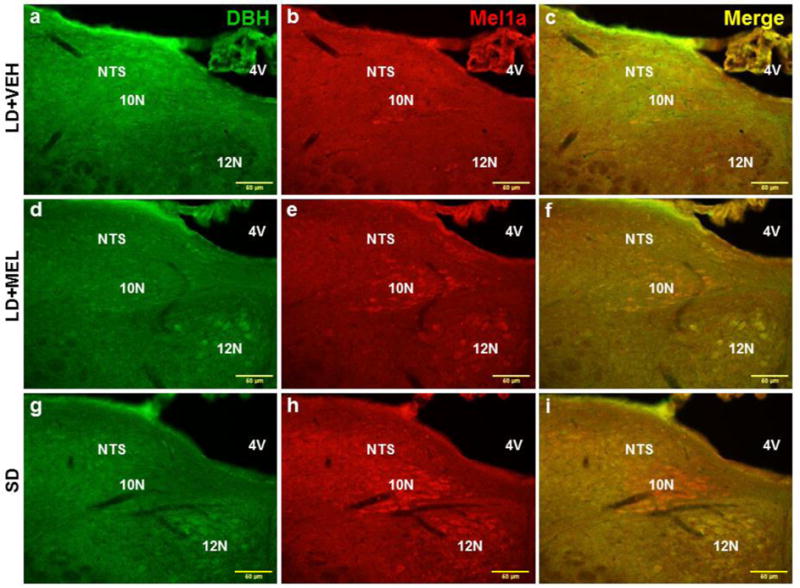
Representative photomicrographs illustrating single DBH (green), single MEL1a (red) and colocalized DBH + MEL1a (yellow) immunostaining in the 10N and NTS after 10 weeks of vehicle treatment (a-c), chronic MEL treatment (d-f) and SD photoperiod exposure (g-i). 4V, forth ventricle; 10N, dorsal motor nucleus of vagus; 12N, hypoglossal nucleus; NTS, nucleus of the solitary tract. n = 15. Scale bar = 50 μm.
Fig. 5.
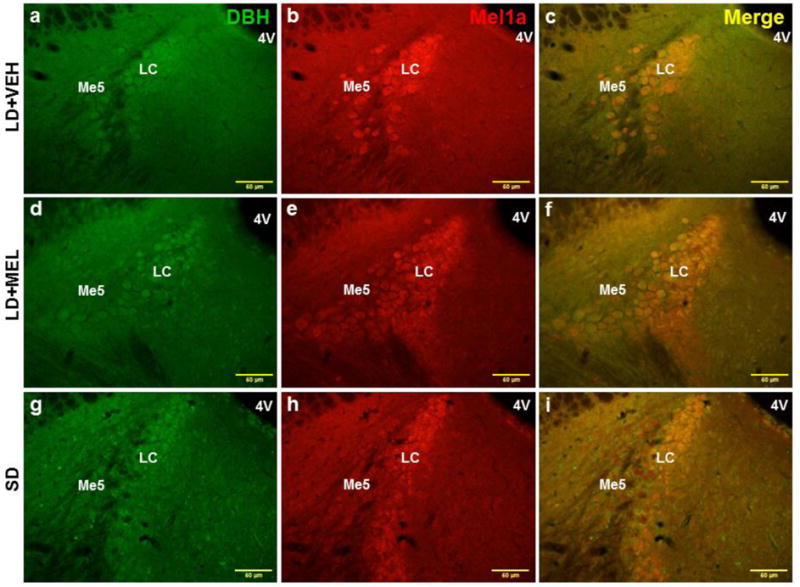
Representative photomicrographs illustrating single DBH (green), single MEL1a (red) and colocalized DBH + MEL1a (yellow) immunostaining in the LC after 10 weeks of vehicle treatment (a-c), chronic MEL treatment (d-f) and SD photoperiod exposure (g-i). 4V, forth ventricle; LC, locus coeruleus; Me5, mesencephalic trigeminal nucleus. n = 15. Scale bar = 50 μm.
Lastly, the numbers of double-labeled MEL1a + DBH-ir neurons were significantly higher in the chronic LD + MEL and SD groups as compared to the LD + VEH controls in the 10N of the hindbrain (Fig. 4 and 7C); the LC of the midbrain (Fig. 5 and 7C) and DMH (Fig. 7C) of the hypothalamus (Ps < 0.05).
The LD + MEL group, but not the SD group had significantly greater colocalization of MEL1a + DBH-ir in the SCh (Fig. 6) and MCPO while in the SD group MEL1a + DBH-ir colocalization was statistically higher in the PVA compared with the LD + VEH group (Ps < 0.05; Fig. 7C).
Fig. 6.
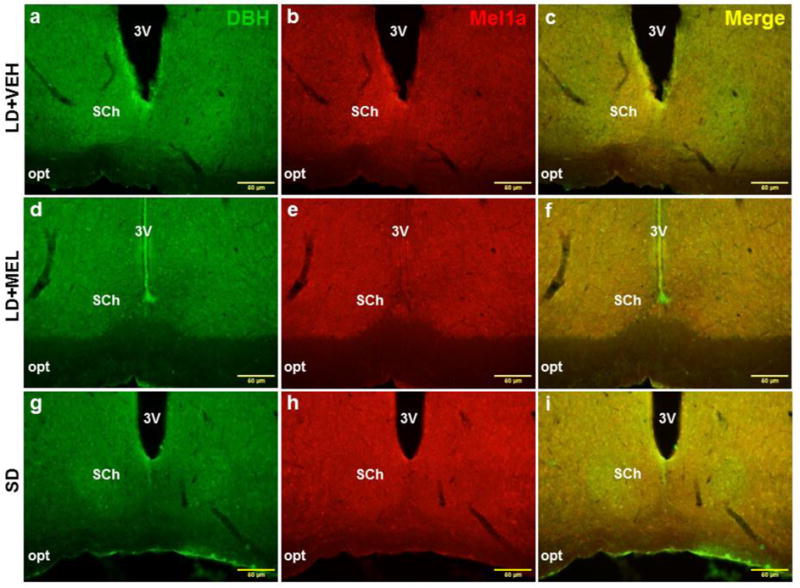
Representative photomicrographs illustrating single DBH (green), single MEL1a (red) and colocalized DBH + MEL1a (yellow) immunostaining in the SCh after 10 weeks of vehicle treatment (a-c), chronic MEL treatment (d-f) and SD photoperiod exposure (g-i). 3V, third ventricle; opt, optic tract; SCh, suprachiasmatic nucleus. n = 15. Scale bar = 50 μm.
DISCUSSION
The data obtained in the present study support the hypothesis that MEL-driven seasonally adaptive losses in body fat are due to SNS-stimulated lipolysis, browning of WAT and increased energy expenditure as a result of enhanced UCP1 expression in the BAT. More specifically, we found that MEL administration to hamsters housed in LD or exposure to SD significantly decreased the RWAT, IWAT, EWAT, food intake and caused testicular regression compared to hamsters housed in LD and administered vehicle. MEL administration as well as SD exposure also induced lipolysis in IWAT and EWAT, browning of RWAT, IWAT, and EWAT, and increased UCP1 expression in the IBAT. Furthermore, these studies demonstrated for the first time that LD + MEL and SD photoperiod exposure increased MEL1a receptor protein expression and overall noradrenergic tone within the brain. Importantly, MEL1a was found on the SNS efferent neurons throughout the brain regions previously reported to be the SNS outflow to WAT and IBAT depots [8, 27–32]. Taken together, these findings reveal a distributed neural system that integrates the impact of “winter-like” MEL signaling on the SNS to trigger obesity reversal by vast WAT browning phenomenon.
Consistent with our previous study [2], we found that chronic LD + MEL and SD photoperiod exposure caused a profound reduction in fat mass. It was previously reported that MEL-induced decreases in body mass could be attributed to IBAT nonshivering thermogenesis, increased locomotor activity and basal metabolic rate (for review see: [10, 11, 33]), despite some suggestion to the contrary [34]. Yet, regardless of the significant reductions in WAT mass, the IBAT mass remained unchanged supporting inefficiency of either LD + MEL or SD photoperiod to stimulate IBAT lipolysis in this study. This suggests that LD + MEL- and SD-induced decreases in adiposity of Siberian hamsters may be accounted for by a coordinated suite of lipolytic changes in the WAT, but not the IBAT, ultimately facilitating lipid mobilization and utilization of WAT lipid fuels essential for the IBAT thermogenesis.
Given that activation of the SNS innervation of WAT is the principal trigger of lipolysis via β3-AR stimulation in all mammals (for review see: [35–37]), we measured lipid mobilization with HSL and pHSL, in all fat pads diminished by LD + MEL or SD exposure. In the present study, only the IWAT and EWAT of LD + MEL and SD exposed hamsters had increased lipid mobilization as seen by the elevated pHSL/HSL ratio whereas the IBAT and RWAT did not appear to incur lipolysis responding to the same conditions. While the absence of pronounced lipolysis in the IBAT is not surprising given its primary role as an effector of nonshivering thermogenesis, RWAT mass was profoundly diminished by MEL/SD exposure despite no significant changes in lipolytic activity. In this regard, we previously demonstrated that RWAT β3-AR protein expression, though increased after 5 weeks of SD exposure, was unaffected after 10 weeks [17]. This suggests that RWAT lipolysis occurred at an earlier time point. Ten weeks of daily MEL injections or SD photoperiod exposure resulted in dramatic reduction of the RWAT size, which in addition, almost completely browned in comparison with the larger and white RWAT of vehicle-treated littermates (unpublished observations). Together, these data suggest that the RWAT might undergo faster lipid mobilization comparing to the IWAT or EWAT in response to LD + MEL/SD photoperiod, perhaps, due to ongoing browning.
The ability to harness thermogenic power by converting white adipocytes to a beige phenotype by increasing SNS drive is an attractive perspective for obesity reversal (for review see: [12]). Evidence suggests that recruitment of classical brown adipocytes in WAT induced by various metabolic stimuli (i.e., cold exposure, browning agents), primarily is due to SNS-induced β3-AR stimulation (for review see: [12, 13]). This process generates UCP1, which uncouples oxidative phosphorylation from ATP synthesis, releasing chemical energy as heat. Specifically, the expression of UCP1 is regulated by the transcriptional factor associated with the ‘thermogenic program’, PGC-1α ([14]; for review see: [15]). The key support favoring the SNS-induced WAT browning rests on several findings: (1) the specific and potent β3-AR agonist CL316,243 induces multilocular BAT-pertaining phenotype of adipocytes [16], (2) the density of the SNS innervation correlates with the production of the brown/beige adipocytes within the WAT [38] and (3) Siberian hamsters transferred from LD to SD photoperiod in the laboratory without decreases in ambient temperature exhibit increased β3-AR, PGC-1α and UCP1 mRNA expression in the RWAT (the only WAT pad examined at that time) [17]. Interestingly, oral MEL has been recently found to trigger browning of the IWAT in laboratory Zucker diabetic fatty rats [39]. In the present study, both chronic LD + MEL and SD photoperiod exposure increased UCP1 protein in all fat depots tested indicating the existence of a generalized browning phenomenon. SD exposure appeared to have a more profound effect on WAT browning compared to MEL suggesting that under SD conditions Siberian hamsters exhibit more effective browning potential. In spite of elevated PGC-1α protein in the RWAT and IWAT induced by MEL or SD exposure, PGC-1α levels in the IBAT was not altered across all the groups. This finding could be explained by a ceiling effect on the quantities of PGC-1α that naturally inhabit IBAT given its role in thermogenesis-related mitochondrial function ([40]), [41–44], for review see: [33]).
Surprisingly, despite increased browning of the EWAT, protein for PGC-1α was significantly diminished by LD + MEL/SD exposure. Mitochondrial biogenesis/energy metabolism, with PGC-1α as a master regulator, is essential for the normal physiological functioning of the testes, which is a highly active reproductive organ heavily dependent on mitochondrial energy consumption. Previous studies have demonstrated the importance of mitochondrial function as well as the EWAT for normal spermatogenesis; that is, testicular mitochondrial impairments or surgical removal of the EWAT could result in testis atrophy, thus deteriorating reproductive function [45–51]. Therefore, the decreased EWAT PGC-1α in LD + MEL/SD exposed animals in this study likely reflected the decreased energy usage of the testes which regress in SDs.
The only brain region that appears to induce browning of the IWAT is the DMH. Specifically, Chao et al. demonstrated that selective knockdown of NPY in the DMH causes IWAT browning and, importantly, chemical IWAT SNS denervation blocks the browning response [18]. NPY knockdown also increases UCP1 expression in both the IWAT and IBAT suggesting enhanced energy expenditure [18]. Siberian hamsters, exposed to SD photoperiod, have an increased SNS drive to WAT [9]. In this regard, we previously demonstrated that MEL1a mRNA is expressed in neurons that comprise the central SNS outflow circuitry from the forebrain [8]. Using DBH immunohistochemistry as a marker for the central noradrenergic system [52], we found that both daily LD + MEL and SD exposure increased MEL1a immunostaining and overall sympathetic tone within the brain. More specifically, the hypothalamic DMH, the midbrain LC, and the hindbrain 10N contained the highest number of catecholaminergic neurons expressing MEL1a in response to MEL/SD signals. Whereas the role of the DMH in IWAT browning was mentioned, the roles of the LC and 10N in triggering SD responses remain elusive. The LC influences the SNS outflow to the cardiovascular system via noradrenergic coeruleo-vasomotor and coeruleo-spinal pathways [53–56] and regulates autonomic function via direct projections to the SNS preganglionic neurons in the spinal cord [57–62] and, notably, via direct projections to autonomic nuclei including the PVH, 10N, the rostral ventrolateral medulla, the amygdala and several other nuclei, through which the activated LC produces increases in the SNS drive and decreases in the parasympathetic activity (for review see: [63]). Finally, it is worth mentioning that most of these sites comprised the brain circuitries for the SNS outflow to and the sensory inflow from WAT [27, 64–66]. The results of the present study significantly expand our knowledge of the neuroanatomical distribution of MEL1a on the central SNS outflow neurons projecting to WAT in view of the fact that midbrain or hindbrain contributions had not been assessed previously.
Collectively, these results strongly suggest that activation of MEL1a receptors, as the result of SD photoperiod-induced increases in nocturnal MEL, increases SNS activity within dispensed CNS nodes and trigger lipid mobilization and generalized browning, ultimately favoring decreases in adiposity.
Perspectives and Significance.
In conclusion, activation of the SNS innervation of WAT is the principal initiator of stimulated lipolysis. Siberian hamsters have the remarkable ability to naturally combat obesity with the simple change of the photoperiod length that initiates a downstream cascade involving MEL1a – SNS activation – WAT lipolysis – WAT browning. Use of this powerful model of naturally-occurring obesity has the potential to provide a better understanding of lipid mobilization and to define how to harness heat production by browned WAT adipocytes to combat the obesity pandemia.
Acknowledgments
This work was supported by the National Institutes of Health [R37 DK35254 to TJB and R01 DK35254 to BX]. We would like to dedicate this manuscript to the memory of Timothy J. Bartness, given the enormous contribution to photoperiodic influences on energy metabolism made by Tim during his extraordinary career.
Footnotes
Publisher's Disclaimer: This is a PDF file of an unedited manuscript that has been accepted for publication. As a service to our customers we are providing this early version of the manuscript. The manuscript will undergo copyediting, typesetting, and review of the resulting proof before it is published in its final citable form. Please note that during the production process errors may be discovered which could affect the content, and all legal disclaimers that apply to the journal pertain.
DISCLOSURES
The authors have nothing to disclose.
Uncategorized References
- 1.BARTNESS TJ, HAMILTON JM, WADE GN, et al. Regional differences in fat pad responses to short days in Siberian hamsters. Am J Physiol. 1989;257:R1533–R1540. doi: 10.1152/ajpregu.1989.257.6.R1533. [DOI] [PubMed] [Google Scholar]
- 2.WADE GN, BARTNESS TJ. Effects of photoperiod and gonadectomy on food intake, body weight and body composition in Siberian hamsters. Am J Physiol. 1984;246:R26–R30. doi: 10.1152/ajpregu.1984.246.1.R26. [DOI] [PubMed] [Google Scholar]
- 3.BARTNESS TJ, POWERS JB, HASTINGS MH, et al. The timed infusion paradigm for melatonin delivery: What has it taught us about the melatonin signal, its reception, and the photoperiodic control of seasonal responses? J Pineal Res. 1993;15:161–190. doi: 10.1111/j.1600-079x.1993.tb00903.x. [DOI] [PubMed] [Google Scholar]
- 4.BARTNESS TJ, DEMAS GE, SONG CK. Seasonal changes in adiposity: the roles of the photoperiod, melatonin and other hormones and the sympathetic nervous system. Exp Biol Med. 2002;227:363–376. doi: 10.1177/153537020222700601. [DOI] [PubMed] [Google Scholar]
- 5.ROCA AL, GODSON C, WEAVER DR, et al. Structure, characterization, and expression of the gene encoding the mouse Mel1a melatonin receptor. Endocrinology. 1996;137:3469–3477. doi: 10.1210/endo.137.8.8754776. [DOI] [PubMed] [Google Scholar]
- 6.NG TB, WONG CM. Effects of pineal indoles and arginine vasotocin on lipolysis and lipogenesis in isolated adipocytes. J Pineal Res. 1986;3:55–66. doi: 10.1111/j.1600-079x.1986.tb00726.x. [DOI] [PubMed] [Google Scholar]
- 7.BARTNESS TJ, LIU Y, SHRESTHA YB, et al. Neural innervation of white adipose tissue and the control of lipolysis. Front Neuroendocrinol. 2014;35:473–93. doi: 10.1016/j.yfrne.2014.04.001. [DOI] [PMC free article] [PubMed] [Google Scholar]
- 8.SONG CK, BARTNESS TJ. CNS sympathetic outflow neurons to white fat that express melatonin receptors may mediate seasonal adiposity. Am J Physiol. 2001;281:R666–R672. doi: 10.1152/ajpregu.2001.281.2.R666. [DOI] [PubMed] [Google Scholar]
- 9.YOUNGSTROM TG, BARTNESS TJ. Catecholaminergic innervation of white adipose tissue in the Siberian hamster. Am J Physiol. 1995;268:R744–R751. doi: 10.1152/ajpregu.1995.268.3.R744. [DOI] [PubMed] [Google Scholar]
- 10.TAN DX, MANCHESTER LC, FUENTES-BROTO L, et al. Significance and application of melatonin in the regulation of brown adipose tissue metabolism: relation to human obesity. Obes Rev. 2011;12:167–188. doi: 10.1111/j.1467-789X.2010.00756.x. [DOI] [PubMed] [Google Scholar]
- 11.CANNON B, NEDERGAARD J. Brown adipose tissue: function and physiological significance. Physiol Rev. 2004;84:277–359. doi: 10.1152/physrev.00015.2003. [DOI] [PubMed] [Google Scholar]
- 12.BARTNESS TJ, RYU V. Neural control of white, beige and brown adipocytes. Int J Obes Suppl. 2015;5:S35–9. doi: 10.1038/ijosup.2015.9. [DOI] [PMC free article] [PubMed] [Google Scholar]
- 13.NEDERGAARD J, CANNON B. The browning of white adipose tissue: some burning issues. Cell Metab. 2014;20:396–407. doi: 10.1016/j.cmet.2014.07.005. [DOI] [PubMed] [Google Scholar]
- 14.BARBERA MJ, SCHLUTER A, PEDRAZA N, et al. Peroxisome proliferator-activated receptor alpha activates transcription of the brown fat uncoupling protein-1 gene. A link between regulation of the thermogenic and lipid oxidation pathways in the brown fat cell J Biol Chem. 2001;276:1486–1493. doi: 10.1074/jbc.M006246200. [DOI] [PubMed] [Google Scholar]
- 15.HARMS M, SEALE P. Brown and beige fat: development, function and therapeutic potential. Nat Med. 2013;19:1252–1263. doi: 10.1038/nm.3361. [DOI] [PubMed] [Google Scholar]
- 16.HIMMS-HAGEN J, CUI J, DANFORTH E, et al. Effect of CL-316,243, a thermogenic beta-3 agonist, on energy balance and brown and white adipose tissues in rats. Am J Physiol. 1994;266:R1371–R1382. doi: 10.1152/ajpregu.1994.266.4.R1371. [DOI] [PubMed] [Google Scholar]
- 17.DEMAS GE, BOWERS RR, BARTNESS TJ, et al. Photoperiodic regulation of gene expression in brown and white adipose tissue of Siberian hamsters (Phodopus sungorus) Am J Physiol. 2002;282:R114–R121. doi: 10.1152/ajpregu.2002.282.1.R114. [DOI] [PubMed] [Google Scholar]
- 18.CHAO PT, YANG L, AJA S, et al. Knockdown of NPY Expression in the Dorsomedial Hypothalamus Promotes Development of Brown Adipocytes and Prevents Diet-Induced Obesity. Cell Metab. 2011;13:573–583. doi: 10.1016/j.cmet.2011.02.019. [DOI] [PMC free article] [PubMed] [Google Scholar]
- 19.WOOD AD, BARTNESS TJ. Food deprivation-induced increases in hoarding by Siberian hamsters are not photoperiod-dependent. Physiol Behav. 1996;60:1137–1145. doi: 10.1016/0031-9384(96)00173-4. [DOI] [PubMed] [Google Scholar]
- 20.PAXINOS G, FRANKLIN KBJ. The Mouse Brain in Stereotaxic Coordinates. Academic Press; New York: p. 2007. [Google Scholar]
- 21.WADE GN, BARTNESS TJ. Dietary obesity in hamsters: Effects of age, fat source and species. Nutrition and Behavior. 1983;1:169–177. [Google Scholar]
- 22.BARTNESS TJ, WADE GN. Photoperiodic control of body weight and energy metabolism in Syrian hamsters (Mesocricetus auratus): Role of pineal gland, melatonin, gonads, and diet. Endocrinology. 1984;114:492–498. doi: 10.1210/endo-114-2-492. [DOI] [PubMed] [Google Scholar]
- 23.HIEBERT SM, GREEN SA, YELLON SM. Daily timed melatonin feedings mimic effects of short days on testis regression and cortisol in circulation in Siberian hamsters. Gen Comp Endocrinol. 2006;146:211–216. doi: 10.1016/j.ygcen.2005.11.004. [DOI] [PubMed] [Google Scholar]
- 24.MULDER H, SORHEDE-WINZELL M, CONTRERAS JA, et al. Hormone-sensitive lipase null mice exhibit signs of impaired insulin sensitivity whereas insulin secretion is intact. J Biol Chem. 2003;278:36380–36388. doi: 10.1074/jbc.M213032200. [DOI] [PubMed] [Google Scholar]
- 25.HOLM C. Molecular mechanisms regulating hormone-sensitive lipase and lipolysis. Biochemical Society Transactions. 2003;31:1120–1124. doi: 10.1042/bst0311120. [DOI] [PubMed] [Google Scholar]
- 26.YOUNGSTROM TG, BARTNESS TJ. White adipose tissue sympathetic nervous system denervation increases fat pad mass and fat cell number. Am J Physiol. 1998;275:R1488–R1493. doi: 10.1152/ajpregu.1998.275.5.R1488. [DOI] [PubMed] [Google Scholar]
- 27.BAMSHAD M, AOKI VT, ADKISON MG, et al. Central nervous system origins of the sympathetic nervous system outflow to white adipose tissue. Am J Physiol. 1998;275:R291–R299. doi: 10.1152/ajpregu.1998.275.1.R291. [DOI] [PubMed] [Google Scholar]
- 28.ADLER ES, HOLLIS JH, CLARKE IJ, et al. Neurochemical characterization and sexual dimorphism of projections from the brain to abdominal and subcutaneous white adipose tissue in the rat. J Neurosci. 2012;32:15913–15921. doi: 10.1523/JNEUROSCI.2591-12.2012. [DOI] [PMC free article] [PubMed] [Google Scholar]
- 29.BOWERS RR, FESTUCCIA WTL, SONG CK, et al. Sympathetic innervation of white adipose tissue and its regulation of fat cell number. Am J Physiol. 2004;286:R1167–R1175. doi: 10.1152/ajpregu.00558.2003. [DOI] [PubMed] [Google Scholar]
- 30.NGUYEN NL, RANDALL J, BANFIELD BW, et al. Central sympathetic innervations to visceral and subcutaneous white adipose tissue. Am J Physiol Regul Integr Comp Physiol. 2014 doi: 10.1152/ajpregu.00552.2013. [DOI] [PMC free article] [PubMed] [Google Scholar]
- 31.SHI H, BARTNESS TJ. Neurochemical phenotype of sympathetic nervous system outflow from brain to white fat. Brain Res Bull. 2001;54:375–385. doi: 10.1016/s0361-9230(00)00455-x. [DOI] [PubMed] [Google Scholar]
- 32.SONG CK, VAUGHAN CH, KEEN-RHINEHART E, et al. Melanocortin-4 receptor mRNA expressed in sympathetic outflow neurons to brown adipose tissue: Neuroanatomical and functional evidence. Am J Physiol. 2008;295:R417–R428. doi: 10.1152/ajpregu.00174.2008. [DOI] [PMC free article] [PubMed] [Google Scholar]
- 33.NAVARRO-ALARCON M, RUIZ-OJEDA FJ, BLANCA-HERRERA RM, et al. Melatonin and metabolic regulation: a review. Food Funct. 2014;5:2806–32. doi: 10.1039/c4fo00317a. [DOI] [PubMed] [Google Scholar]
- 34.FEIST DD, FEIST CF. Effects of cold, short day and melatonin on thermogenesis, body weight and reproductive organs in Alaskan red-backed voles. J Comp Physiol B. 1986;156:741–6. doi: 10.1007/BF00692753. [DOI] [PubMed] [Google Scholar]
- 35.BARTNESS TJ, BAMSHAD M. Innervation of mammalian white adipose tissue: Implications for the regulation of total body fat. Am J Physiol. 1998;275:R1399–R1411. doi: 10.1152/ajpregu.1998.275.5.R1399. [DOI] [PubMed] [Google Scholar]
- 36.BARTNESS T, LIU Y, SHRESTHA Y, et al. Neural innervation of white adipose tissue and the control of lipolysis. Frontiers in neuroendocrinology. 2014;35:473–93. doi: 10.1016/j.yfrne.2014.04.001. [DOI] [PMC free article] [PubMed] [Google Scholar]
- 37.BARTNESS TJ, SHRESTHA YB, VAUGHAN CH, et al. Sensory and sympathetic nervous system control of white adipose tissue lipolysis. Mol Cell Endocrinol. 2010;318:34–43. doi: 10.1016/j.mce.2009.08.031. [DOI] [PMC free article] [PubMed] [Google Scholar]
- 38.VITALI A, MURANO I, ZINGARETTI MC, et al. The adipose organ of obesity-prone C57BL/6J mice is composed of mixed white and brown adipocytes. J Lipid Res. 2012;53:619–629. doi: 10.1194/jlr.M018846. [DOI] [PMC free article] [PubMed] [Google Scholar]
- 39.JIMENEZ-ARANDA A, FERNANDEZ-VAZQUEZ G, CAMPOS D, et al. Melatonin induces browning of inguinal white adipose tissue in Zucker diabetic fatty rats. J Pineal Res. 2013;55:416–23. doi: 10.1111/jpi.12089. [DOI] [PubMed] [Google Scholar]
- 40.JIMENEZ-ARANDA A, FERNANDEZ-VAZQUEZ G, MOHAMMAD ASM, et al. Melatonin improves mitochondrial function in inguinal white adipose tissue of Zucker diabetic fatty rats. J Pineal Res. 2014;57:103–9. doi: 10.1111/jpi.12147. [DOI] [PubMed] [Google Scholar]
- 41.BOSTROM P, WU J, JEDRYCHOWSKI M. A PGC1-[agr]-dependent myokine that drives brown-fat-like development of white fat and thermogenesis. Nature. 2012 doi: 10.1038/nature10777. advance online publication. [DOI] [PMC free article] [PubMed] [Google Scholar]
- 42.ST-PIERRE J, LIN J, KRAUSS S, et al. Bioenergetic analysis of peroxisome proliferator-activated receptor gamma coactivators 1alpha and 1beta (PGC-1alpha and PGC-1beta) in muscle cells. J Biol Chem. 2003;278:26597–26603. doi: 10.1074/jbc.M301850200. [DOI] [PubMed] [Google Scholar]
- 43.KATO H, TANAKA G, MASUDA S, et al. Melatonin promotes adipogenesis and mitochondrial biogenesis in 3T3-L1 preadipocytes. J Pineal Res. 2015;59:267–75. doi: 10.1111/jpi.12259. [DOI] [PubMed] [Google Scholar]
- 44.GUO P, PI H, XU S, et al. Melatonin Improves mitochondrial function by promoting MT1/SIRT1/PGC-1 alpha-dependent mitochondrial biogenesis in cadmium-induced hepatotoxicity in vitro. Toxicol Sci. 2014;142:182–95. doi: 10.1093/toxsci/kfu164. [DOI] [PMC free article] [PubMed] [Google Scholar]
- 45.AMARAL S, MOTA P, RODRIGUES AS, et al. Testicular aging involves mitochondrial dysfunction as well as an increase in UCP2 levels and proton leak. FEBS Lett. 2008;582:4191–6. doi: 10.1016/j.febslet.2008.11.020. [DOI] [PubMed] [Google Scholar]
- 46.CUMMINS JM, JEQUIER AM, KAN R. Molecular biology of human male infertility: links with aging, mitochondrial genetics, and oxidative stress? Mol Reprod Dev. 1994;37:345–62. doi: 10.1002/mrd.1080370314. [DOI] [PubMed] [Google Scholar]
- 47.JOSEPH AM, NGUYEN LM, WELTER AE, et al. Mitochondrial adaptations evoked with exercise are associated with a reduction in age-induced testicular atrophy in Fischer-344 rats. Biogerontology. 2014;15:517–34. doi: 10.1007/s10522-014-9526-z. [DOI] [PMC free article] [PubMed] [Google Scholar]
- 48.FRANK SA, HURST LD. Mitochondria and male disease. Nature. 1996;383:224. doi: 10.1038/383224a0. [DOI] [PubMed] [Google Scholar]
- 49.NAKADA K, SATO A, YOSHIDA K, et al. Mitochondria-related male infertility. Proc Natl Acad Sci U S A. 2006;103:15148–53. doi: 10.1073/pnas.0604641103. [DOI] [PMC free article] [PubMed] [Google Scholar]
- 50.VAZQUEZ-MEMIJE ME, CAPIN R, TOLOSA A, et al. Analysis of age-associated changes in mitochondrial free radical generation by rat testis. Mol Cell Biochem. 2008;307:23–30. doi: 10.1007/s11010-007-9580-9. [DOI] [PubMed] [Google Scholar]
- 51.CHU Y, HUDDLESTON GG, CLANCY AN, et al. Epididymal fat is necessary for spermatogenesis, but not testosterone production or copulatory behavior. Endocrinology. 2010;151:5669–5779. doi: 10.1210/en.2010-0772. [DOI] [PMC free article] [PubMed] [Google Scholar]
- 52.HARTMAN BK, ZIDE D, UDENFRIEND S. The use of dopamine -hydroxylase as a marker for the central noradrenergic nervous system in rat brain. Proc Natl Acad Sci U S A. 1972;69:2722–6. doi: 10.1073/pnas.69.9.2722. [DOI] [PMC free article] [PubMed] [Google Scholar]
- 53.DROLET G, GAUTHIER P. Peripheral and central mechanisms of the pressor response elicited by stimulation of the locus coeruleus in the rat. Can J Physiol Pharmacol. 1985;63:599–605. doi: 10.1139/y85-100. [DOI] [PubMed] [Google Scholar]
- 54.GURTU S, PANT KK, SINHA JN, et al. An investigation into the mechanism of cardiovascular responses elicited by electrical stimulation of locus coeruleus and subcoeruleus in the cat. Brain Res. 1984;301:59–64. doi: 10.1016/0006-8993(84)90402-5. [DOI] [PubMed] [Google Scholar]
- 55.LIGHTMAN SL, TODD K, EVERITT BJ, et al. Ascending brain-stem noradrenergic pathways modulate the renin response to haemorrhage. Clin Sci (Lond) 1984;67:269–72. doi: 10.1042/cs0670269. [DOI] [PubMed] [Google Scholar]
- 56.STOCK G, RUPPRECHT U, STUMPF H, et al. Cardiovascular changes during arousal elicited by stimulation of amygdala, hypothalamus and locus coeruleus. J Auton Nerv Syst. 1981;3:503–10. doi: 10.1016/0165-1838(81)90083-7. [DOI] [PubMed] [Google Scholar]
- 57.BLAIR ML, PIEKUT D, WANT A, et al. Role of the hypothalamic paraventricular nucleus in cardiovascular regulation. Clin Exp Pharmacol Physiol. 1996;23:161–5. doi: 10.1111/j.1440-1681.1996.tb02590.x. [DOI] [PubMed] [Google Scholar]
- 58.SAPER CB, LOEWY AD, SWANSON LW, et al. Direct hypothalamo-autonomic connections. Brain Res. 1976;117:305–12. doi: 10.1016/0006-8993(76)90738-1. [DOI] [PubMed] [Google Scholar]
- 59.SAWCHENKO PE, SWANSON LW. Immunohistochemical identification of neurons in the paraventricular nucleus of the hypothalamus that project to the medulla or to the spinal cord in the rat. J Comp Neurol. 1982;205:260–272. doi: 10.1002/cne.902050306. [DOI] [PubMed] [Google Scholar]
- 60.SWANSON LW, SAWCHENKO PE. Paraventricular nucleus: a site for the integration of neuroendocrine and autonomic mechanisms. Neuroendocrinology. 1980;31:410–417. doi: 10.1159/000123111. [DOI] [PubMed] [Google Scholar]
- 61.JONES BE, YANG TZ. The efferent projections from the reticular formation and the locus coeruleus studied by anterograde and retrograde axonal transport in the rat. J Comp Neurol. 1985;242:56–92. doi: 10.1002/cne.902420105. [DOI] [PubMed] [Google Scholar]
- 62.WESTLUND KN, BOWKER RM, ZIEGLER MG, et al. Noradrenergic projections to the spinal cord of the rat. Brain Res. 1983;263:15–31. doi: 10.1016/0006-8993(83)91196-4. [DOI] [PubMed] [Google Scholar]
- 63.SAMUELS ER, SZABADI E. Functional neuroanatomy of the noradrenergic locus coeruleus: its roles in the regulation of arousal and autonomic function part II: physiological and pharmacological manipulations and pathological alterations of locus coeruleus activity in humans. Curr Neuropharmacol. 2008;6:254–85. doi: 10.2174/157015908785777193. [DOI] [PMC free article] [PubMed] [Google Scholar]
- 64.BARTNESS TJ, LIU Y, SHRESTHA YB, et al. Neural innervation of white adipose tissue and the control of lipolysis. Frontiers in Neuroendocrinology. 2014 doi: 10.1016/j.yfrne.2014.04.001. [DOI] [PMC free article] [PubMed] [Google Scholar]
- 65.RYU V, BARTNESS TJ. Short and long sympathetic-sensory feedback loops in white fat. Am J Physiol Regul Integr Comp Physiol. 2014 doi: 10.1152/ajpregu.00060.2014. [DOI] [PMC free article] [PubMed] [Google Scholar]
- 66.SONG CK, SCHWARTZ GJ, BARTNESS TJ. Anterograde transneuronal viral tract tracing reveals central sensory circuits from white adipose tissue. Am J Physiol Regul Integr Comp Physiol. 2009;296:R501–R511. doi: 10.1152/ajpregu.90786.2008. [DOI] [PMC free article] [PubMed] [Google Scholar]


