Abstract
Dynein and its cofactor dynactin form a highly processive microtubule motor in the presence of an activating adaptor, such as BICD2. Different adaptors link dynein/dynactin to distinct cargos. Here we use electron microscopy (EM) and single molecule studies to show that adaptors can recruit a second dynein to dynactin. Whereas BICD2 is biased toward recruiting a single dynein, the adaptors BICDR1 and HOOK3 predominantly recruit two. We find that the shift toward a double dynein complex increases both force and speed. A 3.5 Å cryo-EM reconstruction of a dynein tail/dynactin/BICDR1 complex reveals how dynactin can act as a scaffold to coordinate two dyneins side by side. Our work provides a structural basis for how diverse adaptors recruit different numbers of dyneins and regulate the motile properties of the dynein/dynactin transport machine.
Cytoplasmic dynein-1 (dynein) is the main transporter of cargos toward the minus ends of microtubules in animal cells1. These cargos move at a range of speeds2 and vary in size from large organelles3 to small, individual proteins4. Dynein is activated to form a highly processive motor by binding its cofactor dynactin and a cargo adaptor, such as BICD2 (Bicaudal D homolog 2)5,6. Dynein contains two motor domains joined by a tail region, whereas dynactin is built around a short actin-like filament, capped at its pointed and barbed ends and decorated with a shoulder6–9. An 8 Å cryo-electron microscopy (cryo-EM) structure showed how a coiled coil in BICD2 recruits dynein’s tail to dynactin’s filament8. Other adaptors have been identified that activate dynein5,10,11 and link it to different cargos. These activating adaptors contain long coiled coils, however the sequence similarity between them is low12–15 making it unclear if they engage dynein/dynactin in the same way. There is also evidence that certain adaptors, such as BICDR114 (BICD related-1) and HOOK35,10,11, drive faster movement than BICD2, although the mechanism is not understood.
Dynactin can recruit two dyneins
We determined cryo-EM structures of two new dynein/dynactin/adaptor complexes. BICDR1, like BICD2, binds Rab6 vesicles16, whereas HOOK3 links dynein/dynactin to early endosomes17,18. We determined ~7 Å resolution maps of both the dynein tail/dynactin/BICDR1 (TDR) and the dynein tail/dynactin/HOOK3 (TDH) complexes, which we compare to our previous structure of dynein tail/dynactin/BICD2 (TDB)8 (Fig. 1a, Extended Data Fig. 1a-d, Extended Data Table 1).
Figure 1. Dynactin can recruit two dyneins.
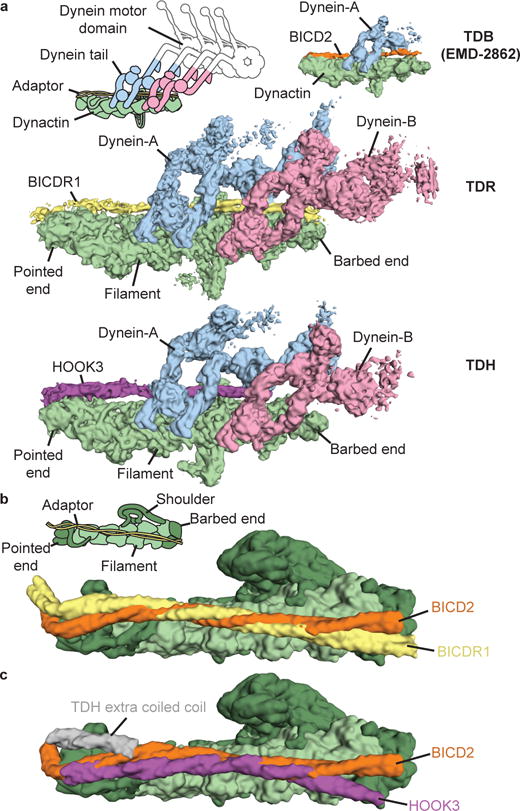
a, Sub-7 Å cryo-EM maps of dynein tail:dynactin:BICDR1 (TDR) and tail:dynactin:HOOK3 (TDH), colored according to their components. Tail:dynactin:BICD2 (TDB) is included for comparison. b, Molecular models (surface representation) of BICDR1 and BICD2 on dynactin show the divergent paths of the coiled coils. c, Comparison of HOOK3 and BICD2 on dynactin.
The coiled coils of all three adaptors run along the length of the dynactin filament (Fig. 1a). However, in contrast to previous predictions13, each adaptor makes different interactions. BICD2 and BICDR1 diverge in their path and relative rotation (Fig. 1b). HOOK3 follows yet another route over dynactin’s surface (Fig. 1c). TDH also shows an extra coiled-coil density near dynactin’s pointed end (Fig. 1c) and extra globular density toward the barbed end (Extended Data Fig. 1e, f). The identity of the second coiled coil is unclear, whereas the globular density likely corresponds to the N-terminal Hook domain, which is required for HOOK3 to activate dynein/dynactin11,19.
The most striking feature of TDR and TDH is the presence of two dynein tails (Fig. 1a). The first dynein (dynein-A) binds in an equivalent position to the dynein tail in TDB8 and the full-length dynein in dynein/dynactin/BICD2 (DDB)9. The second dynein (dynein-B) binds next to dynein-A near the barbed end.
Adaptors determine dynein recruitment
We determined whether BICD2, BICDR1 and HOOK3 recruit different numbers of dyneins in moving dynein/dynactin complexes. We mixed tetramethylrhodamine (TMR)- and Alexa647-labeled dyneins and used single-molecule fluorescence microscopy to measure the frequency at which two dyes colocalize on microtubules (Fig. 2a, b). In the presence of dynactin and BICD2, 13±1% (s.e.m.) of processive complexes were labeled with both dyes, significantly higher (P<0.0001) than the colocalization in the dynein-alone control (2.1±0.3%). Using BICDR1 or HOOK3 as an adaptor led to 31±2% and 34±1% colocalization respectively (Fig. 2b). After correction for complexes double-labeled with the same color, we estimate 26% of BICD2 complexes contain two dyneins, compared to 61% for BICDR1 and 67% for HOOK3. We conclude the majority of motile complexes containing BICD2 have one dynein, whereas both BICDR1 and HOOK3 preferentially recruit two.
Figure 2. Adaptors recruit different number of dyneins to dynactin.
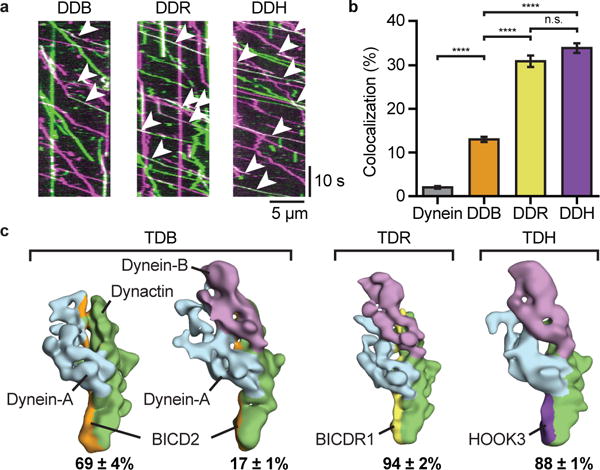
a, Kymographs of dynein/dynactin with BICD2 (DDB), BICDR1 (DDR) or HOOK3 (DDH). Moving complexes contain TMR-dynein (magenta), Alexa647-dynein (green) or both (white, white arrowheads). Two independent repeats (>3 replicates/repeat). b, The mean percentage (±s.e.m.) of complexes containing both TMR- and Alexa647-dynein (NDynein=7793, NDDB=3092, NDDR=3107, NDDH=3990; ANOVA with Tukey’s test; ****P<0.0001; n.s. - not significant, P=0.4010). c, Representative negative-stain EM 3D classes of one- and two-dynein complexes for TDB, TDR and TDH. Mean (±s.e.m.) fraction of particles in each class shown. Ambiguous classes are not shown.
Whereas this and previous studies6–9 are consistent with BICD2 predominantly recruiting one dynein, its ability to recruit a second was unanticipated. To verify this observation we applied a mixture of BICD2, dynein tail and dynactin onto grids for negative-stain EM analysis (Fig. 2c). In agreement with our single-molecule data, 3D classification of adaptor complexes showed 17±1% of BICD2 complexes contained two dyneins, whereas 69±4% contained one, with the rest ambiguous. This ability of BICD2 to bind two dyneins also agrees with a cryo-electron tomography reconstruction of microtubule-bound DDB20. Negative-stain EM of BICDR1 and HOOK3 complexes showed 94±2% and 88±1% respectively contained two dyneins (Fig. 2c). This suggests an even higher degree of second dynein recruitment than our single-molecule data. Our data suggest the number of dyneins bound to dynactin can be controlled by the identity of the adaptor.
Two dyneins increase force and speed
We sought to understand how recruiting different numbers of motors affects the motile properties of the dynein/dynactin complex. We used an optical trap to measure the stall force of DDB, dynein/dynactin/BICDR1 (DDR) and dynein/dynactin/HOOK3 (DDH) (Fig. 3a, b). Similar to our previous measurements21, the stall force of DDB is 3.7±0.2 pN, significantly lower (P<0.0001) than the stall force of the plus-end-directed motor, kinesin-1 (5.7±0.2 pN)22. In comparison, the stall force of DDR is 6.5±0.3 pN and DDH is 4.9±0.2 pN (Fig. 3b), suggesting that recruiting more dyneins to dynactin increases force production. This agrees with previous reports, using dynein on beads, which concluded dyneins can team up efficiently for maximum mechanical output23,24. The difference in stall force between DDR and DDH suggests features of these specific dynein/dynactin complexes, besides motor number, can also fine tune force production.
Figure 3. Two dyneins increase force and speed of dynein/dynactin.
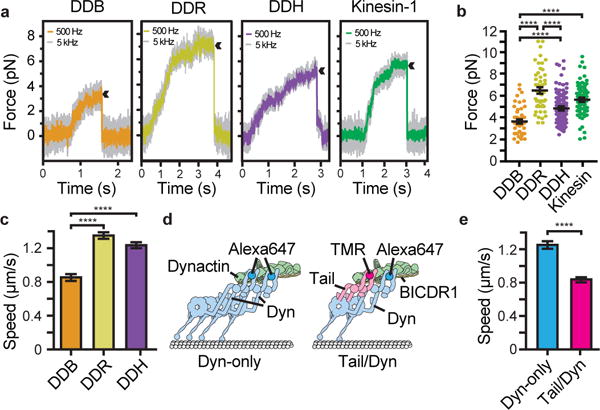
a, Traces showing typical stalls of beads driven by single DDB, DDR, DDH or kinesin-1. Four, six, five and four independent repeats respectively. Arrowheads denote motor detachment from the microtubule after stall. b, Scatter plots showing stall force distributions (NDDB=54, NDDR=53, NDDH=118, Nkinesin=83). c, Mean speeds of DDB, DDR and DDH (NDDB=3343, NDDR=3162, NDDH=3744). d, Schematic depicting experimental design for TMR-tail/Alexa647-Dyn experiment. e, Dyn-only complexes move significantly faster than Tail/Dyn (NDyn-only= 1004, NTail/Dyn=939). In b, c and e horizontal lines represent mean ±s.e.m; ****P<0.0001 (ANOVA with Tukey’s test for b, c; unpaired two-sided t-test for e).
The higher stall force of DDR also suggests it competes more efficiently with kinesin than DDB does. This may explain why neuronal overexpression of BICDR1, but not BICD2, counteracts kinesin-driven transport of Rab6 vesicles14 and may be relevant to BICDR1’s role in opposing anterograde movement in early neuronal differentiation16. The ability of some adaptors to recruit multiple dyneins could also contribute to the clustering and pairing of dynein motors required to transport large cargos24,25.
We next asked if recruiting more dyneins to dynactin had an effect on speed. Previous work on BICDR1 in cells14 and HOOK3 in vitro5,10,11,19 showed complexes containing these adaptors move faster than those with BICD2. Our data raise the possibility these faster speeds are due to more two-dynein complexes. However, previous reports suggested that whereas artificially tethering dyneins increased run length, it had little or no effect on velocity26,27.
To determine whether motor number affects the speed of dynein/dynactin complexes, we first directly compared all three adaptors in our in vitro motility assay. As expected, the run lengths of DDR and DDH were longer than DDB (Extended Data Fig. 2a). Strikingly the average velocities of DDR (1.35±0.04 μm/s) and DDH (1.23±0.04 μm/s) were significantly faster than DDB (0.86±0.04 μm/s, P<0.0001)(Fig. 3c, Extended Data Fig 2b, c). To test whether this speed difference required the presence of two active dyneins we mixed Alexa647-labeled dynein with a TMR-labeled tail construct, BICDR1 and dynactin (Fig. 3d). For this experiment we used a mutated full-length dynein which binds dynactin as strongly as dynein tail8,9, yet moves at wild-type velocities (Extended Data Fig. 2b, d). We compared the speeds of moving complexes containing only full-length dynein (Dyn-only) with those that contained one tail and one active dynein (Tail/Dyn). As expected, Dyn-only complexes moved at a similar speed (1.25±0.04 μm/s, Fig. 3e) to DDR (1.22±0.05 μm/s, Extended Data Fig. 2d). However, Tail/Dyn complexes moved significantly slower (0.84±0.03 μm/s, P<0.0001, Fig. 3e, Extended Data Fig. 2e). This suggests the presence of a second dynein increases the velocity of dynein/dynactin complexes.
We propose the increase in speed upon the recruitment of two dyneins is linked to the way in which dynactin recruits them side by side (Fig. 1a). This may restrict the inherent sideways and backwards movements of the motor domains28 to take a more direct and faster route along the microtubule. Other dynein regulators, such as Lis1, have been reported to increase the speed of dynein/dynactin29,30 and could act by increasing motor copy number. In the case of Lis1, however, quantitative fluorescence measurements suggest this is not the case29. Intriguingly, the velocity of BICD2 complexes containing both fluorophores, and hence two dyneins (1.08±0.03 μm/s, Extended Data Fig. 2f), was significantly faster than the average DDB velocity (P<0.0001), but not as fast as DDR. This suggests in addition to recruiting two dyneins, certain adaptors also affect speed through small differences in the way they recruit the motors to dynactin.
The dynein/dynactin/BICDR1 structure
To understand how dynactin recruits two dyneins, we collected sufficient data to determine the TDR structure to an overall resolution of 3.5 Å (Extended Data Fig. 3, Extended Data Table 1). To improve the tail density, we performed multiple rounds of particle signal subtraction, focused 3D classification and refinement on regions that moved as rigid blocks, improving the definition of the blocks at each iteration (Extended Data Fig. 4). This led to a set of 3.4 Å maps covering the entire length of the dynein tail (Extended Data Table 1).
Previous low-resolution structures showed the dynein tail comprises two heavy chains (HCs), consisting of a series of helical bundles, held together by an N-terminal dimerization domain (NDD)8,9. Each HC binds one intermediate chain (IC) and one light intermediate chain (LIC)7,9,31. The IC N-terminal regions are held together by the dynein light chains, Robl, LC8 and Tctex32,33. Here, we use our high-resolution maps to build an atomic model of the dynein tail. We de novo traced helical bundles 1-6 of the HC and the WD40 domain of the IC (Fig. 4a, Extended Data Fig. 5a, b, 6a, Extended Data Table 1). We also placed helices for part of helical bundle 7 and rebuilt homology models for the LIC31 and Robl32 (Fig. 4a, Extended Data Fig. 5c, 6b, c). Our structure reveals the IC WD40 domain makes extensive contacts to HC bundles 4-5, with its central cavity filled by a loop-helix from bundle 4 (Extended Data Fig. 6a). In contrast the LIC globular domain only interacts with two helices from bundle 6. Its tight binding to the HC34 is a result of its N- and C-termini. These span out from the globular domain and form an integral part of HC bundles 5 and 7 respectively (Extended Data Figs. 5c, 6b).
Figure 4. Structure of the dynein HC and architecture of the TDR complex.
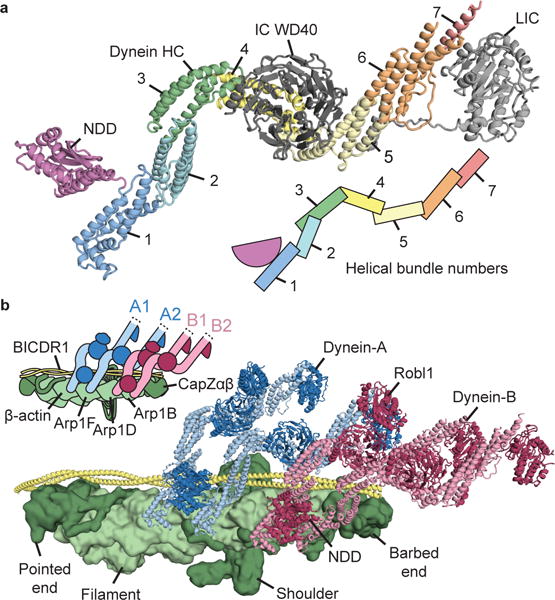
a, Consensus molecular model of one dynein heavy chain (HC), complete with intermediate chain (IC) and light intermediate chain (LIC). HC is colored according to helical bundle number. b, Assembled model of the TDR complex, showing the arrangement of dynein-A (cartoon) and dynein-B (cartoon) on BICDR1 (cartoon) and dynactin (surface). The HC N-terminal dimerization domain (NDD) and dynein light chain Robl1 of dynein-B are labeled.
We assembled and refined a model of the whole TDR complex (Fig. 4b, Extended Data Table 1, Supplementary Video 1) into our 3.5 Å map. We used our previous dynactin structure8 and a model for the BICDR1 coiled-coil region. For each dynein, we fit in two copies of HC/IC/LIC, one Robl dimer and a new 1.9 Å crystal structure of the human NDD (Extended Data Fig. 6d, e, Extended Data Table 2).
Structural basis of 2-dynein recruitment
Our TDR structure shows the two dyneins binding to grooves on the surface of dynactin formed by its β-actin subunit and the three actin related protein 1 subunits Arp1F, Arp1D and Arp1B (Fig. 4b). The two dynein-A chains, A1 and A2, and the first dynein-B chain, B1, bind in a similar way, making contacts to both sides of their respective grooves. The precise interactions, though overlapping, are all slightly different (Fig. 5a). The second dynein-B chain, B2, binds between Arp1B and the barbed-end capping protein CapZβ and is rotated by 90° along its long axis, relative to the other dynein chains.
Figure 5. Interactions recruiting two dyneins to the TDR complex.
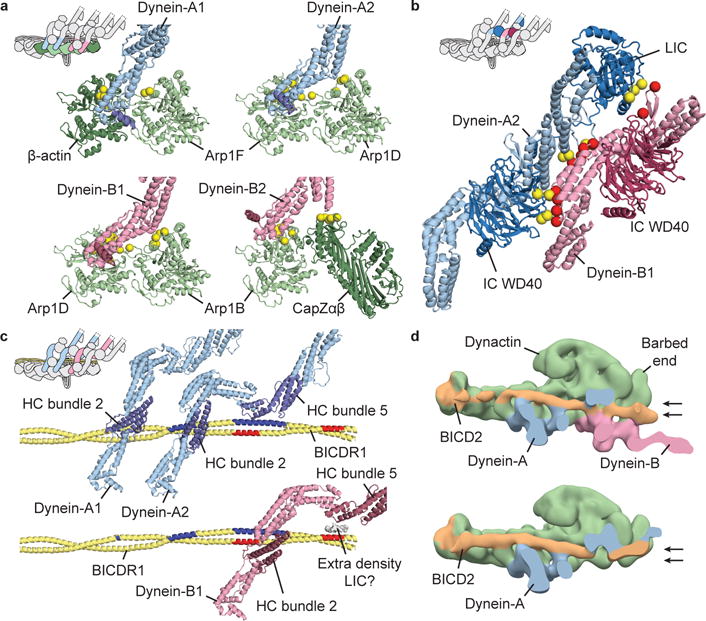
a, Dynein HC (blue/pink) interactions with dynactin subunits (green). Contact residues on dynactin shown as yellow spheres. For each HC, helix α6 is highlighted (dark blue/dark red). b, Dynein-A2 makes extensive interactions with dynein-B1. Interaction sites shown as yellow and red spheres. c, Interactions of dynein-A (top) and dynein-B1 (bottom) with BICDR1. Interaction sites marked in dark blue and red. Extra density, from dynein-A2 LIC, mediates the connection between dynein-B1 and BICDR1. d, Negative-stain EM reconstructions of DDB containing two dyneins (top) or only dynein-A (bottom), sliced to highlight BICD2. Arrows depict alternative positions of BICD2 at dynactin’s barbed end.
The two dyneins also make extensive interactions with each other. These consist of the IC WD40 domain of A2 binding the HC of B1; direct HC to HC interactions and contacts from the A2 LIC to the HC and IC of dynein-B1 (Fig. 5b). These contacts are well conserved across higher eukaryotes (Extended Data Fig. 7a). They contribute to a cascade of interactions (Supplementary Video 2) between the 4 dynein chains that include contacts between the IC WD40 domain of each chain and the neighboring HC (Extended Data Fig. 7b). This network of connections stabilizes the binding of the second dynein and ensures all four HCs are held in a rigid orientation with respect to each other. This is likely to keep the dynein motor domains properly aligned and may be important for the increase in speed when two dyneins are recruited to the dynactin scaffold.
Our structure reveals the key role BICDR1 plays in recruiting two dyneins to dynactin. Dynein-A binds the adaptor in three places. Its A1 chain uses a single site on helical bundle 2 whereas the A2 chain binds via two sites (Fig. 5c). One of these also involves helical bundle 2, the other uses helical bundle 5. Recruitment of dynein-B depends only on its B1-chain which also uses sites on bundles 2 and 5. The first of these sites contacts the adaptor coiled coil opposite to where dynein-A2 binds (Fig. 5c). The second site does not directly contact the coiled coil, but instead touches density that packs against it (Fig. 5c, Extended Data Fig. 7c, d). Although the identity of this region is uncertain, there is a weak density connecting it to the LIC, suggesting it corresponds to the flexible LIC C-terminus (Extended Data Fig. 5c, 7d). This region of LIC has been shown to interact with BICD2 and HOOK319,31.
Adaptor position controls dynein number
All three dynein/dynactin/adaptor complexes recruit dynein-A in a similar way despite the differences in the positions of the adaptors themselves (Extended Data Fig. 8a). In TDR and TDH, dynein-B can contact the adaptor because the BICDR1/HOOK3 N-termini follow downwards paths, stabilized by interactions with CapZβ. In contrast, in TDB no contact site for dynein-B is available because the adaptor is shifted upwards toward the shoulder domain to contact Arp1A (Fig. 1b, Extended Data Fig. 8b).
We asked what structural changes allow BICD2 to recruit a second dynein (Fig. 2). We combined our negative-stain EM TDB datasets (Fig. 2c) to determine structures of sufficient quality to resolve the position of the coiled coil. We find TDB with two dynein tails has BICD2 in a lower position, similar to BICDR1 and HOOK3 and different from its position in single-dynein bound TDB (Fig. 5d). Our data suggest a switch in the position in the N-terminus of the adaptor is sufficient to account for dynein-B recruitment.
In conclusion, we show dynactin can act as a natural scaffold to line up two dyneins in close proximity. This arrangement results in a dynein/dynactin complex that moves faster and can produce larger forces. Our observations provide a mechanism by which cargo can control the output of the dynein/dynactin machine via the identity of its activating adaptor.
Methods
Cloning
The following adaptors were codon optimized for Sf9 expression (Epoch Life Science): mouse BICDR1 (BICDL1), human HOOK3 residues 1-522 and mouse BICD2 residues 1-400. Adaptors were subcloned into pOmniBac and pACEBac1 derived vectors for expression in Sf9 cells6. Tags were added for purification (a His6-ZZ tag with a TEV protease cleavage site (TEV) or a PreScission protease site (Psc) followed by a 2xStrep affinity tag) or protein labeling (GFP or SNAPf (NEB)). The following constructs were generated: pOmniBac-His6-ZZ-TEV-SNAPf-BICD21-400, pOmniBac-His6-ZZ-TEV-BICDR1, pOmniBac-His6-ZZ-TEV-SNAPf-BICDR1, pOmniBac-His6-ZZ-TEV-BICDR1-SNAPf, pOmniBac-His6-ZZ-TEV-BICDR1-GFP, pACEBac1-HOOK31-522-SNAPf-Psc-2xStrep and pACEBac1-HOOK31-522-GFP-Psc-2xStrep.
We generated a new dynein tail construct containing residues 1-1455 of the human dynein heavy chain (HC). The fragment of the Sf9-codon optimized, DYNC1H1 gene was cloned into a pACEBac1 vector contain an N-terminal His6-ZZ-TEV tag and fused to pDyn2 (containing genes of human IC2C, LIC2, Tctex1, LC8 and Robl1) as described6.
Protein purification
Dynactin was purified from pig brains using the large scale SP-sepharose protocol8. Wild-type human dynein and a mutant open dynein9 were expressed and purified using baculovirus as described6. The two dynein tail constructs (HC1-1455 and SNAPf-HC1-1074-GST) were purified as described8.
His6-ZZ-TEV tagged adaptor constructs were purified as described6. C-terminal Psc-Strep tagged constructs were purified as follows: pellets from 500 ml of Sf9 cell culture were resuspended in 50 ml of lysis buffer (30 mM Hepes-KOH pH 7.2, 50 mM KAc, 2 mM MgAc, 1 mM EGTA, 10% (v/v) glycerol, 1 mM DTT) plus one Complete-EDTA protease-inhibitor tablet (Roche) and 1 mM PMSF. Cells were dounced (30-40 strokes) and the lysate clarified in a Ti70 rotor (Beckman Coulter) at 30k rcf for 20 min at 4 °C before loading onto a 1 ml Streptrap HP column (GE Healthcare) pre-equilibrated in lysis buffer. The column was washed with 20 CVs lysis buffer and bound protein eluted using 7 CV lysis buffer plus 3 mM D-desthiobiotin. Protein-containing fractions were concentrated to ~5 mg/ml in 30 kDa cut-off Amicon centrifugal filters (Merck Millipore) and gel filtered using a Superose-6 10/300 column (GE Healthcare) pre-equilibrated in buffer containing 25 mM Hepes-KOH pH 7.2, 150 mM KCl, 1 mM MgCl2, 5 mM DTT.
A C-terminal GFP-tagged truncated human kinesin-1 (K560-GFP) was prepared as described35.
N-terminal dimerization domain (NDD) crystallization
Residues 1-201 of DYNC1H1 were expressed using a modified pRSET(A) plasmid36. Seleno-methionine labeled NDD was expressed in a SoluBL21 E. coli strain as described37. It was purified from 2 L of culture using a 5 ml HisTrap column (GE Healthcare). Fractions were pooled, concentrated in a 30 kDa Amicon and applied to a Superdex200 10/300 gel filtration column (GE Healthcare) equilibrated with buffer containing 50 mM Tris-HCl pH 7.4, 150 mM KAc, 10 mM β-Mercaptoethanol, 2 mM MgAc, 1 mM EGTA, 10% (v/v) glycerol and inhibitor tablets (1 tablet: 100 ml, Complete-EDTA Free). The NDD peak was concentrated to 10 mg/ml. For protein crystallization, 2 μl of protein was mixed with 2 μl precipitant (100 mM NaAc, pH 5.5, 10% (v/v) glycerol, 50 mM CaAc, 20% PEG 2,000 MME). Crystals were grown at 18 °C by hanging drop for 48 h, harvested with microloops (Mitegen), dipped into mother liquor containing an extra 15% (v/v) glycerol and flash-frozen in liquid nitrogen. SAD data were collected at ID29 beamline at ESRF, integrated/scaled by the EDNA auto pipeline38. The structure was solved in PHENIX39, built in COOT40 and refined using REFMAC41.
Cryo-EM of dynein tail(HC1-1455):Dynactin:BICDR1 (TDR)
Cryo-EM grids for TDR were prepared similarly to TDB8 with exception that no cross-linker was used. Protein concentrations were chosen to give densely packed particles (~100 per image). Micrographs were recorded using FEI Titan Krios equipped with Falcon II detector (300 kV, 32 frames, 2 s exposure, 1.34 Å/pixel, 52 ē/Å2) using automated data collection (EPU, FEI). 7 images were collected per hole (26,906 total images, 11 separate sessions). Drift correction was performed using MotionCor242 and CTF parameters estimated using CTFFIND3_13030743. Subsequent processing used Relion-2.044 unless otherwise stated.
Micrographs were first manually examined to remove images with large amount of contamination, very low number of particles (<15), significant uncorrected drift, a large astigmation, extreme defocus values (<1 μm or >6 μm) and abnormal Fourier patterns. 23,945 micrographs that had good signal to at least 8 Å were selected. For the first dataset a small set of particles was manually picked from 8× binned micrographs and subjected to reference-free 2D classification. A selection of 2D class averages representing a range of different size and shape particles present in micrographs (not just TDR complexes) was selected, centered using Relion shift_com function, low pass filtered to 50 Å and used as references for autopicking all binned micrographs using Relion-1.445. For optimal particle picking of other datasets we used 2D classes obtained from multiple sessions. We also used a value of 1.1 for the “maximum standard deviation of the background noise” setting, to ensure we picked all good TDR particles with high contrast. This value resulted in significant levels of contaminants but these were removed by extensive manual screening as indicated below. Initially particles with a high “autopick figure of merit” values were screened to remove false positives. Then the particles were cleaned by several cycles of 2D classification. At each cycle the only particles that were discarded were those, which were obviously dynein tail or contamination. In addition, particles with high “log likelihood contribution” values were manually screened for remaining false positives and particles containing impurities with a very strong signal. After several cycles of 2D classification, particles corresponding to free dynactin in its dominant view were discarded. To do this we first subjected particles from these classes to an additional round of 2D classification, this time with the “image alignment” setting turned off, in order to recover any TDR particles. Some of dynactin classes of other than dominant view could not be easily distinguished from TDR complex. Therefore, particles from all other dynactin like classes were combined with all TDR particles and subjected to 3D refinement with the previous TDB structure8 low pass filtered to 60 Å as a reference. The output translational information from this 3D refinement was used to obtain more accurate coordinates of the particles in individual micrographs (script courtesy of Rafael Fernandez Leiro). These coordinates were used to extract re-centered particles from 8-binned micrographs, which were manually cleaned as before. After this cleaning, screened particles were subjected to another round of 3D refinement followed by 3D classification, to improve the separation of dynactin and TDR particles. In all steps above (picking, 2D classification and 3D refinement and classification), the option to “ignore CTFs until first peak” was turned on. Translational information from the 3D classification was used as before to extract re-centered TDR particles from unbinned micrographs. The 3D refinement using the unbinned particles from the first dataset yielded a 6.5 Å resolution map and using all 11 datasets yielded a 3.5 Å resolution map.
3D classification (see above) revealed movement of the dynein tails, resulting in lower resolution of these parts of the map. As a result, we conducted focused 3D classification and 3D refinement of the dynein tail as described46 except that we used multiple rounds of mask optimization. We first generated overlapping binary masks covering the N- and C-terminal densities of all four dynein chains and used the particle subtraction function in Relion to subtract the density outside these regions from the raw TDR particles. Later, 3D refinement was used to align these “subtracted particles” based the remaining density. Then we used 3D classification with no alignments to ask which parts of the structure move as a rigid block. We then made new masks around the rigid block and repeated all the steps of particle subtraction, 3D refinement and 3D classification. This process was repeated several times to obtain the optimal mask.
In the case of the N-terminal region of the tail, the optimal mask was used for a final round of particle subtraction and 3D refinement which resulted in a 3.4 Å map. To further improve the densities for IC WD40 domain, we performed local sub-volume averaging, within Chimera 1.1047. Similarly, for C-terminal region of the dynein tail we performed a round of particle subtraction and 3D refinement using the optimal mask. We then used 3D classification with no alignment to identify the most homogenous particles for different local regions. For HC residues 500-927 we performed a 3D classification using the whole of optimal mask. For the Robl or LIC we performed 3D classification using local mass around those regions. In all cases selected particles were refined using the whole optimal mask. All density maps were corrected for the modulation transfer function of the detector, and then sharpened by applying a negative B-factor that was either estimated using automated procedures within Relion or manually set parameters.
Model building and refinement
Building was performed in COOT and refinement in PHENIX. The dynein HC residues 201-710 from dynein-B1 and the IC from dynein-A2 were de novo built and refined into the “N-term tail” map guided by maps generated by local sub-volume averaging with improved density for flexible loops. HC residues 500-927 from dynein-A2 were built and refined into the “HC C-term” map. A “LIC-mask” map was used to model secondary structure elements for HC residues 927-1057 and to rebuild a Phyre248 homology model for human LIC2 (both dynein-A2). A “Robl-mask” map was used to rebuild a homology model for the Robl/IC-extended-N-termini complex and identify its interactions with the dynein-A2 IC WD40 domain. The separately built components were combined to generate a consensus model for dynein-A2.
The structure of TDR was assembled and real-space refined into an overall TDR map not sharpened and filtered to 8 Å resolution. We used four copies of the HC/IC/LIC consensus model, 2 copies of the NDD, a model of dynactin8 and a stretch of coiled coil for BICDR1. The combined model was fit into the 3.5 Å overall map. Sections of dynactin were rebuilt including the CapZαβ dimer, the N-termini of subunit p50. Corrections were made to secondary structure elements in the pointed end and shoulder domains. An approximate model for the BICDR1 coiled coil (residues 105-392) was generated by placing helices into density, assigning registry based on fitting residues F159 and W166 into bulky density in the core of the coiled coil. Regions of the TDR model in weak density were set to zero occupancy for refinement into the overall 3.5 Å map. Segments of the final model were re-refined against the N-term and C-term maps (Extended Data Table 2).
Cryo-EM of dynein tail(HC1-1455):dynactin:HOOK3 (TDH)
Dynein tail, dynactin and HOOK31-522-SNAPf were mixed in a 2:1:20 molar ratio and incubated on ice for 15 min. The sample was cross-linked increase the amount of complex formed by addition of 0.0125% (v/v) glutaraldehyde (Sigma-Aldrich), at room temperature for 15 min before quenching with 200 mM Tris pH 7.4 (final concentration). The sample was gel filtered using a TSKgel G4000SWXL (TOSOH Bioscience) equilibrated in 25 mM Hepes-KOH pH 7.2, 150 mM KCl, 1 mM MgCl2, 0.1 mM Mg.ATP, 5 mM DTT. The TDH complex was concentrated in a 100 kDa cut-off Amicon at 1,500 rcf to 0.1-0.2 mg/ml. 3 μl of the TDH sample were applied to freshly glow-discharged Quantifoil R2/2 300-square-mesh copper grids covered with a thin carbon support. Samples were incubated on grids on a FEI Vitroblot IV for 45 s and blotted for 3-4.5 s at 100% humidity and 4 °C, then plunged into liquid ethane.
Micrographs were recorded using automated data collection (FEI EPU) on an FEI Titan Krios with a FEI Falcon III detector in linear mode: 300 kV; 59 frames during 1.5 s exposure; 1.42 Å/pixel; 45 ē/Å2; 5 images per hole. Correction of inter-frame movement for each pixel and dose-weighting was performed using the MotionCor2. CTF parameters were estimated using GCTF49. A reference set of 2D classes were generated using Relion-2.0 from a small set of particles picked by the EMAN250 Swarm boxing tool. Gautomatch (http://www.mrc-lmb.cam.ac.uk/kzhang/) was used to pick particles from all micrographs (4× binned) using this reference set. Relion-2.0 was used for 2D classification to clean the autopicked particles. An 8.2 Å resolution TDB structure8, low-pass filtered to 60 Å, was used as an initial model for a first round of 3D refinement. The dataset was cleaned by 3D classification using the output from 3D refinement as a reference. The cleaned particles were re-extracted from unbinned micrographs and used for a final round of 3D refinement yielding a 6.7 Å map.
Negative stain EM analysis
The dynein tail/dynactin/adaptor triple complexes were assembled by mixing 1.7 μl 1 mg/ml dynein tail (HC1-1455), 1 μl of 1.35 mg/ml dynactin and 2 μl 1.3 mg/ml cargo adaptor (BICD21-400-GFP, HOOK31-522-SNAPf and BICDR1-GFP). The samples were incubated on ice for 15 min before diluting 8-fold for preparation of negative stain grids as described6. 2 replicate samples were made on separate days. 200 to 400 micrographs of each sample were recorded using FEI EPU on a FEI Falcon II direct electron detector fitted to a FEI F20 electron microscope operated at 200 kV: 1 s exposure; 2.08 Å/pixel; 20 ē/Å2; 0.8-1.2 μm underfocus. A small set of particles was picked from 4× binned micrographs using the EMAN2 Swarm boxing tool. Subsequent processing was done by Relion-2.0 unless otherwise stated. Particles were extracted and subjected to reference-free 2D classification. Two to five 2D class averages of triple complex were centered using a shift_com command, low pass filtered to 50 Å resolution and used as references for automated particle picking within Relion-1.4 of all 4× binned micrographs. Autopicked particles were extracted, split in half and subjected to 2D classification as before. Ten 2D class averages representing different particle orientations were selected and used for another around of autopicking. This third round of autopicking was used to obtain the optimal particle selection (fewest missed particles) and best centering.
The resulting particles were subjected to three rounds of 2D classification to identify good complex particles (particle number for TDB: 6,382, 7,648, 5,534, 6,163; TDH: 3,430, 3,958; TDR: 1,713, 1,861, 5,782, 5,388). For the best 3D classification, these sets of particles were first subjected 3D refinement using the cryo-EM structure of dynactin (EMD-2856), low pass filtered to 60 Å, as a reference. 3D classification was carried out using the map from 3D refinement (as well as the orientation and rotational assignment for the particles). 3D classification was carried using the regularization parameter T set to 2 and gradually adjusting image alignment sampling: 10 iterations with 15° angular sampling interval, offset search range set to 8 pixels and step 2 pixels; 25 iterations 7.5°, 5 pixels, 1 pixel. The gradual reduction in sampling yielded the best classification. It was followed by 15 iterations with 3.7°, 3 pixels, 0.5 pixels to yield 3D classes with density maps of sufficient quality to identity number of dynein tails bound to dynactin. The fraction of complexes containing one or two dyneins was calculated from the number of particles assigned to each class.
To determine the path of BICD2, all complex particles from both TDB (BICD21-400-GFP) datasets were combined (42,823 particles). Binned complex particles were subjected to 3D refinement as described above. These coordinate files were used to re-center (as described above) and extract particles from unbinned micrographs, with CTF parameters determined using CTFFIND3_130307. Extracted particles were subjected to 3D refinement followed by 3D classification. In both steps CTF-correction was set to ignore CTFs until the first peak. Particles from 3D classes with dynein-A only, or dynein-A and dynein-B were separated and processed separately. Each set of particles was subjected to another round of 3D refinement and subsequent 3D classification (using 25 iterations: 7.5° angular sampling interval, offset search range 5 pixels and step 1 pixel) to obtain the best particles for each complex (13,278 and 14,070 particles for TDB with dynein-A only and two-dyneins respectively). These were used in a final round of 3D refinement. Molecular models of dynactin, cargo adaptors and dynein tails were fitted into the density maps and used to color different segments within Chimera.
Single molecule assays
SNAPf-dynein or SNAPf-tail complexes were labeled with TMR-Star or Alexa Fluor 647 (NEB), purified separately and percentage labeling quantified as described6. Single-molecule assays were conducted as described6 with slight modifications in order to optimize the number of moving complexes. DDB complexes moved faster than published previously under these optimized conditions. All adaptor complexes were measured under identical conditions. The percentage of processive events was 56% for DDB, 76% for DDH and 75% for DDR.
Microtubules were made by mixing 26 μl of 5.2 mg/ml unlabeled pig tubulin, 5 μl of 2 mg/ml HiLyte Fluor 488 tubulin and 10 μl of 2 mg/ml biotin tubulin (Cytoskeleton) in BRB80 buffer (80 mM PIPES pH 6.8, 1 mM MgCl2, 1 mM EGTA, 1 mM DTT). The mixture was incubated on ice for 5 min before adding 41 μl of polymerization buffer (2x BRB80 buffer plus 20 % (v/v) DMSO and 2 mM Mg.GTP). Microtubules were polymerized at 37 °C for 30-60 min. The sample was diluted with 200 μl MT-buffer (BRB80 plus 40 μM paclitaxel). Excess tubulin was removed by pelleting (20,238 rcf; 8.5 min; at room temperature, RT). The microtubule pellet was washed with 200 μl MT-buffer and re-pelleted as before. The microtubule pellet was re-suspended in 200 μl of MT-buffer and stored at RT covered from light for at least half a day (maximum 3 days) before use. MTs were visualized (see below) and if the density was too low, or free tubulin concentration too high then they were re-pelleted and re-suspended in a smaller volume of MT-buffer.
Motility chambers were made by applying two strips of double sided-tape (Tesa), approximately 8-10 mm apart, on a glass slide and placing a cleaned coverslip6 on top. The glass surface was functionalized with 0.4 mg/ml biotinylated poly(L-lysine)-[g]-poly(ethylene-glycol) (PLL-PEG-biotin; SuSoS AG). The chamber was immediately washed with 40 μl assay buffer (30 mM Hepes-KOH pH 7.2, 5 mM MgSO4, 1 mM EGTA, 1 mM DTT). Subsequently, 10 μl of 1 mg/ml streptavidin (NEB) was flowed through and immediately washed with 40 μl of assay buffer. The chamber was then incubated with freshly diluted microtubules (typically 3 μl of microtubules and 10 μl of assay buffer). Microtubules were immediately washed out with assay buffer followed by assay buffer supplemented with 1.25 mg/ml α-casein (Sigma).
Dynein/dynactin/cargo-adaptor complexes were prepared by mixing 1 μl of 1 mg/ml fluorescently labeled dynein, 1 μl of 1.35 mg/ml dynactin and 2 μl of 1.3 mg/ml cargo adaptor (SNAPf-BICD21-400, HOOK31-522-SNAPf and SNAPf-BICDR1). For experiments with SNAPf-tail an additional 1 μl 1 mg/ml TMR-labeled tail was added. The complex was incubated on ice for 10-15 min then diluted with assay buffer to a final volume of 10 μl. 1 μl of complex solution was added into 19 μl of assay buffer containing 1.25 mg/ml α-casein, an oxygen scavenging system (0.2 mg/ml catalase (Calbiochem) and 1.5 mg/ml glucose oxidase (Sigma)), 0.45% (w/v) glucose, 1% BME, 25 mM KCl and 5 mM Mg.ATP. Taxol was omitted from this buffer to reduce the non-specific background and non-moving events. The motility mix was flowed into the chamber freshly washed with assay buffer supplemented with 1.25 mg/ml α-casein for a second time. The sample was analyzed immediately at 23 ± 1 °C with a total internal reflection fluorescence microscope as described6. Colocalization and velocity were determined from the same datasets (4, 8, 9 and 7 overall chambers for dynein-only, DDB, DDH, DDR respectively). Data collected on 2 different days. Tail/full-length dynein speed data was collected from 3 chambers.
Data were analyzed using ImageJ51. Tif stacks were Z-projected to identify the paths of microtubules, segmented lines drawn along them and kymographs generated using the reslice function. Processive movements were defined as previously6. Velocity was calculating using a pixel size of 105 nm and a frame rate of 236 ms/frame.
Colocalization data were collected using a DV2 beam splitter (Photometrics), which projected each channel (TMR and Alexa Fluor 647) onto a different half of the image. Movie tif-stacks were split and kymographs generated for each channel. Kymographs were overlaid using the Color:Merge function to generate a composite image. The kymographs were manually scored for processive events that showed colocalization, followed by those only appearing in individual channels. Colocalization in the control, dynein-alone, chambers was determined for all microtubule binding events longer than 2 frames.
The fraction of complexes containing two dyneins, d, was calculated from the fraction of total events with signal for TMR-only (Robs), Alexa647-only (Gobs) and colocalized signal (Yobs). Colocalized events represent dynein/dynactin/adaptor complexes with two dyneins, whereas single-colored events represent a mixture of both one- and two-dynein complexes. We can express this in the following three equations:
where s is the fraction of complexes that contain one dynein, r is the fraction of TMR-labeled dynein and g is the fraction Alexa647-labeled dynein flowed into the chamber. These equations hold at high labeling efficiency (our dynein was >94% labeled for a dynein monomer, or >99.64% per dimer) where dynein can either be TMR- or Alexa647-labeled (r + g = 1). We can hence solve these equations for d without needing to know r or g.
Stall force measurements
800 nm carboxy latex beads (Life Technologies) were functionalized with anti-GFP antibodies21. Dynein/dynactin/cargo adaptor (BICD21-400-GFP, HOOK31-522-GFP and BICDR1-GFP) were mixed at a 1:5:20 molar ratio and incubated for 10 min on ice in dynein motility buffer (DMB: 30 mM HEPES pH 7.0, 5 mM MgSO4, 1 mM EGTA) supplemented with 1 mM TCEP (tris(2-carboxyethyl)phosphine) and 1 mg/ml BSA. The diluted mixture was incubated with the anti-GFP-beads for 10 min on ice. Cy5-labeled axonemes21 were introduced into the sample flow chamber, which was washed with 40 μl DMB plus 1 mM TCEP and 500 μg/ml casein. The protein-bead mixture was introduced into the chamber in imaging buffer (DMB with 1 mM TCEP, 500 μg/ml casein, 2.5 mM PCA (protocatechuic acid), 35 μg/ml PCD (protocatechuate-3,4-dioxygenase), 2 mM Mg.ATP). Kinesin was diluted in BRB80 supplemented with 1.5 mg/ml casein and 2 mM DTT and mixed with anti-GFP beads for 10 min on ice. Kinesin-coated beads were introduced into the sample chamber in motility imaging solution (BRB80 supplemented with 2 mM DTT and 1.5 mg/ml casein, 2.5 mM PCA, 35 μg/ml PCD, 2 mM Mg.ATP). For each experiment, the protein concentration was adjusted until less than 30% of the tested beads exhibited any binding and motility when brought in contact with axonemes. This ensured that 95% of the beads are driven by a single processive motor complex.
Trapping experiments were performed on a custom-built fully automated optical trap microscope setup21. To generate stall force histograms, position data from trap recordings (5 kHz) were down sampled to 500 Hz then manually screened and selected. To qualify as a stall event, the position trace had to reach a plateau and remain stationary for at least 100 ms before full release from the microtubule (defined as a rapid, <2 ms jump of at least 50 nm). For DDB, N = 54 stalls from 14 beads in 4 independent experiments; for DDH, N = 118 stalls from 25 beads in 6 independent experiments; for DDR, N = 53 stalls from 17 beads in 5 independent experiments; for kinesin, N = 83 stalls from 18 beads in 4 independent experiments were measured.
Statistical analysis
Statistical analysis was performed using GraphPad Prism 7 (GraphPad Software, USA). The statistical significance of difference in mean values was calculated using one-way ANOVA with Tukey’s multiple comparisons test, or an unpaired t-test, as indicated for each experiment. No statistical methods were used to predetermine sample size. Velocity and colocalization data were randomized before analysis.
Extended Data
Extended Data Figure 1. Single particle cryo-EM analysis of TDR and TDH.
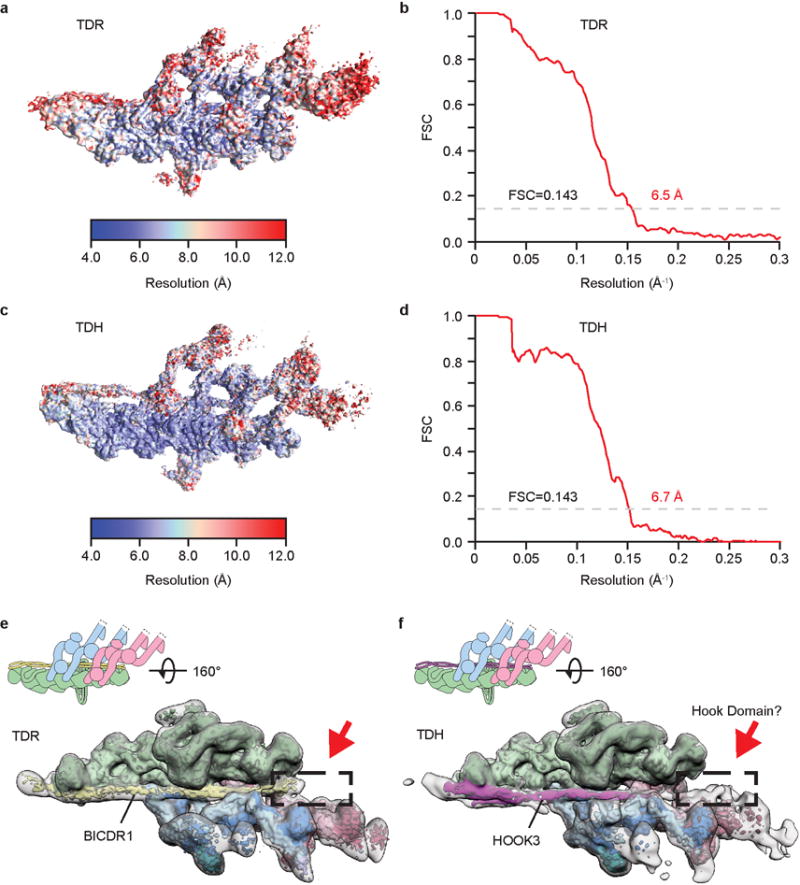
a, Cryo-EM reconstruction of the dynein tail/dynactin/BICDR1 (TDR) complex was analyzed by ResMap52 showing resolution distribution from 4 to 12 Å. b, The gold-standard FSC curve of the 6.5 Å TDR map. c, Cryo-EM reconstruction of the dynein tail/dynactin/HOOK3 (TDH) complex showing resolution distribution from 4 to 12 Å. d, The gold-standard FSC curve of the 6.7 Å TDH map. e, Cryo-EM density for TDR low pass filtered to 6.7 Å resolution (colored according to cartoon), and to 20 Å (outline). Density at the N-terminus of BICDR1 is boxed. f, Cryo-EM density for TDH low pass filtered to 6.7 Å (colored according to cartoon) and at 20 Å (outline) showing the putative Hook domain, an extension of the HOOK3 coiled coil ending in extra density near dynein-B (dashed box).
Extended Data Figure 2. Single molecule assay speed distributions.
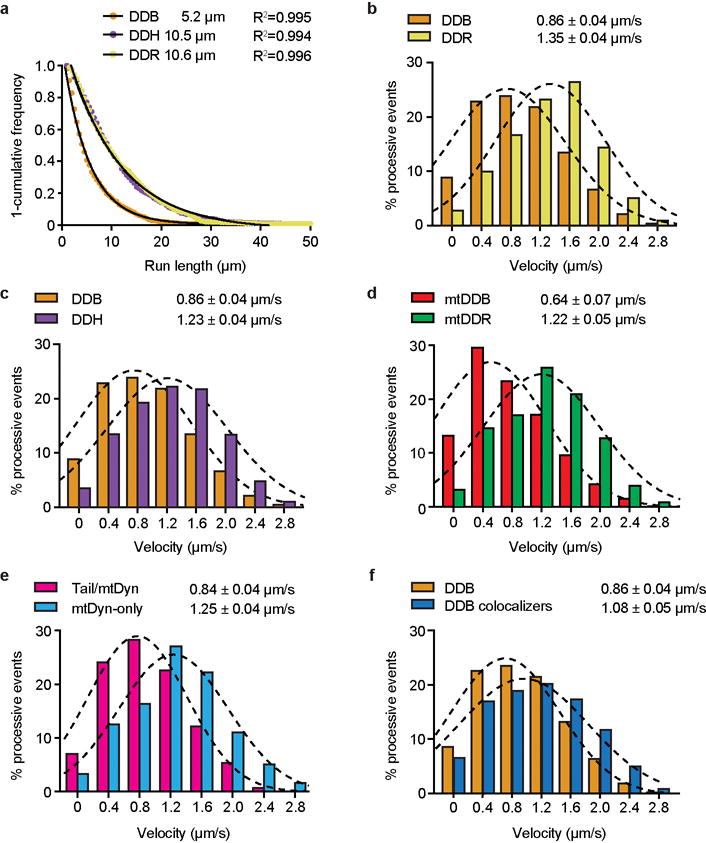
a, A 1-cumulative frequency distribution plot showing run-lengths of dynein/dynactin/BID2 (DDB), dynein/dynactin/BICDR1 (DDR) and dynein/dynactin/HOOK3 (DDH), with fit to a one-phase exponential decay. The decay constant (run length) and R2 value (least squares regression) of the fit are shown. 785, 677 and 684 events for DDB, DDH and DDR respectively were measured from microtubules of at least 20 um in length from three chambers. b-f, Distribution of mean velocities of processive (unidirectional, minus end-directed) events for b, DDB and DDR (NDDB=3,343 and NDDR=3,162); c, DDB and DDH (NDDH=3,744); d, active mutant dynein in complex with dynactin and either BICD2 (mtDDB, N=905) or BICDR1 (mtDDR, N=1,183); e, the colocalized mtDDR complexes containing either both TMD-dynein tail and Alexa647-full-length dynein (Tail/Dyn, N=939) or Alexa647-only complexes containing only full-length dynein (Dyn-only, N=1,004); f, all DDB complexes and complexes with both fluorophores, and hence two dyneins (colocalizers, N=660). Mean and s.e.m. values were estimated by fitting the histograms to a Gaussian distribution (dashed lines).
Extended Data Figure 3. Single particle cryo-EM analysis of TDR complex at 3.5 Å resolution.
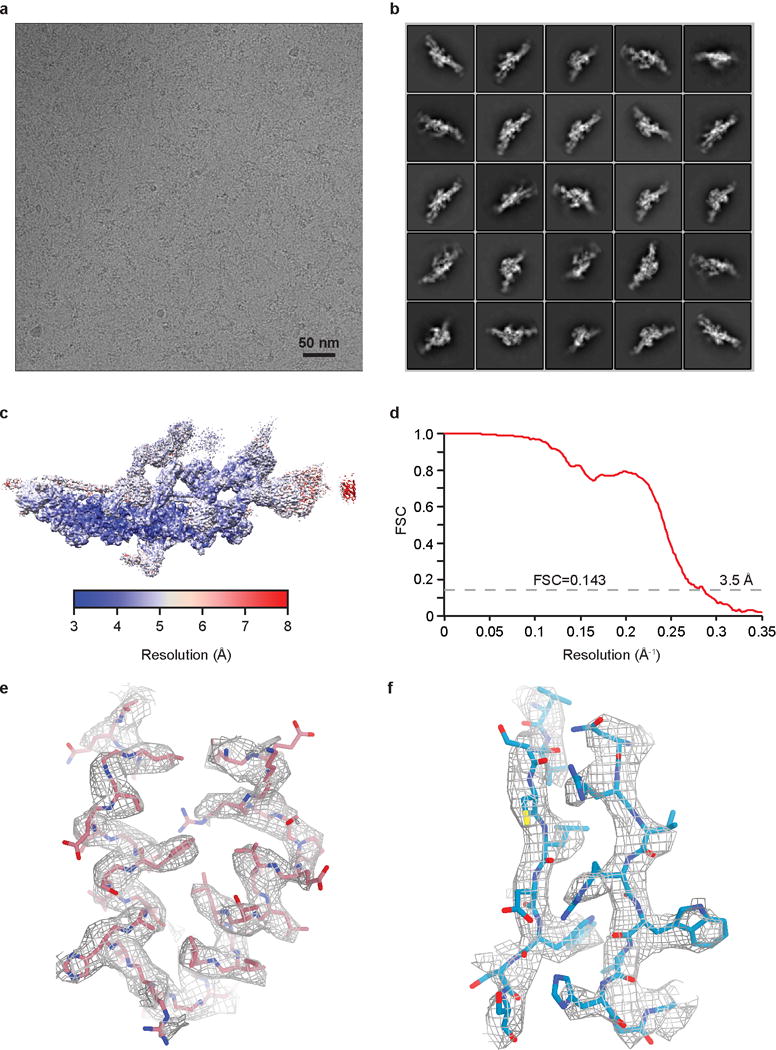
a, Micrograph of the dynein tail/dynactin/BICDR1 (TDR) complex (representative of 26,906 micrographs). b, Typical 2D class averages of TDR in different orientations. c, The overall density map of TDR was analyzed by ResMap showing a resolution distribution from 3 to 8 Å. d, The gold-standard FSC curve of the overall TDR map. e, Mesh representation of 3.4 Å density map of alpha helixes from dynein-B1 obtained by focused 3D classification and refinement. f, Sample density obtained by local sub-volume averaging showing beta strands from IC WD40.
Extended Data Figure 4. Cryo-EM data procedures of TDR.
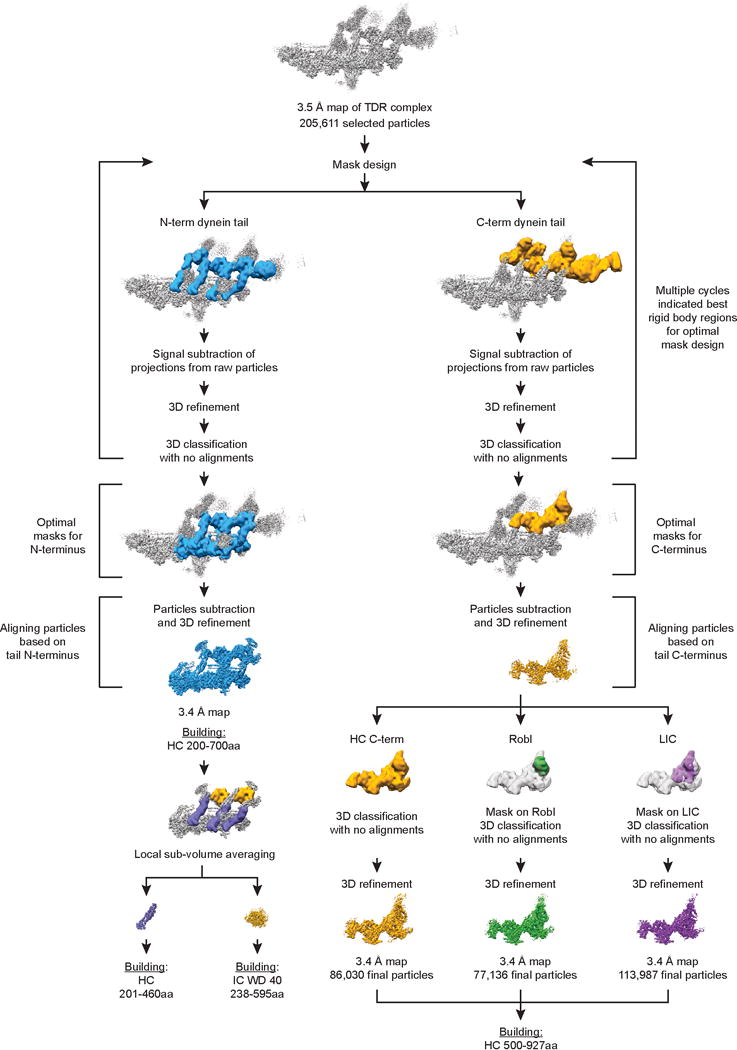
Focussed 3D classification and refinement procedures used in this study to improve density maps for dynein tail.
Extended Data Figure 5. Secondary structure diagram of dynein HC.
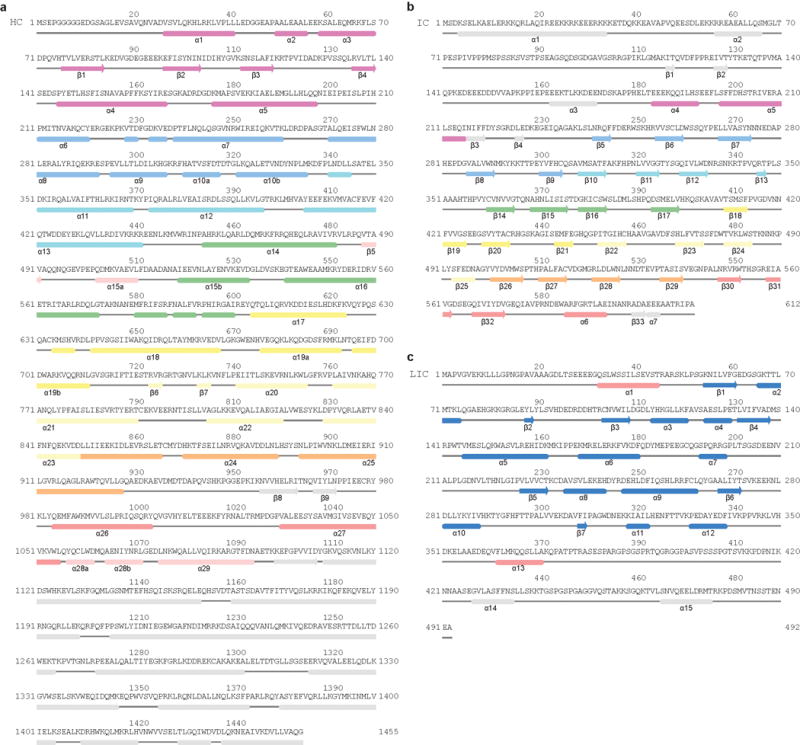
a, Secondary structure elements of dynein HC are matched against the primary sequence showing the NDD (purple) and the dynein helical bundles (blue; cyan; green; yellow; pale yellow; orange; red; pink). b, Secondary structure elements of IC. Extended N-terminal regions are colored in purple and other elements are colored according the blade of the WD40 domain to which they belong, except sheet β5, which associates with β30-32. c, Secondary structure elements of LIC, showing the globular domain helices and sheets (blue) and the two helices that pack against the HC (red). Jpred53 secondary structure predictions of features not seen in the EM map are shown in grey.
Extended Data Figure 6. Interactions between dynein subunits.
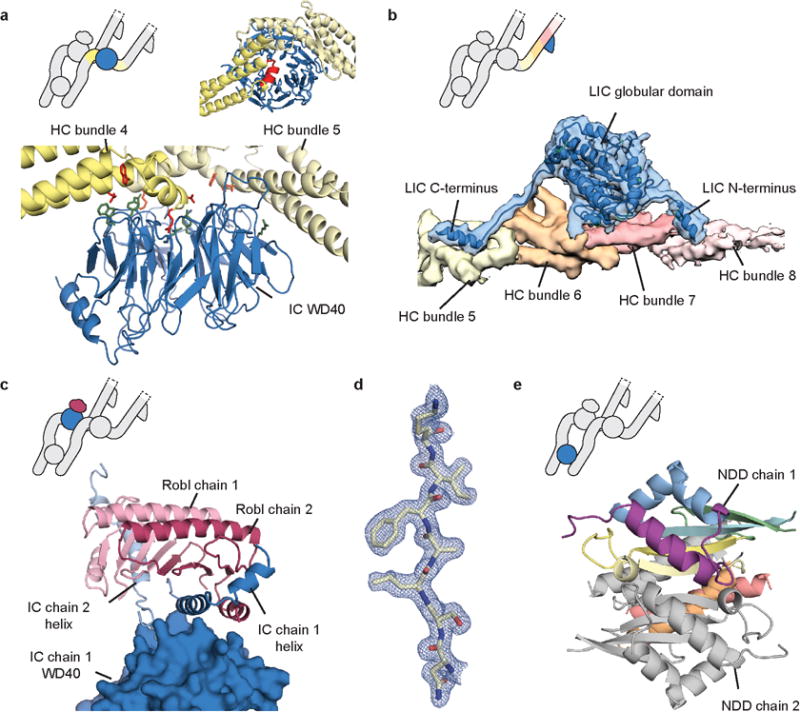
a, The dynein HC (yellow) interacts with the IC WD40 domain (blue) using bundle 4 and 5, with a helical segment (red cartoon) sitting in the WD40 central cavity. Interacting residues are shown as sticks (bottom panel) with HC residues in red, and IC residues in green. b, Density map and model showing how the LIC (density and cartoon, blue) N- and C-terminal regions extend from the globular domain and pack against the HC (density, colored by bundle number). c, Robl (cartoon, light and dark pink) makes contacts to the IC N-terminal helices (cartoon, light and dark blue), which mediate the interaction between Robl and the IC WD40 (surface). d, Representative density from the 1.9 Å resolution N-terminal dimerization domain (NDD) crystal structure. e, Cartoon model of the NDD showing one chain in rainbow spectrum.
Extended Data Figure 7. Dynein-dynein contacts and interactions at the BICDR1 N-terminus.
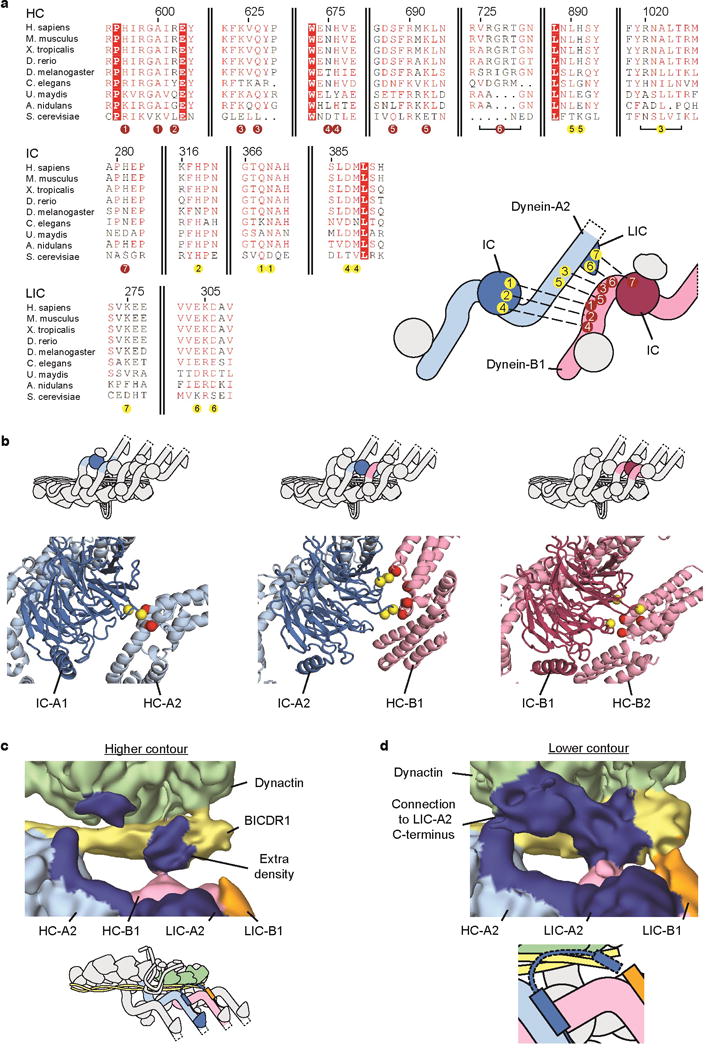
a, Conservation diagram showing sequence similarity between dynein-A2/dynein-B1 interacting residues. Residues colored in white with red background are totally conserved, whereas residues coloured in red show sequence similarity at that position. Residues at each interaction site are numbered below the alignment (dynein-A2 residues in yellow circles, dynein-B1 residues in red circles). These numbers label the accompanying cartoon to show the dynein chains that make up each interaction. Alignment generated by ESPript54 (http://espript.ibcp.fr). b, Intermediate chain interactions showing connections between IC-A1 and HC-A2; IC-A2 and HC-B1; and IC-B1 and HC-B2. Interacting sites on each IC are shown as yellow spheres, whereas sites on each HC are shown as red spheres. c, Dynein-B1 (pink) contacts extra density (labeled, blue) adjacent to the BICDR1 coiled coil. The cartoon below shows the location of the area depicted (colored). d, Weak density connects the extra density with LIC-A2 helix 13 (blue). A cartoon representation of the area depicted is shown below.
Extended Data Figure 8. Comparison between different adaptors recruiting dynein.
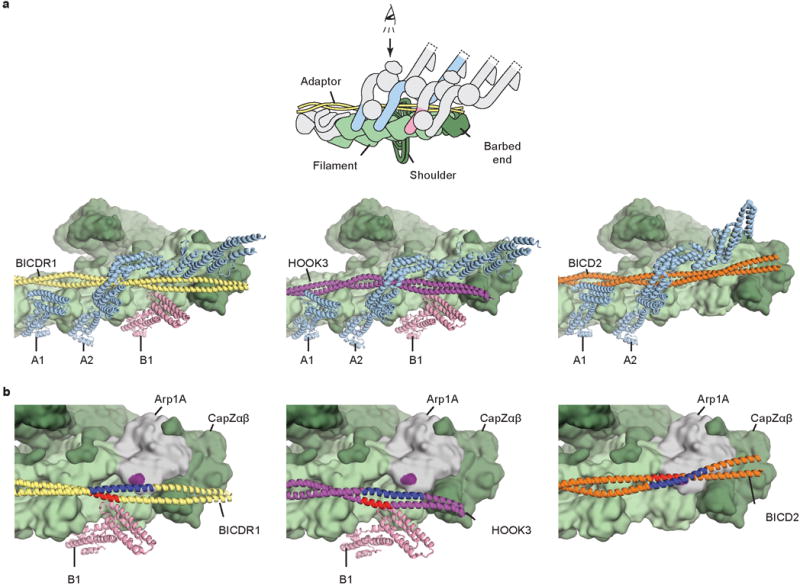
a, The dynein tail/dynactin/BICDR1 (TDR) structure (left) is compared to models of dynein tail/dynactin/HOOK3 (TDH, middle) and dynein tail/dynactin/BICD2 (TDB, right). Though the paths of BICDR1 (yellow), HOOK3 (magenta) and BICD2 (orange) vary along the surface of dynactin (green surface), dynein A HCs (light blue) bind at the same sites. b, Zoomed views of the barbed end of dynactin show that whereas BICDR1 and HOOK3 adopt lower positions to bind dynein-B using region in red, BICD2 adopts an upwards position to contact Arp1A (gray). The BICD2:Arp1A interaction site is highlighted in purple.
Extended Data Table 1.
Cryo-EM data collection parameters of TDR and TDH structures and model refinement statistics of the 3.5 Å TDR structure
| TDR_1 | TDR_21 | TDH | |
|---|---|---|---|
| Data collection and processing | |||
| Voltage (kV) | 300 | 300 | 300 |
| Electron exposure (e–/Å2) | 52 | 52 | 45 |
| Pixel size (Å) | 1.34 | 1.34 | 1.42 |
| Number of sessions | 1 | 11 | 5 |
| Micrographs | 2,459 | 26,906 | 5,464 |
| Symmetry imposed | C1 | C1 | C1 |
| Final particle images (no.) | 12,420 | 205,611 | 23,407 |
| Map resolution (Å) | 6.5 | 3.5 | 6.7 |
| FSC threshold | 0.143 | 0.143 | 0.143 |
| N-term tail2 | C-term tail3 | TDR | TDR(ordered)4 | |
|---|---|---|---|---|
| Refinement | ||||
| Map | N-term tail | C-term tail | Overall | Overall |
| Map resolution (Å) | 3.4 | 3.4 | 8 | 3.5 |
| FSC threshold | 0.143 | 0.143 | 0.143 | 0.143 |
| Map sharpening B factor (Å2) | −50 | −30 | 0 | −70 |
| Map CC (around atoms) | 0.76 | 0.70 | 0.79 | 0.65 |
| Model composition | ||||
| Non-hydrogen atoms | 28,871 | 5,164 | 92,789 | 90,725 |
| Protein residues | 3,555 | 628 | 13,982 | 13,567 |
| Ligands (ADP/ATP) | 0/0 | 0/0 | 9/1 | 9/1 |
| R.m.s. deviations | ||||
| Bond lengths (Å) | 0.02 | 0.01 | 0.01 | 0.01 |
| Bond angles (°) | 1.59 | 1.93 | 1.60 | 1.60 |
| Validation | ||||
| MolProbity score | 2.12 | 2.21 | 2.05 | 2.05 |
| Clashscore | 11.18 | 13.19 | 9.08 | 9.08 |
| Poor rotamers (%) | 0.29 | 0.36 | 0.44 | 0.44 |
| Ramachandran plot | ||||
| Favored (%) | 89.83 | 88.75 | 89.13 | 89.17 |
| Disallowed (%) | 0.11 | 0.16 | 0.14 | 0.14 |
| Cβ deviations (%) | 0.00 | 0.00 | 0.00 | 0.00 |
TDR_1 dataset is included in TDR_2 dataset.
The N-term tail model consists of HC A2 (residues 201-829), HC B1 (residues 201-629), HC B2 (residues 201-575), IC A2 WD40 domain, BICDR1 (residues 132-210), Arp1B, Arp1D, Arp1F, CapZa and CapZb.
The C-term tail model consists of HC A2 (residues 517-927) and HC B1 (residues 453-702).
The TDR(ordered) model consists of all parts of TDR for which density is seen.
Extended Data Table 2.
Crystal structure data collection parameters and model refinement statistics of the 1.9 Å structure of the human dynein N-terminal dimerization domain
| NDD (PDB 50W0) | |
|---|---|
| Data collection | |
| Space group | P 2 21 21 |
| Cell dimensions | |
| a, b, c (Å) | 50.5, 101.8, 176.19 |
| α, β, γ (°) | 90, 90, 90 |
| Resolution (Å) | 50.45-1.86 (1.94-1.86)* |
| Rmerge | 0.291 (3.939) |
| I/σI | 3.9 (0.4) |
| Completeness (%) | 94.3(98.5) |
| Redundancy | 3.1 (2.9) |
| Refinement | |
| Resolution (Å) | 1.80 |
| No. reflections | 48901 |
| Rwork/Rfree | 27.09/29.24 |
| B-factor, from Wilson plot (Å) | 25.7 |
| R.m.s. deviations | |
| Bond lengths (Å) | 0.02 |
| Bond angles (°) | 2.15 |
Values in parentheses are for highest-resolution shell.
Supplementary Material
Acknowledgments
We thank S. Scheres, X. Bai, K. Vinothkumar and R. Leiro for cryo-EM advice; S. Chen, G. McMullan, C. Savva, G. Cannone, J. Grimmett, and T. Darling for technical support; S. Bullock for SNAPf-dynein(1-1074-GST); M. Yu for crystallography support and the European Synchrotron Radiation Facility (beamline ID29) for data collection; T. Croll for model building; S. Bullock, L. Passmore, S. Lacey and H. Foster for manuscript comments; G. Lander for discussions. This work was funded by Wellcome (WT100387), MRC (MC_UP_A025_1011) to A.P.C.; NIH (GM094522), NSF (MCB-1055017, MCB-1617028) to A.Y.
Footnotes
Supplementary Information is available in the online version of the paper.
Author Contributions
L.U. performed all cryo-EM work on TDR and C.K.L. on TDH. L.U., C.K.L., M.M.E and A.P.C. perfomed single-molecule experiments. L.U. performed negative-stain EM. M.M.E. and A.Y. performed optical trapping. E.M-R determined the NDD structure. C.M. made dynein(1-1455). A.P.C., L.U. and C.K.L built and refined the TDR model and prepared the manuscript.
Data availability
Cryo-EM maps were deposited in the EMDB (EMD-4168, EMD-4169, EMD-4170, EMD-4171, EMD-4172, EMD-4177). Coordinates were submitted to the RCSB (6F1T, 6F1U, 6F1V, 6F1Y, 6F1Z, 6F38, 6F3A). Raw data are available from A.P.C.
Code availability
Code used is availbale from A.P.C.
Competing interest declaration
The authors declare no competing financial interests.
References
- 1.Roberts AJ, Kon T, Knight PJ, Sutoh K, Burgess SA. Functions and mechanics of dynein motor proteins. Nat Rev Mol Cell Biol. 2013;14:713–726. doi: 10.1038/nrm3667. [DOI] [PMC free article] [PubMed] [Google Scholar]
- 2.Klinman E, Holzbaur ELF. Comparative analysis of axonal transport markers in primary mammalian neurons. Methods in Cell Biology. 2016;131:409–424. doi: 10.1016/bs.mcb.2015.06.011. [DOI] [PubMed] [Google Scholar]
- 3.Burkhardt JK, Echeverri CJ, Nilsson T, Vallee RB. Overexpression of the dynamitin (p50) subunit of the dynactin complex disrupts dynein-dependent maintenance of membrane organelle distribution. J Cell Biol. 1997;139:469–484. doi: 10.1083/jcb.139.2.469. [DOI] [PMC free article] [PubMed] [Google Scholar]
- 4.Ben-Yaakov K, et al. Axonal transcription factors signal retrogradely in lesioned peripheral nerve. EMBO J. 2012;31:1350–63. doi: 10.1038/emboj.2011.494. [DOI] [PMC free article] [PubMed] [Google Scholar]
- 5.McKenney RJ, Huynh W, Tanenbaum ME, Bhabha G, Vale RD. Activation of cytoplasmic dynein motility by dynactin-cargo adapter complexes. Science (80-) 2014;345:337–341. doi: 10.1126/science.1254198. [DOI] [PMC free article] [PubMed] [Google Scholar]
- 6.Schlager MA, Hoang HT, Urnavicius L, Bullock SL, Carter AP. In vitro reconstitution of a highly processive recombinant human dynein complex. EMBO J. 2014;33:1855–1868. doi: 10.15252/embj.201488792. [DOI] [PMC free article] [PubMed] [Google Scholar]
- 7.Chowdhury S, Ketcham SA, Schroer TA, Lander GC. Structural organization of the dynein-dynactin complex bound to microtubules. Nat Struct Mol Biol. 2015;22:345–347. doi: 10.1038/nsmb.2996. [DOI] [PMC free article] [PubMed] [Google Scholar]
- 8.Urnavicius L, et al. The structure of the dynactin complex and its interaction with dynein. Science (80-) 2015;347:1441–1446. doi: 10.1126/science.aaa4080. [DOI] [PMC free article] [PubMed] [Google Scholar]
- 9.Zhang K, et al. Cryo-EM Reveals How Human Cytoplasmic Dynein Is Auto-inhibited and Activated. Cell. 2017;169:1303–1314. doi: 10.1016/j.cell.2017.05.025. [DOI] [PMC free article] [PubMed] [Google Scholar]
- 10.Redwine WB, et al. The human cytoplasmic dynein interactome reveals novel activators of motility. Elife. 2017;6 doi: 10.7554/eLife.28257. [DOI] [PMC free article] [PubMed] [Google Scholar]
- 11.Olenick MA, Tokito M, Boczkowska M, Dominguez R, Holzbaur EL. Hook Adaptors Induce Unidirectional Processive Motility by Enhancing the Dynein-Dynactin Interaction. J Biol Chem. 2016;291:18239–18251. doi: 10.1074/jbc.M116.738211. [DOI] [PMC free article] [PubMed] [Google Scholar]
- 12.Gama JB, et al. Molecular mechanism of dynein recruitment to kinetochores by the Rod-Zw10-Zwilch complex and Spindly. J Cell Biol. 2017;216:943–960. doi: 10.1083/jcb.201610108. [DOI] [PMC free article] [PubMed] [Google Scholar]
- 13.Zheng W. Probing the Energetics of Dynactin Filament Assembly and the Binding of Cargo Adaptor Proteins Using Molecular Dynamics Simulation and Electrostatics-Based Structural Modeling. Biochemistry. 2017;56:313–323. doi: 10.1021/acs.biochem.6b01002. [DOI] [PubMed] [Google Scholar]
- 14.Schlager MA, et al. Bicaudal d family adaptor proteins control the velocity of Dynein-based movements. Cell Rep. 2014;8:1248–1256. doi: 10.1016/j.celrep.2014.07.052. [DOI] [PubMed] [Google Scholar]
- 15.Cianfrocco MA, DeSantis ME, Leschziner AE, Reck-Peterson SL. Mechanism and Regulation of Cytoplasmic Dynein. Annu Rev Cell Dev Biol. 2015;31:83–108. doi: 10.1146/annurev-cellbio-100814-125438. [DOI] [PMC free article] [PubMed] [Google Scholar]
- 16.Schlager MA, et al. Pericentrosomal targeting of Rab6 secretory vesicles by Bicaudal-D-related protein 1 (BICDR-1) regulates neuritogenesis. EMBO J. 2010;29:1637–1651. doi: 10.1038/emboj.2010.51. [DOI] [PMC free article] [PubMed] [Google Scholar]
- 17.Bielska E, et al. Hook is an adapter that coordinates kinesin-3 and dynein cargo attachment on early endosomes. J Cell Biol. 2014;204:989–1007. doi: 10.1083/jcb.201309022. [DOI] [PMC free article] [PubMed] [Google Scholar]
- 18.Zhang J, Qiu R, Arst HN, Peñalva MA, Xiang X. HookA is a novel dynein–early endosome linker critical for cargo movement in vivo. J Cell Biol. 2014;204 doi: 10.1083/jcb.201308009. [DOI] [PMC free article] [PubMed] [Google Scholar]
- 19.Schroeder CM, Vale RD. Assembly and activation of dynein-dynactin by the cargo adaptor protein Hook3. J Cell Biol. 2016;214:309–318. doi: 10.1083/jcb.201604002. [DOI] [PMC free article] [PubMed] [Google Scholar]
- 20.Grotjahn DA, et al. Cryo-electron tomography reveals that dynactin recruits a team of dyneins for processive motility. 2017 doi: 10.1038/s41594-018-0027-7. Preprint at https://www.biorxiv.org/content/early/2017/08/31/182576. [DOI] [PMC free article] [PubMed]
- 21.Belyy V, et al. The mammalian dynein–dynactin complex is a strong opponent to kinesin in a tug-of-war competition. Nat Cell Biol. 2016;18:1018–1024. doi: 10.1038/ncb3393. [DOI] [PMC free article] [PubMed] [Google Scholar]
- 22.Svoboda K, Schmidt CF, Schnapp BJ, Block SM. Direct observation of kinesin stepping by optical trapping interferometry. Nature. 1993;365:721–727. doi: 10.1038/365721a0. [DOI] [PubMed] [Google Scholar]
- 23.Rai AK, Rai A, Ramaiya AJ, Jha R, Mallik R. Molecular Adaptations Allow Dynein to Generate Large Collective Forces inside Cells. Cell. 2013;152:172–182. doi: 10.1016/j.cell.2012.11.044. [DOI] [PubMed] [Google Scholar]
- 24.Rai A, et al. Dynein Clusters into Lipid Microdomains on Phagosomes to Drive Rapid Transport toward Lysosomes. Cell. 2016;164:722–734. doi: 10.1016/j.cell.2015.12.054. [DOI] [PMC free article] [PubMed] [Google Scholar]
- 25.Hendricks AG, Holzbaur ELF, Goldman YE. Force measurements on cargoes in living cells reveal collective dynamics of microtubule motors. Proc Natl Acad Sci U S A. 2012;109:18447–52. doi: 10.1073/pnas.1215462109. [DOI] [PMC free article] [PubMed] [Google Scholar]
- 26.Driller-Colangelo AR, Chau KWL, Morgan JM, Derr ND. Cargo rigidity affects the sensitivity of dynein ensembles to individual motor pausing. Cytoskeleton. 2016;73:693–702. doi: 10.1002/cm.21339. [DOI] [PubMed] [Google Scholar]
- 27.Derr ND, et al. Tug-of-War in Motor Protein Ensembles Revealed with a Programmable DNA Origami Scaffold. Science (80-) 2012;338:662–665. doi: 10.1126/science.1226734. [DOI] [PMC free article] [PubMed] [Google Scholar]
- 28.Reck-Peterson SL, et al. Single-molecule analysis of dynein processivity and stepping behavior. Cell. 2006;126:335–348. doi: 10.1016/j.cell.2006.05.046. [DOI] [PMC free article] [PubMed] [Google Scholar]
- 29.Baumbach J, et al. Lissencephaly-1 is a context-dependent regulator of the human dynein complex. Elife. 2017;6 doi: 10.7554/eLife.21768. [DOI] [PMC free article] [PubMed] [Google Scholar]
- 30.Gutierrez PA, Ackermann BE, Vershinin M, McKenney RJ. Differential effects of the dynein-regulatory factor Lissencephaly-1 on processive dynein-dynactin motility. J Biol Chem. 2017;292:12245–12255. doi: 10.1074/jbc.M117.790048. [DOI] [PMC free article] [PubMed] [Google Scholar]
- 31.Schroeder CM, Ostrem JML, Hertz NT, Vale RD. A Ras-like domain in the light intermediate chain bridges the dynein motor to a cargo-binding region. Elife. 2014;3 doi: 10.7554/eLife.03351. [DOI] [PMC free article] [PubMed] [Google Scholar]
- 32.Hall J, Song Y, Karplus PA, Barbar E. The crystal structure of dynein intermediate chain-light chain roadblock complex gives new insights into dynein assembly. J Biol Chem. 2010;285:22566–22575. doi: 10.1074/jbc.M110.103861. [DOI] [PMC free article] [PubMed] [Google Scholar]
- 33.Williams JC, et al. Structural and thermodynamic characterization of a cytoplasmic dynein light chain-intermediate chain complex. Proc Natl Acad Sci USA. 2007;104:10028–10033. doi: 10.1073/pnas.0703614104. [DOI] [PMC free article] [PubMed] [Google Scholar]
- 34.King SJ, Bonilla M, Rodgers ME, Schroer TA. Subunit organization in cytoplasmic dynein subcomplexes. Protein Sci. 2002;11:1239–50. doi: 10.1110/ps.2520102. [DOI] [PMC free article] [PubMed] [Google Scholar]
- 35.Tomishige M, Vale RD. Controlling kinesin by reversible disulfide cross-linking: Identifying the motility-producing conformational change. J Cell Biol. 2000;151:1081–1092. doi: 10.1083/jcb.151.5.1081. [DOI] [PMC free article] [PubMed] [Google Scholar]
- 36.Dodd RB, et al. Solution structure of the Kaposi’s sarcoma-associated herpesvirus K3 N-terminal domain reveals a novel E2-binding C4HC3-type RING domain. J Biol Chem. 2004;279:53840–53847. doi: 10.1074/jbc.M409662200. [DOI] [PubMed] [Google Scholar]
- 37.Studier FW. Protein production by auto-induction in high density shaking cultures. Protein Expr Purif. 2005;41:207–34. doi: 10.1016/j.pep.2005.01.016. [DOI] [PubMed] [Google Scholar]
- 38.Incardona MF, et al. EDNA: A framework for plugin-based applications applied to X-ray experiment online data analysis. J Synchrotron Radiat. 2009;16:872–879. doi: 10.1107/S0909049509036681. [DOI] [PubMed] [Google Scholar]
- 39.Adams PD, et al. PHENIX : a comprehensive Python-based system for macromolecular structure solution. Acta Crystallogr Sect D Biol Crystallogr. 2010;66:213–221. doi: 10.1107/S0907444909052925. [DOI] [PMC free article] [PubMed] [Google Scholar]
- 40.Emsley P, Cowtan K. Coot: model-building tools for molecular graphics. Acta Crystallogr D Biol Crystallogr. 2004;60:2126–2132. doi: 10.1107/S0907444904019158. [DOI] [PubMed] [Google Scholar]
- 41.Murshudov GN, et al. REFMAC5 for the refinement of macromolecular crystal structures. Acta Crystallogr D Biol Crystallogr. 2011;67:355–367. doi: 10.1107/S0907444911001314. [DOI] [PMC free article] [PubMed] [Google Scholar]
- 42.Zheng SQ, et al. MotionCor2: anisotropic correction of beam-induced motion for improved cryo-electron microscopy. Nat Methods. 2017;14:331–332. doi: 10.1038/nmeth.4193. [DOI] [PMC free article] [PubMed] [Google Scholar]
- 43.Mindell JA, Grigorieff N. Accurate determination of local defocus and specimen tilt in electron microscopy. J Struct Biol. 2003;142:334–347. doi: 10.1016/s1047-8477(03)00069-8. [DOI] [PubMed] [Google Scholar]
- 44.Kimanius D, Forsberg BO, Scheres SH, Lindahl E. Accelerated cryo-EM structure determination with parallelisation using GPUs in RELION-2. Elife. 2016;5 doi: 10.7554/eLife.18722. [DOI] [PMC free article] [PubMed] [Google Scholar]
- 45.Bharat TAM, Russo CJ, Löwe J, Passmore LA, Scheres SHW. Advances in Single-Particle Electron Cryomicroscopy Structure Determination applied to Sub-tomogram Averaging. Structure. 2015;23:1743–53. doi: 10.1016/j.str.2015.06.026. [DOI] [PMC free article] [PubMed] [Google Scholar]
- 46.Nguyen THD, et al. Cryo-EM structure of the yeast U4/U6.U5 tri-snRNP at 3.7 Å resolution. Nature. 2016;530:298–302. doi: 10.1038/nature16940. [DOI] [PMC free article] [PubMed] [Google Scholar]
- 47.Pettersen EF, et al. UCSF Chimera–a visualization system for exploratory research and analysis. J Comput Chem. 2004;25:1605–1612. doi: 10.1002/jcc.20084. [DOI] [PubMed] [Google Scholar]
- 48.Kelley LA, Mezulis S, Yates CM, Wass MN, Sternberg MJ. The Phyre2 web portal for protein modeling, prediction and analysis. Nat Protoc. 2015;10:845–858. doi: 10.1038/nprot.2015.053. [DOI] [PMC free article] [PubMed] [Google Scholar]
- 49.Zhang K, et al. Gctf: Real-time CTF determination and correction. J Struct Biol. 2016;193:1–12. doi: 10.1016/j.jsb.2015.11.003. [DOI] [PMC free article] [PubMed] [Google Scholar]
- 50.Tang G, et al. EMAN2: an extensible image processing suite for electron microscopy. J Struct Biol. 2007;157:38–46. doi: 10.1016/j.jsb.2006.05.009. [DOI] [PubMed] [Google Scholar]
- 51.Schneider CA, Rasband WS, Eliceiri KW. NIH Image to ImageJ: 25 years of image analysis. Nat Methods. 2012;9:671–675. doi: 10.1038/nmeth.2089. [DOI] [PMC free article] [PubMed] [Google Scholar]
- 52.Kucukelbir A, Sigworth FJ, Tagare HD. Quantifying the local resolution of cryo-EM density maps. Nat Methods. 2014;11:63–65. doi: 10.1038/nmeth.2727. [DOI] [PMC free article] [PubMed] [Google Scholar]
- 53.Drozdetskiy A, et al. JPred4: a protein secondary structure prediction server. Nucleic Acids Res. 2015;43:W389–W394. doi: 10.1093/nar/gkv332. [DOI] [PMC free article] [PubMed] [Google Scholar]
- 54.Robert X, Gouet P. Deciphering key features in protein structures with the new ENDscript server. Nucleic Acids Res. 2014;42(W1):W320–W324. doi: 10.1093/nar/gku316. [DOI] [PMC free article] [PubMed] [Google Scholar]
Associated Data
This section collects any data citations, data availability statements, or supplementary materials included in this article.


