Abstract
Disagreements about the mechanisms of cement hydration remain despite the fact that portland cement has been studied extensively for over 100 years. One reason for this is that direct observation of the change in microstructure and chemistry are challenging for many experimental techniques. This paper presents results from synchrotron nano X-ray tomography and fluorescence imaging. The data show unprecedented direct observations of small collections of C3S particles before and after different periods of hydration in 15 mmol/L lime solution. X-ray absorption contrast is used to make three dimensional maps of the changes of these materials with time. The chemical compositions of hydration products are then identified with X-ray fluorescence mapping and scanning electron microscopy. These experiments are used to provide insight into the rate and morphology of the microstructure formation.
Keywords: Microstructure, Ca3SiO5, Hydration product, EDX, Nano-tomography
1. Introduction
Tricalcium silicate (C3S)1 is a major component of portland cement. It reacts with water to form calcium silicate hydrate (C-S-H) and calcium hydroxide (CH). This hydration process determines most of the early-age properties of concrete and has been studied for decades. If one could understand and predict the kinetics and microstructure development during this process, strategies could be designed to control it and thereby improve the quality and economics of concrete. However, the mechanisms of hydration are not fully understood [1,2], and values of many of the thermodynamic and kinetic properties needed to make accurate predictions have not been measured [1–6]. In fact, agreement has still not been reached even about the basic mechanisms of early-age hydration due to a lack of sufficiently detailed experimental observations, especially of direct, in-situ evolution of the microstructure that can be used to guide numerical simulations [1–9].
Scanning electron microscopy with energy dispersive X-ray spectroscopy (SEM-EDS), transmission electron microscopy (TEM), atomic force microscopy (AFM), white light interferometry, and nanoindentation have been used to study cement hydration and to characterize the hydrated microstructure, especially the calcium silicate hydrate product (C-S-H) [10–27]. Generally, C-S-H is classified as “inner” or “outer” products, according to their location relative to the original boundary of the C3S grains [12–26]. However, this classification is limiting because of the difficulty of imaging techniques to locate the original boundary of the C3S grain in a hydrated microstructure. The products have also been classified based on their apparent density and chemistry [13–17,20]. The molar ratio of calcium to silicon (Ca/Si) in C-S-H is commonly accepted to be between 1 and 2 depending, on the hydration environment when the products are formed [22,28–32]. Recent work with SEM-EDS and nanoindention has suggested that there is likely an inter mixing of CH with C-S-H in hardened paste samples [20]. Different degrees of mixing could lead to different Ca/Si of hydration product that are possibly outside typical values [12,33].
Electron microscopy has also suggested that the dissolution of C3S is controlled by the formation and coalescence of etch pits on the grain surfaces [18,19,25,26,35]. These etch pits seem to form preferentially where mechanical damage from grinding or crystalline imperfections are present in the material [18,19,35]. Despite these observations being of great insight, this work has not been able to make direct observations of the evolution of the in-situ structure over time. In addition, these imaging techniques require careful sample preparation that may introduce artifacts. Furthermore, since the surfaces are examined at such high magnification, the observations are highly localized and may not statistically reflect the structure or kinetic behavior at greater length scales. These challenges make it difficult to obtain quantitative measurements that are representative and can aid in the development and validation of predictive models based on chemistry and physics.
Soft X-ray microscopy has been used to take in-situ time-lapse nanoscale transmission images while C3S is reacting at an average water-to-solid (w/s) ratio of five [35,36]. The technique provides information about the structure of the hydration products and the process of formation during in-situ reactions. However, analyzing the images is challenging because the 3D microstructure is projected onto a 2D transmission image. This is similar to the radiographs shown in this paper. Results from this work have suggested that the hydration process occurs not only on the surface, but also inside of the C3S particle, although the technique cannot resolve the specific location and is only roughly quantitative [35].
Recent advances with synchrotron hard X-ray nanoprobes have allowed X-ray nano-computed tomography (nCT) and nano X-ray Fluorescence (nXRF) to become a reality. These techniques are capable of non-destructively imaging at a nanoscale resolution [37–41]. The sample preparations for these techniques are also minimal, so this technique lends itself to evaluating processes that change over time. These techniques can be combined with other experimental methods and the results can be used as a starting point or as a comparison to computer simulations [37–43].
X-ray computed tomography (CT) is commonly used in the medical sciences to non-destructively image the internal structure of organisms. This technique combines a series of X-ray radiographs at small angles of rotation to produce a 3D tomograph [44,45]. In addition to the structural information, the materials investigated have different contrast depending on their X-ray absorption. The X-ray absorption is a function of the density and mass attenuation coefficient. For a given X-ray energy level, the mass attenuation coefficient is a function of the average atomic number with some discontinuities caused by X-ray absorption edges [46–48]. No X-ray absorption edges were encountered for the instrument settings and materials investigated.
If there is significant contrast in X-ray absorption among the constituent materials, the data can be used to separate them in the images. The material interfaces are sometimes highlighted by edge refraction [49,50], which can be used to find edges in low-contrast images. The use of nCT for construction materials has been quite limited. However work has been done to investigate the 3D structure of aluminosilicate geopolymer gel and the early stages of reaction of fly ash [37,38].
nXRF is a powerful tool when combined with nCT because it can provide elemental maps with detection limits better than a part per million (ppm). In this technique, a primary X-ray beam illuminates a sample and an energy dispersive detector is used to measure the fluorescence X-rays emitted by the sample. Each chemical element fluoresces at characteristic energies from the small region, so rastering the primary X-ray beam over the sample enables the creation of 2D chemical maps for the image [38,40,51].
In this paper, nCT is primarily used to investigate individual C3S particles before and then after different time periods of hydration. The full 3D tomography from nCT gives direct observations of the behaviors of C3S hydration at both the surface and inner structure of the samples. The quantitative results from this technique provide accurate measurements of different hydration behaviors at different time periods. Thanks to the non-destructive nature of nCT, the same sample can then be scanned by nXRF. The resulting elemental maps give useful information about the chemical composition of the hydration product.
The goal of this work is to establish the utility of nCT and nXRF to study C3S hydration during its first several hours. Additional work is ongoing to further refine the techniques to improve fundamental understanding of the mechanisms and measuring the relevant structural and kinetic properties that are needed by numerical models of chemical and microstructural evolution; this will be the subject of future publications.
2. Materials
The triclinic C3S powder used in this study was produced by Mineral Research Processing2 (Meyzieu, France). The material has been characterized with inductively coupled plasma optical emission spectroscopy (ICP-OES), X-ray powder diffraction (XRD), automated scanning electron microscopy (ASEM) for particle size distribution analysis, multipoint nitrogen adsorption (BET method), and isothermal calorimetry during 24 h of hydration. Experimental details are contained in the supplementary section. The elemental composition of C3S obtained from ICP-OES and the BET surface area are shown in Table 1. The XRD pattern indicates that this material is close to pure triclinic phase. Based on ASEM observations of 4000 particles, 95 % of them are between 1 μm and 7.5 μm in average dimension. For the calorimetry experiments, two samples were prepared using the w/s of five by mass with a solution of 15 mmol/L Ca(OH)2 at either 25 °C or 50 °C. These samples were designed to replicate the conditions of the nCT and nXRF experiments in this paper. Another sample with w/s of 0.40 using deionized water was also included in order to show the performance of this material in a more practical w/s. For the calorimetry samples with w/s of 5.0, there was no stirring during the reaction and so some settlement is expected during hydration. This means that the timing in the images may not exactly match the calorimetry data; however, the suspension provides an average w/s that matches the nCT experiments and previous soft X-ray microscopy work. Three time periods of hydration in the imaging experiments are labeled on the x-axis as wide bars. The details of the materials characterization are provided in the supplementary information.
Table 1.
The elemental composition based upon a single analysis and the surface area of C3S based on three analysis. An uncertainty in the surface area measurement of one standard deviation is given.
| ICP Elemental analysis | Al | Ca | Mg | Si | Sr |
| (mole %) | <0.2 | 74.8 | <0.002 | 25 | 0.018 |
|
| |||||
| BET surface area (m2/g) | 1.2156± 0.0028 | ||||
3. Experimental Methods
3.1 Sample preparation and hydration
With the low X-ray energy used in these techniques, it was not possible to examine hydration in situ at industrially relevant w/s; a much more dilute suspension was required to permit X-ray transmission. However, dilute suspensions tend to promote extremely rapid initial dissolution rates of C3S, potentially causing them to dissolve completely before measurements could be made. Past research using calorimetry measurements on continually stirred suspensions has shown that mixtures with solutions saturated in lime showed comparable hydration rate profiles in suspensions with w/s from 0.5 up to 5.0 [52,53]. This was also confirmed by calorimetry data presented in Fig. 1. Because of this, a w/s of 5.0 was chosen for these experiments.
Fig. 1.
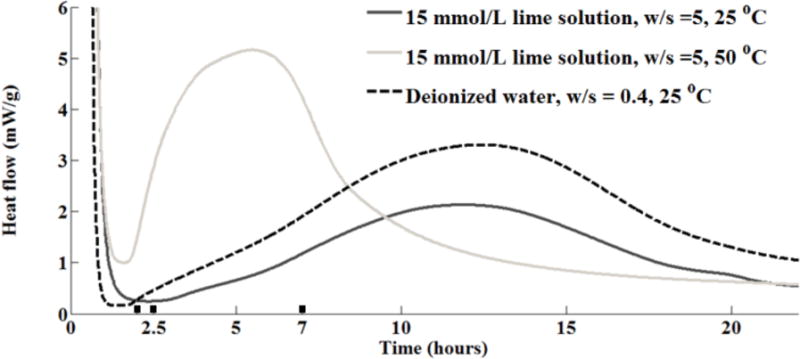
The heat flow from isothermal calorimeter for C3S, in mW/g of C3S based on a single measurement. The bars labeled on the X-axis of the calorimetry curves show the time periods of hydration used in the imaging experiments.
The sample was prepared by first separating individual C3S particles of which sizes were 15 μm or smaller and fixing them to the tip of a tungsten needle with epoxy, as shown in Fig. 2. This size was chosen to ensure the samples would fit within the scan window. Gold particles that were approximately 100 nm in diameter were then placed on the C3S as fiducial markers. A fixed mass of additional C3S powder was affixed to the needle shoulder below the tip. An initial nCT scan of the assembly was performed, and the assembly was stored in a dry nitrogen environment to prevent prehydration or carbonation.
Fig. 2.
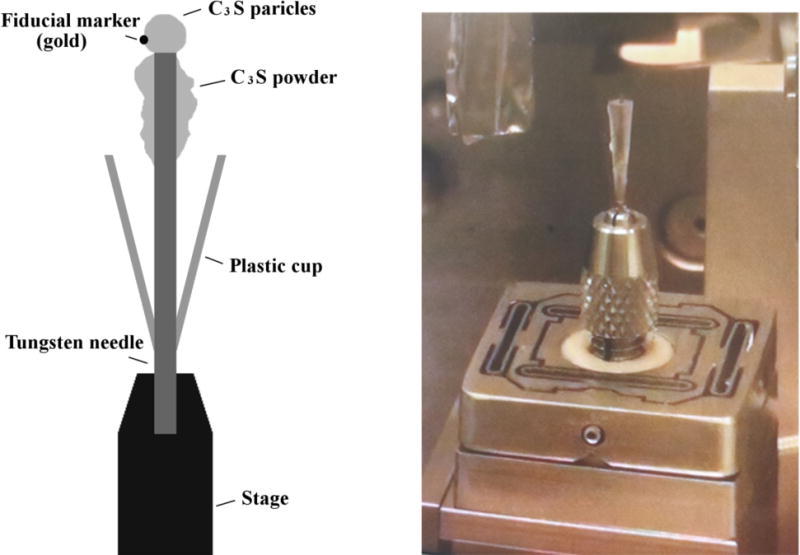
An overview of the experimental setup (left) and the assembled setup on the beam line (right).
To intentionally reduce the initially rapid rate of C3S dissolution that happens in water, these hydration experiments were performed using a 15 mmol/L Ca(OH)2 solution, which was prepared in advance by adding reagent grade lime (CaO) to continuously stirred deionized water.
The solution was filtered and stored in a nitrogen environment to minimize carbonation. The use of lime solution was necessary as rapid dissolution may have caused the particle to fall from the tip of the needle.
A cone-shaped polyethylene cup was tightly fit to the needle for holding the solution (Fig. 2). The particle assembly could be alternately submerged in, then extracted from, the solution by moving the cup up or down along the needle. A volume of solution was added to the polyethylene cup so that w/s = 5.0 in the hydration environment. Each sample was submerged in fresh solution for a given time between 2 h and 7 h. Four samples were tested at 25 °C, including two at 7 h, and one sample (3C) was hydrated at 50 °C. After the prescribed hydration time, the reaction was interrupted by solvent exchange using isopropyl alcohol, and the sample was then imaged again. Isopropyl alcohol was used as it is suggested to cause minimal damage to the sample microstructure [54–58]. To confirm this, radiographs of Sample 3C were taken while submerged in solution and then again after being submerged in isopropyl alcohol. The results will be discussed further in section 4.1. The sample names and the reaction times are summarized in Table 2. The sample names provided merely a means of identification and do not have a specific meaning beyond that.
Table 2.
The dimensions and volumes of the samples before and after hydration based on a single measurement.
| Sample name and scans | Time (h) |
°C | dim-xa (μm) |
dim-ya (μm) |
dim-za (μm) |
Volume (μm3) ± errorb
|
|||
|---|---|---|---|---|---|---|---|---|---|
| C3S | Hydration product | Total | |||||||
| 1C | Before | 6.5 | 9.2 | 4.8 | 82.40±1.24 | 0 | 82.40±1.24 | ||
| 2 | 25 | ||||||||
| After | 6.5 | 9.1 | 4.7 | 82.73±1.24 | 82.73±1.24 | ||||
| 2C | Before | 14.2 | 12.0 | 8.0 | 269.26±4.04 | 0 | 269.26±4.04 | ||
| 2.5 | 25 | ||||||||
| After | 13.5 | 11.6 | 7.7 | 311.58±4.67 | 311.58±4.67 | ||||
| 3C | Before | 8.4 | 13.2 | 4.7 | 101.77±1.52 | 0 | 101.77±1.52 | ||
| 2.5 | 50 | ||||||||
| After | 12.6 | 11.3 | 7.5 | 378.58±5.68 | 378.58±5.68 | ||||
| 4C | Before | 12.0 | 14.6 | 10.7 | 593.96±8.91 | 0 | 593.96±8.91 | ||
| 7 | 25 | ||||||||
| After | 23.3 | 23.3 | 17.1 | 561.09±8.42 | 2611.15±39.17 | 3172.25±47.58 | |||
| 5C | Before | 9.7 | 9.8 | 5.1 | 108.69±1.63 | 0 | 108.69±1.63 | ||
| 7 | 25 | ||||||||
| After | 21.1 | 22.7 | 20.8 | 4011.09±60.17 | 4011.09±60.17 | ||||
The dimensional value are based on accurate scale of one quarter of micron (0.25 μm)
The system error is 1.5 % of the volumetric measurement
The data sets before and after hydration were registered by rigid body translation so that one-to-one comparisons could be made. Next, the data were segmented into different material sets for qualitative and quantitative comparisons. For one sample, nXRF imaging was used to investigate elemental distribution of the hydrated sample. In addition, SEM-EDS imaging was used to confirm these findings. Details of instrumentation settings used in this study, including nCT, nXRF, SEM, and EDS are provided in Table 3.
Table 3.
The instrument settings for, nCT, nXRF, SEM and EDS experiments
| nCT | Resolution | 15.6 nm/pixel | |
| Exposure time | 6 s | ||
| Source energy | 8.3 Kev | ||
| X-ray magnification | x83 | ||
| Optical magnification | x10 | ||
| Dynamic rangesa | min | 27768 | |
| max | 37768 | ||
|
| |||
| nXRF | Resolution | 150 nm/pixel | |
| Detector dwelling time | 0.1 s | ||
| Scaler count time | 0.1 s | ||
|
| |||
| SEMb | Spot size | 40% | |
| Accelerating voltage | ≈20kV | ||
| Filament drive | 75 % | ||
| Emission current | ≈50 μA | ||
| Pico-amp meter reading | 1.15-1.20 nA | ||
| Brightness | −15 % | ||
| Contrast | 90 % | ||
| Magnification | 2500× | ||
| Working distance | 17 to 18 mm | ||
|
| |||
| EDS | Minimum counts per second | 3500 | |
| Live time (acquisition time) | 5 s | ||
: the data are displayed in FLOAT type from 0 to 65535
: backscattered imaging mode
3.2 Nano-tomography
All nCT measurements were made in the Hard X-ray nanoprobe at Sector 26 in a shared space between the Advanced Photon Source (APS) and the Center of Nanoscale Materials (CNM) in Argonne National Laboratory. The instrument settings are given in Table 3 and more details can be found in the study of Winarski et al. [59] and the supplementary information.
Radiographs and tomography are the two types of datasets collected from a nCT experiment. A radiograph is an image of the direct projection of the X-rays. The absorbed X-rays after passing through the sample generate an image, which carries the information from both the surface and interior structure. These data sets are similar to the ones produced by soft X-ray microscopy and can be useful, but sometimes challenging to interpret. A tomograph is the reconstruction of radiographs by combining the images from multiple angles. It is a 3D dataset of slices through the sample. By stacking the slices together, a 3D structural model of the sample can be produced. All of these scans produced a 3D array of pixels (or voxels), with each voxel being 15.6 nm on a side.
The gray value in the radiographs dataset correlates to the X-ray intensity, I, transmitted through the material, which is a function of the mass attenuation coefficient, μm, density, ρ, and path length, x:
| (1) |
where I0 is the intensity of the incident X-ray beam. The mass attenuation coefficient is a function of the chemical composition of the material, and the energy level of the X-rays [60]. The gray value in the slice images of tomography is a function of the mass attenuation and density. In this paper the dark gray values in the nCT data indicate high X-ray absorption and low X-ray transmission. The regions around the edges and internal interfaces of materials have more pronounced refraction which can cause lighter gray values in one side of the edge and darker gray value in the other side. This phenomenon is called an edge enhancement and can be used by phase contrast imaging to enhance the visibility of edges [49,50].
Volumetric information can be obtained from nCT data by separating the slice images into regions of different constituents based on their gray values into regions of different constituents. Due to the low contrast of the nanoscale imaging, the segmentation is not feasible by simple threshold of the gray value [38,43]. The enhancement of the edges of the sample can be used; but its effectiveness depends on the accuracy and quality of the data and on the materials being imaged. For instance, the separation between solid and air is the easiest to determine, because of the sharp differences in densities. In contrast, the separation of remaining C3S and hydration product is not always perceivable. This work has attempted to be conservative by not reporting results in cases when the data could not be clearly segmented. The location of the needle was used to align the images so that identical locations (within 30 nm) could be compared quantitatively at different hydration times.
In order to minimize the uncertainty of the manual segmentation one operator completed the analysis and then the results were checked by another. In order to establish an uncertainty or estimated error the measured border from nCT and nXRF were compared for two different orientations. The results found that a conservative estimate of the dimensional error of the manual segmentation was 0.1 μm and 1.5% of the measured volume. Because of this, a precision of 0.1 μm was used to report all dimensional measurements and an estimated error of 1.5% is reported for all volume measurements in Table 2. Further details are included in the supplementary information.
After hydration, the dimension of the reacted sample was sometimes larger than the scan window. In these circumstances a mosaic tomography technique was used [61]. In this technique the sample was systematically moved in the field of view and a series of radiographs was captured. The moved sample was then re-centered in the imaging field using the centroid location of the area of needle as the reference point. Successful post-alignment of the radiograph required approximately 20 % overlap between each image recorded. These overlapped regions were then used to stitch the radiographs together into a single image, and then these images were used to reconstruct a tomograph of the sample. This technique allowed a much larger tomograph to be created without sacrificing the resolution of the technique. While mosaic tomography is not a new technique, this is the first time that it has been successfully used at a nano length scale for investigating cementitious materials. This technique was helpful for the data sets obtained from the current study because large volumes of hydration products were common and it was not possible to predict where they would form. The reconstruction software Stanford TXRM Wizard was used [61]. Reconstruction details can be found in the supplementary information.
3.3 Nano X-ray fluorescence
One hydrated sample was investigated with nXRF after completing nCT and another anhydrous sample was investigated with nXRF. Emitted characteristic X-ray fluorescence radiation is detected with a four-element silicon drift energy dispersive detector [59]. Additional details can be found in Hu et al. [38]. Fluorescence was analyzed using the software package MAPS [62]. Fitting and quantification of the fluorescence data were carried out with thin film standards (National Bureau of Standards, Standard Reference Material 1832 and 1833). The detailed settings for the scans are listed in Table 3.
Two major challenges must be overcome to obtain quantitative chemical composition data by nXRF. First, the X-ray beam penetrates into the material and causes X-ray fluorescence along its path, making it difficult to directly render depth-dependent information. Second, X-ray fluorescence is absorbed in the sample before it reaches the detector, which complicates adequate quantification of the signal. A correction needs to be applied first to the original nXRF data before the data can be quantitatively used. However, qualitative observations are still useful and valid to tell the overall distribution of the elemental composition of the sample, using the raw nXRF data. In this study, the absorption artifacts were also minimized for materials closest to the detector. The detector was always present on the left side of the images. The pixel size in each of these scans was 150 nm. The quantitative evaluation of the data has been restricted to a region that was within 3 μm of the left boundary of the sample. That depth was chosen because prior work [63] suggests that less than 25 % of the Si and 5 % of the Ca X-rays should be absorbed in this region. Future work will focus on further refining of the data to examine larger depths.
3.4 SEM-EDS
Partially hydrated samples were investigated by SEM-EDS in order to validate the observations of chemistry from nXRF. The settings of the instrument is given in Table 3. One sample of the anhydrous triclinic C3S material was also investigated.
4. Results and Discussion
A summary of the samples and changes in their dimension and volume are shown in Table 2. The y dimension is the measurement of the particle in the same direction as the X-ray beam used to interrogate the sample. The x dimension is perpendicular to the y dimension but in the same horizontal plane. Finally, the z dimension is perpendicular to the y dimension in the vertical plane.
Samples were investigated at three different time periods of hydration and at two different temperatures. For the C3S and the Ca(OH)2 solution used in this study, not much change was observed in the first two hours of hydration, confirming the efficacy of the Ca(OH)2 solution in slowing the initial reaction. But after 2.5 h the changes were significant. More detailed observations for individual samples will be presented in the following sections.
It should be noted that due to limited synchrotron time only one replicate sample was able to be investigated (7 h of hydration at 25 °C). Although these two samples showed good agreement, the limited number of repeat samples means that care should be taken in drawing strong conclusions at a single time period. However, each presented observation was taken from hundreds of similar observations of the phenomenon from the 3D data sets. This means that strong statements can be made about the stated phenomena and their distribution within a single sample.
4.1 Impact of isopropyl alcohol and radiation dosage on sample integrity
Radiograph experiments were conducted to investigate the influence of isopropyl alcohol on sample preparation. Through these experiments, the geometry and microstructure of the hydrated samples were compared while they were in solution with those after the solvent exchange. Although radiographs do not give 3D information, they only took a short time and were still useful to obtain the information about the boundary and internal changes of the sample.
Fig. 3 shows four different radiographs of Sample 3C, each of which was taken at different conditions: 1) before hydration, 2) after 10 min of hydration, 3) after 2.5 h of hydration, and 4) after the solvent exchange. This test was performed at 50 °C. It should be noted that both radiographs for the anhydrous sample and the sample after submerging in isopropyl alcohol were imaged in air and the others were imaged in lime solution. The border of the particle was identified using the orange line (see the radiographs in the second row of Fig. 3). These lines were drawn based on visual inspection of the images. The gold particle was observed to move during the 2.5 h hydration period. This is likely caused by hydration products forming between the particle and the needle.
Fig. 3.
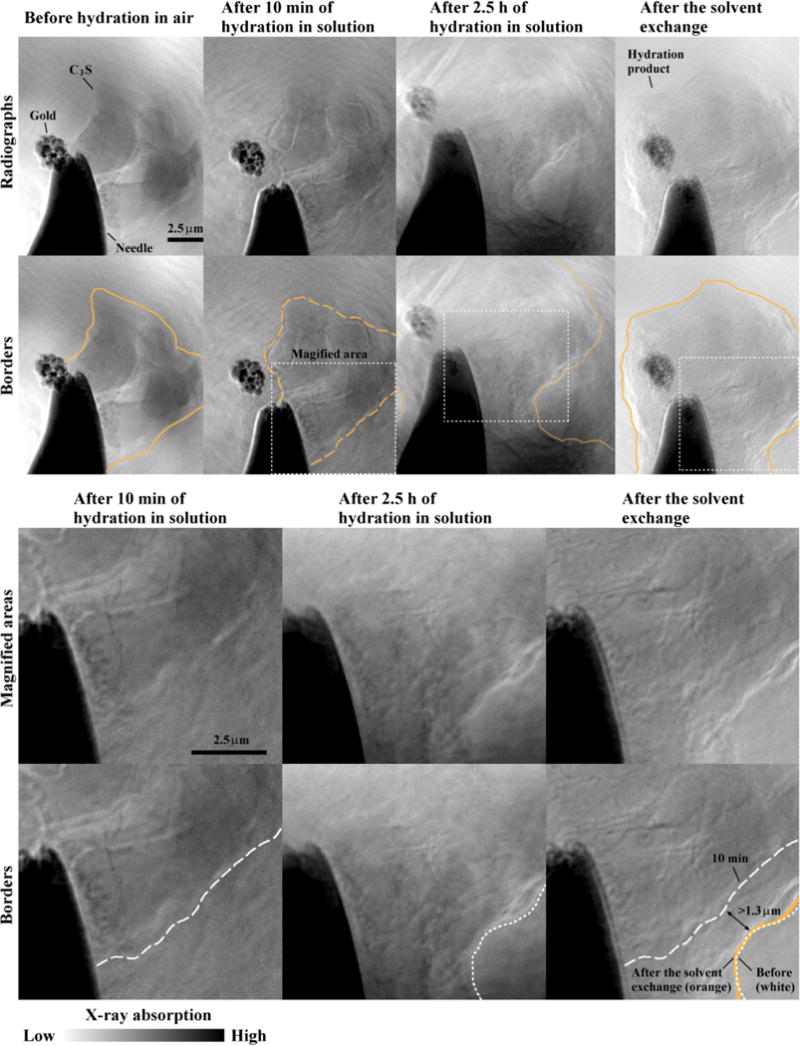
Radiographs of sample 3C before hydration imaged in air, after 10 min and 2.5 h in 15 mmol/L lime solution at 50 °C, and then after the hydration has been stopped with isopropanol. The magnified areas from the last three stages are zoomed in and shown at the bottom with the borders highlighted. The borders at the stage before and after soaking in isopropyl alcohol closely match.
A rectangular area, shown by a white dashed box, has been magnified from three of the radiographs. These areas were chosen because it was easy to observe the edge of the sample in all of the radiographs. These edges were highlighted with white lines in the magnified images, except the border after being exposed to isopropyl alcohol was shown in orange.
In this area, the radiograph data indicate that after 2.5 h of hydration at 50 °C, the particle boundary has expanded by at least 1.3 μm due to the formation of hydration product on the surface of the particles (see Fig. 3). This expansion of hydration product on other areas may be different since the growth seems to not be isotropic. In addition, the sample border closely matched the images from before (white dotted-line) and after (orange line) the sample was exposed to isopropyl alcohol. Furthermore, the interior structure of the sample does not appear to change qualitatively. This suggests that the exposure to isopropyl alcohol seems not to significantly damage the microstructure for this observed region of the sample. This finding supports the work done by others [50,51], while also providing additional data at the nanoscale. It appears that the hydration products in these images were not impacted but it is possible that, if the material was exposed to isopropyl alcohol at earlier times, the more delicate structures might be altered. This is an area for further investigation.
Calculations are included in the appendix that discuss the estimated radiation dosage for a typical sample from a nCT scan. If this radiation dosage had damaged the sample then movement would have been observed during the scan and this would have caused artifacts that would have made the tomograph data blurry. Since this was not observed, the radiation damage is likely not significant for these samples.
4.2 Changes of internal structure at different hydration times
Fig. 4 shows radiographs of Sample 1C after two hours of hydration at 25 °C. The particle boundaries before and after hydration closely match each other. The slice images show that the perimeter of the particle is growing and the surface of the C3S seems to been modified. These changes caused noticeable textural difference between the radiograph images before and after hydration, as shown in Fig. 4. This may be caused by etching of the C3S particle. The very small amount of perimeter change from the individual images compared well with the observations made in Table 2 which showed overall small dimension and volume changes for the Sample 1C. According to the calorimetry curve in Fig. 1, these changes are occurring during the induction period.
Fig. 4.
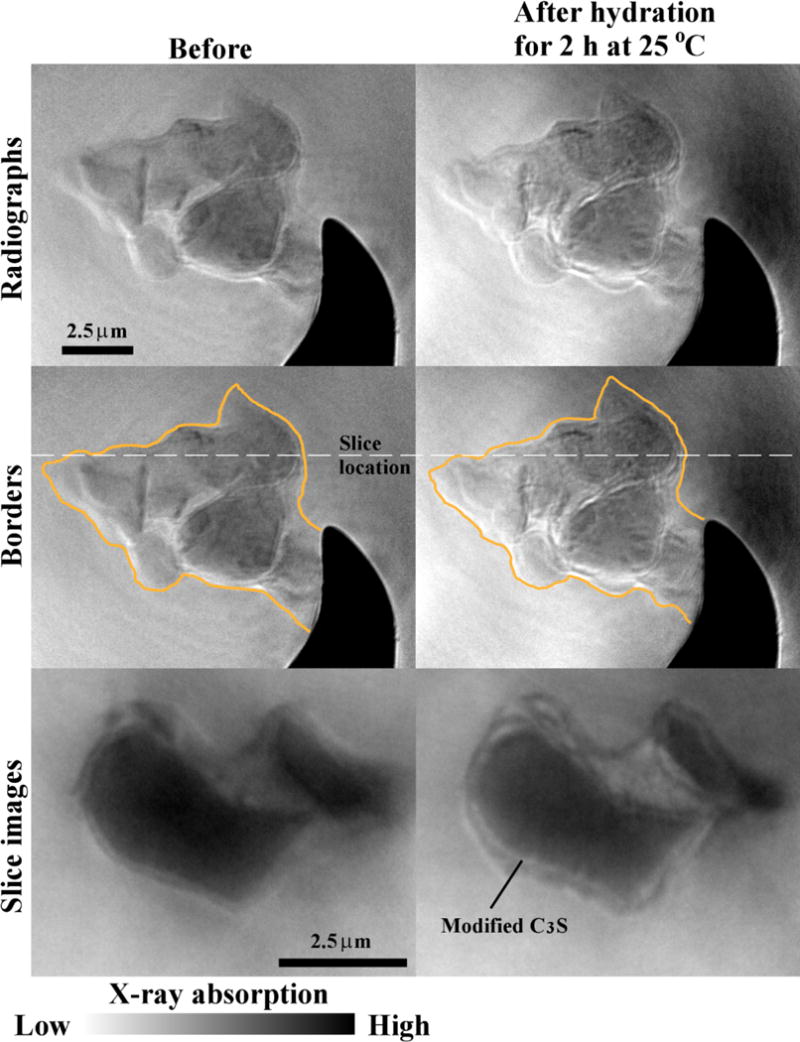
The radiographs and tomography slices of Sample 1C before and after hydration for 2 h at 25 °C.
In contrast, Sample 2C was hydrated just 30 min longer in the same conditions and showed an estimated 16 % increase in volume (Fig. 5). According to the calorimetry curve, this time (2.5 h) corresponds with the beginning of the acceleration period, although there may be differences caused by settlement. The overall dimensions of the sample were almost the same (or showed very slight decrease), but the x dimension decreased about 0.7 μm. This decrease in dimension was likely caused by dissolution. The large increase in volume was caused by the formation of hydration products between two C3S particles that are about 2 μm apart (see the bottom figures in Fig. 5). One C3S particle near the top of the image was approximately 4 μm in diameter and has changed greatly in gray value. This could be caused by dissolution of the particle accompanied by formation of hydration products in this same region [31]. It is also likely that dissolution of particles outside of the viewing window causes hydration product to grow on the observed particles. Moreover, the observation of the hydration product formed between the closely spaced particles suggests that anhydrous particle spacing has an impact on the localized volume of the hydration product at this early period. This localized formation of hydration product is likely caused by higher ion concentrations in this region from the dissolution of the closely spaced particles.
Fig. 5.
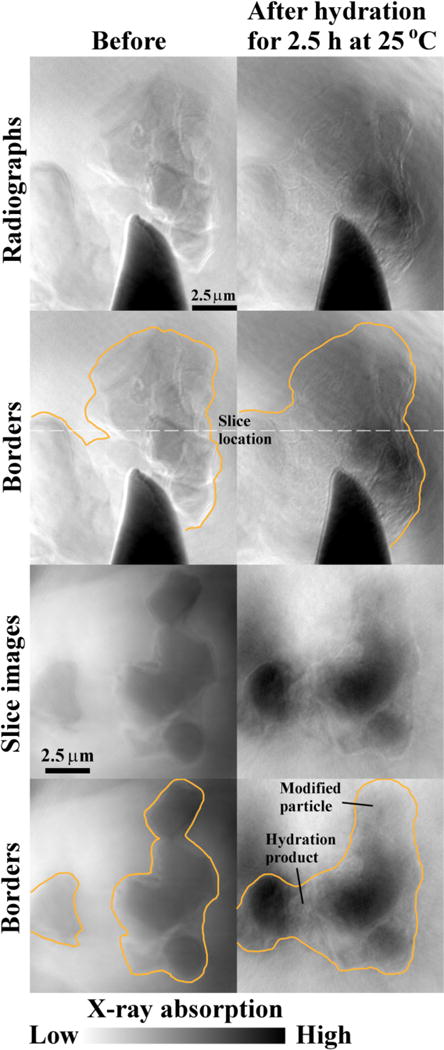
The radiographs and tomography slices of Sample 2C before and after hydration for 2.5 h at 25 °C.
Fig. 6 shows the inner structures of Sample 3C before and after 2.5 h of hydration at 50 °C. Based on the calorimetry curve in Fig. 1, this sample was in the middle of the acceleration period. The locations of slices were selected based on the same locations of the fiducial markers. This marker provided a convenient location to make a comparison in both scans. The border of the collection of particles is shown in orange before and after hydration. The border of a single C3S particle before and after hydration is shown in white to highlight the change after the reaction. The materials between the particles with lower gray value could be air or epoxy. The images after hydration show a substantial growth of the sample and the dissolution of the C3S particle. Table 2 shows that the dimensions of the sample increased by 50 % and the total volume increased almost fourfold. The large volume change at this time period is attributed to the higher temperature, and hence more rapid hydration, of this sample compared to the others during hydration.
Fig. 6.
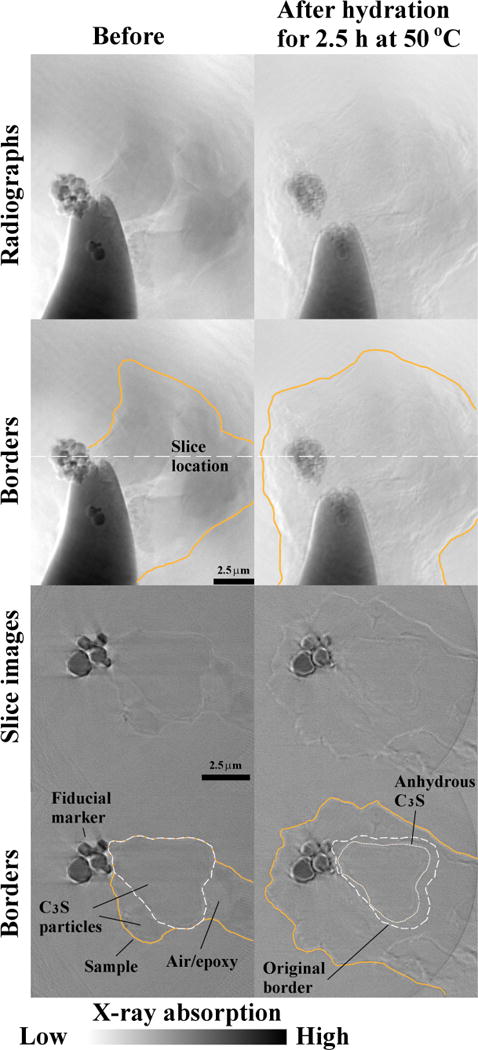
The radiographs and tomography slices of Sample 3C before and after hydration for 2.5 h at 50 °C. In the tomography slices, the borders of one C3S particle are highlighted as white dash line in both hydration stages (the fourth row).
The radiographs and tomography slices of sample 4C after seven hours of hydration are shown in Fig. 7. Based on the calorimetry curves in Fig. 1, this sample is in the middle of the acceleration period. Mosaic tomography was used to construct these images because this sample is larger than the scanning window. A 3D model gives the overall distribution of these materials where the hydration product has been made transparent to show the internal particle boundary. These images show that the hydration product has not formed uniformly around the particles. This could be caused by different sides of the sample having different surface areas, concentration defects, or exposed crystal planes. Over the seven hours of hydration, this sample showed a decrease in C3S volume of only 6 % and a growth of hydration products that is almost 4.5 times the size of the original C3S particles. The images show that hydration product formed between the particles has a higher gray value than the material formed near the edges of the particle. These regions are labeled “high X-ray absorption” and “low X-ray absorption”. This suggests the hydration product is not homogeneous and is likely made up of C-S-H, CH, and air. This will be discussed in greater detail in the next section. Sample 5C is a replicated sample with the same hydration period with a similar amount of growth in dimension and volume. More details of this sample are provided in the supplementary information and in Table 2.
Fig. 7.
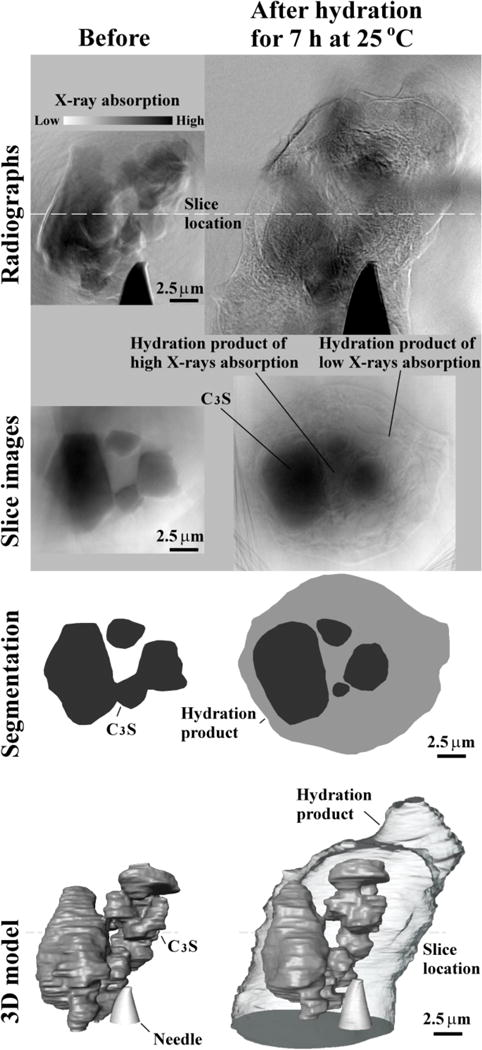
An overview of the results of sample 4C: radiographs, tomography slices, segmentation on slice images and 3D model.
4.3 The 3D analysis of the heterogeneity of hydration product
The difference in gray value indicates different X-ray absorption. According to equation (1) this relates to localized differences in chemistry, density, or both. To quantify this variation the average gray values at different distances away from the anhydrous C3S particle were measured. Nested shells with thickness 0.6 μm were created that follow the outside border of the anhydrous C3S particle; each shell was built on the previous one until the outside of the particle was reached. An example of 2D and 3D cross-sections through the shells is shown in Fig. 8. The average gray value for each 3D shell is then plotted versus the distance from the surface of the remaining C3S particle. For reference, markers have been added that show the average gray values for air, C3S, and hydration product.
Fig. 8.
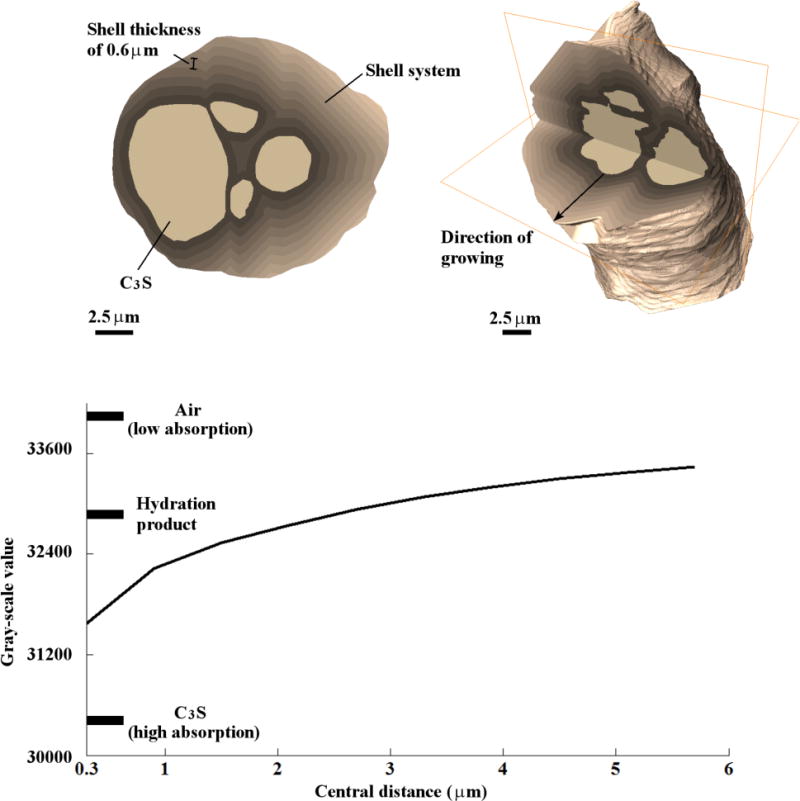
Uniformly thick shells for the 2D and 3D system for sample 4C, and the plot of the mean gray values of the shells versus their central distances from the C3S particle surfaces.
These data show that there are hydration products with different X-ray absorption coefficients at different distances away from the surface of the anhydrous C3S particles. On average, the hydration products within about 1 μm of the surface of the anhydrous C3S have higher X-ray absorption coefficients than other regions. This means that even though a significant volume of hydration products are shown in Table 3, the hydration products do not have a constant chemistry and/or density. This difference in chemistry and/or density matches previous reports in the literature [32–34]. This finding suggests that very low X-ray absorption and likely low-density hydration products that have been suggested by others based on observations from SEM and neutron scattering [13,64]. However, this work provides much more detailed information on 3D spatial heterogeneity and volumetric geometry of the grown material than previous techniques. The high X-ray absorption area between the particles may be more representative of hydration products that form within closely spaced cement paste and the lower X-ray absorption areas may be more representative of products in water-filled spaces.
As will be discussed in more detail, the hydration products in this system is not only made up of C-S-H and is instead likely a blend of C-S-H, CH, and air. This material seems to have a higher X-ray absorption near the surface of the anhydrous C3S particle and in the region between the particles. These areas likely have a higher concentration of C-S-H and lower concentrations of CH and air. The hydration products found greater than 2 μm seem to have a much greater porosity. This region may be observed because of the significant amount of water filled space around the particle. This material is likely very porous as indicated by the X-ray absorption being close in magnitude to that of air. However, these observations are made for a sample in water filled space. The reader should be wary that this may not be representative of a system with more closely packed particles. However, these observations are useful for modeling and understanding of fundamental behavior as it shows that the hydration products have the potential to be a continuum with varying density and chemistry whose formation may be dependent based on the distance from reacting surfaces. Active modeling efforts are being used to study this in more detail.
4.4 Chemical Variation of Hydration Products
Sample 4C, hydrated for 7 h at 25 °C, was also investigated with nXRF. The raw elemental maps for Ca and Si are given in the first row of Fig. 9. The unit of concentration, μg/cm2, measures the mass of elements over the depth within a unit area. An additional map of the molar Ca to Si ratios shows the variation of the elemental composition. Regions of C3S, CH, and hydration product are shown in the second and third rows of Fig. 9. The regions of C3S are determined from the aligned nCT and nXRF data. The elemental Ca map shows that there are regions of high Ca concentration at the top and bottom of the sample with Ca/Si > 15. This suggests that these regions are likely a mixture of CH and C-S-H with larger amounts of CH. These regions dominated by CH were segmented by using a Ca threshold concentration greater than 250 μg/cm2. The remaining material has been labeled hydration product with higher proportion of C-S-H; however, CH, and air is also likely present. As a comparison, an anhydrous C3S particle was also investigated in Fig. 10. The analysis of this particle is helpful as the only material being investigated is C3S. This shows the ability of the method to investigate a system where the path of the beam is only investigating a single material. The mean and standard deviations of the chemistry for each region is given in Table 4.
Fig. 9.
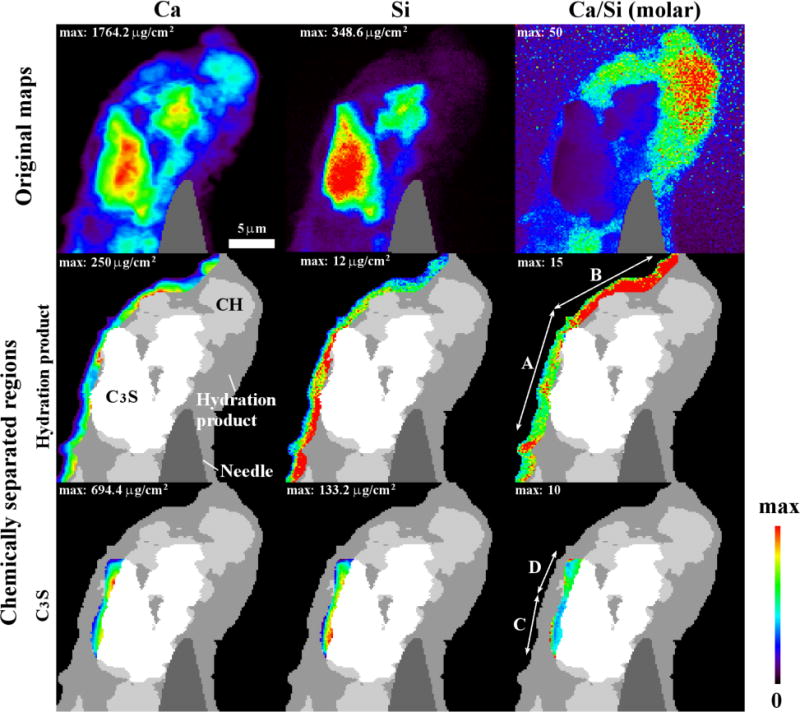
The elemental composition of sample 4C from nXRF analysis. The raw maps for Ca, Si and molar Ca to Si ratio are given in the first row. Quantitative analysis is given from a 1.6 μm thick band for hydration product and 3 μm for C3S as this material will have minimal X-ray absorption. Segmentation map is shown in the second and third rows. The bands were divided into regions A and B for hydration product and regions C and D for C3S.
Fig. 10.
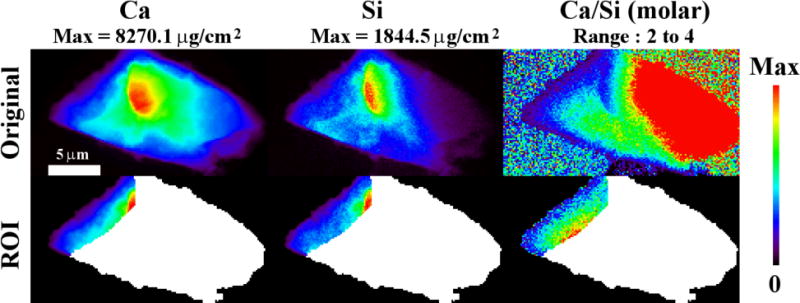
The nXRF results of an anhydrous C3S particle. A region of interest (ROI) is chosen within 3 μm of the left edge of the particle to avoid absorption artifacts. The means and standard deviations of Ca, Si and Ca/Si are given in Table 4.
Table 4.
Ca and Si concentrations and uncertainties expressed as a single standard deviation for hydration product and C3S in the chemically separated regions from nXRF.
| Elements | Hydration product | C3S | |||
|---|---|---|---|---|---|
| A | B | C | D | Standard | |
| Ca (μg/cm2) | 159.6±36.6 | 145.8±36.5 | 343.1±119.0 | 378.4±141.2 | 2296.3±1142.0 |
| Si (μg/cm2) | 14.1±4.4 | 7.1±2.0 | 80.6±33.9 | 71.4±25.8 | 529.4±252.0 |
| Ca/Si (molar) | 8.0±3.1 | 14.4±5.5 | 3.0± 1.8 | 3.7±1.9 | 3.0±0.4 |
| number of measurements | 549 | 613 | 161 | 172 | 1107 |
Regions within and near the surface of C3S were also investigated and are shown as regions A through D in the second and third rows of Fig. 9. These regions were chosen to minimize the artifacts from X-ray absorption of the materials. Region A is representative of hydration products found close to the particle surface and Region B is representative of hydration products found at least 1.6 μm from the C3S surface. The anhydrous C3S was investigated because this material is expected to have a predictable chemistry. Region C on particle 4C and the anhydrous C3S particle investigated in Fig. 10 have a Ca/Si of 3 as expected, but region D had higher amounts of calcium and lower amounts of silicon, indicating a Ca/Si of 3.71.
This higher Ca/Si in region D was not expected. However, a nXRF measurement is the average X-ray fluorescence from the material along the path of the beam. It is possible that hydration products containing Ca or Si had formed around region D and that the chemistry of these materials changed the nXRF measurement. To further investigate this, the sample was rotated by 90° and measured again. This showed that the anhydrous C3S in region D was surrounded by CH and region C was not. Images are included in the supplementary section. This supports the hypothesis and confirms that the measurement in region D was coming from both the underlying CH and the C3S particle. This highlights how interpretation of nXRF data can be challenging if the distribution of constituents is not known a priori.
Next, we analyzed the hydration product both within 1.6 μm of the C3S surface (region A) and further away (region B). The calcium concentrations were found to be similar; however, the mean silicon concentration of the hydration product within 1.6 μm is twice that of the hydration products found further away. The silicon concentration of region A is 14.1 ± 4.4 μg/cm2 compared to 7.1 ± 2.0 μg/cm2 in region B. These measurements reflect the average and standard deviation. This difference in chemistry contributes, along with any differences in porosity, to the variations in gray value of the hydration products shown in Fig. 8.
Since C-S-H is a nonstoichiometric solid with a variable Ca/Si, the C-S-H chemistry will depend on the chemical potentials of the calcium and silicate components in solution when the hydration product is formed. Silicate ions have a lower mobility in solution than calcium ions, which could contribute to the observed differences in composition as a function of distance from C3S. This difference in silicate chemistry over 1.6 μm away from the surface may define a critical diffusion length for silicon in this system.
The Ca/Si in both region A and B are greater than the values typically reported in the literature with SEM-EDS and C-S-H solid in solution [11,13,15,28–32,65,66]. These increased Ca/Si values are likely caused by contributions from both CH and C-S-H lying along the X-ray absorption length, similar to the mixture of CH and C3S observed in region D of the anhydrous C3S. It is also possible that the CH and C-S-H are intimately mixed, as suggested in past literature [9,17,30].
4.5 Comparison of nXRF with SEM EDS
To support the measurements from the nXRF, sample 4C was examined by SEM at the same orientation as was used for the nXRF measurements as shown in Fig 11. A sample of anhydrous C3S was also included. These experiments were done to give a comparison between nXRF and SEM-EDS. Results from the surface chemical analysis with standardless EDS are given in Table 5. The Ca/Si values for the C3S are near 3 as expected. Points measured in Region A of Fig. 9 show comparable Ca/Si to those from the same region measured by nXRF. The Ca/Si ratios in Region B are much higher than those in Region A. This matches and lends further support to the measurements made by nXRF in the same regions.
Fig. 11.
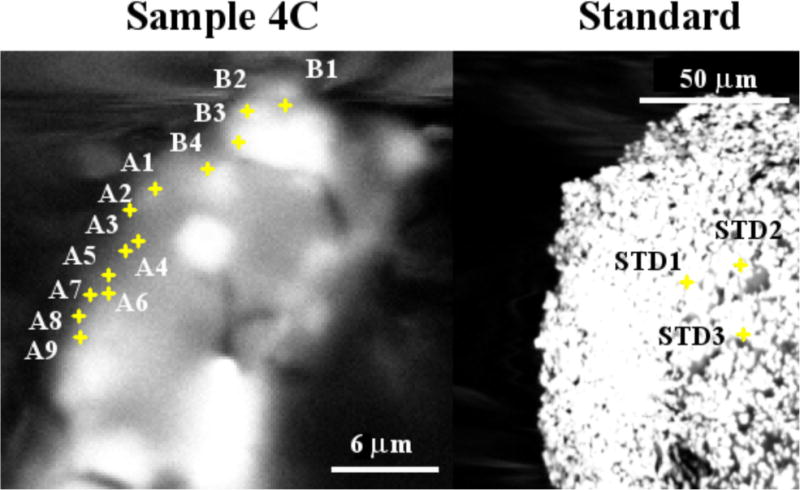
The backscattered electron images of sample 4C and standard sample. Points, A1 to A9 and B1 to B4 from the regions A and B in Fig. 9 respectively and Points, STD1 to STD3, from the standard sample as anhydrous triclinic C3S were investigated by EDS with the results given in Table 5.
Table 5.
The summary of elemental composition expressed as mass percent and uncertainties as a single standard deviation from EDS analysis of the points labeled in Fig. 11.
| Point # | Elements (mass %) | Ca/Si | ||||
|---|---|---|---|---|---|---|
| Ca | Si | O | Al | (molar) | ||
| Region A | 1A | 58 | 9 | 29 | 3 | 5 |
| 2A | 55 | 5 | 35 | 4 | 8 | |
| 3A | 55 | 5 | 35 | 3 | 7 | |
| 4A | 57 | 5 | 33 | 3 | 7 | |
| 5A | 57 | 7 | 32 | 3 | 6 | |
| 6A | 54 | 6 | 35 | 4 | 7 | |
| 7A | 58 | 8 | 31 | 3 | 5 | |
| 8A | 60 | 8 | 29 | 2 | 5 | |
| 9A | 60 | 8 | 29 | 2 | 5 | |
| Ave ± std | 57±2 | 7±2 | 32±3 | 3±0.5 | 6±1 | |
|
| ||||||
| Region B | 1B | 79 | 1 | 19 | 0 | 51 |
| 2B | 69 | 1 | 28 | 1 | 43 | |
| 3B | 68 | 0 | 29 | 2 | Inf | |
| 4B | 57 | 3 | 34 | 5 | 13 | |
| Ave ± std | 68±9 | 1±1 | 27±6 | 2±2 | >36±22 | |
|
| ||||||
| C3S | STD1 | 62 | 14 | 24 | 0 | 3 |
| STD2 | 63 | 14 | 23 | 0 | 3 | |
| STD3 | 65 | 15 | 20 | 0 | 3 | |
| Ave ± std | 63±2 | 14±0.4 | 22±2 | 0 | 3 | |
Some differences in the measured SEM EDS from expected values may reflect the combined effects of the standardless EDS analysis and using surface measurements instead of flat polished samples. More refined measurements were not made because the sample was too delicate for additional sample preparation and the goal was to show a comparison between nXRF and SEM-EDS.
4.6 The evolution and nature of the observed hydration product
These experiments show that neither C3S dissolution nor hydration product growth occurs uniformly over the particle surfaces by the end of the slow reaction period. Enhanced growth of hydration products was observed between closely spaced C3S particles during the beginning of the acceleration period. Hydration product was found to bridge particles that were as far as 2 μm apart. This localized formation of hydration products may be caused by higher concentrations of ions found near the surfaces of these closely spaced particles. Hydration products also seem to preferentially form on certain regions of the particles. This may be caused by increased surface area, mechanical damage from grinding, or other crystalline defects. This is an area of future research. As the acceleration period continues, the hydration products found within 1 μm to 1.6 μm seem to have a higher X-ray absorption and contain higher amounts of silicon compared to the hydration products found further from the surface of the anhydrous C3S.
5. Summary
This paper highlights the utility of using nCT and nXRF to measure the 3D structure and chemistry of the early hydration of C3S at 15 nm and 150 nm length scales. The hydration of triclinic C3S particles in 15 mmol/L lime solution at w/s = 5 was examined as a function of time and temperature. The volumetric growth and variation of X-ray absorption and chemistry has been measured and will serve as a useful bench mark for future experiments and simulations.
The following observations were made for hydration at 25 °C:
At the beginning of the acceleration period, some C3S particles that were approximately 4 μm in diameter showed significant changes, while other particles of smaller size show only limited changes.
Hydration product was observed to form between particles that were about 2 μm apart but not in other parts of the sample.
For samples near the middle of the acceleration period, the volume of hydration products was over 4 times the original volume of the particles within the field of view. This is likely caused by the dissolution of other particles that were not observed.
The hydration products within about 1 μm of the anhydrous C3S surface had a higher X-ray absorption.
During this same time period the hydration products within 1.6 μm of the anhydrous C3S had twice the Si concentration as hydration products found further from this region.
The following observations were made for hydration at 50 °C:
Solvent exchange using isopropyl alcohol showed minimal disruption of the microstructure for a sample hydrated for 2.5 h.
Samples that were stored at 50 °C showed more rapid reaction and a higher volume of hydration than those at 25 °C.
Additional work is underway to investigate other solutions and materials. Improvements are also being made to the measuring techniques to gain even greater insight into the hydration mechanisms.
Supplementary Material
Acknowledgments
This work was sponsored by funding from Federal Highway Administration (FHWA) Exploratory Advanced Research (EAR) program and funding from the United State National Science Foundation CMMI 1150404 CAREER Award. We thank our collaborators, George Scherer (Princeton University), Brad Chmelka (University of California, Santa Barbara), Andreas Lüttge and Rolf Arvidson (University of Bremen), Denise Silva and Josephine Cheung (W.R. Grace) and Larry Robert (Roberts Consulting), for their insightful advice on this work. The XRD and ICP-OES measurements were made at W.R. Grace by Jeffrey Nicolich.
Use of the Center for Nanoscale Materials and the Advanced Photon Source were supported by the U. S. Department of Energy, Office of Science, Office of Basic Energy Sciences, under Contract No. DE-AC02-06CH11357.
Footnotes
Publisher's Disclaimer: This is a PDF file of an unedited manuscript that has been accepted for publication. As a service to our customers we are providing this early version of the manuscript. The manuscript will undergo copyediting, typesetting, and review of the resulting proof before it is published in its final citable form. Please note that during the production process errors may be discovered which could affect the content, and all legal disclaimers that apply to the journal pertain.
Conventional cement chemistry notation is used throughout this paper: C = CaO, S = SiO2, H = H2O.
Certain commercial equipment, instruments, or materials are identified in this report in order to specify the experimental procedure adequately. Such identification is not intended to imply recommendation or endorsement by the National Institute of Standards and Technology, nor is it intended to imply that the materials or equipment identified are necessarily the best available for the purpose.
References
- 1.Bullard JW, Jennings HM, Livingston RA, Nonat A, Scherer GW, Schweitzer JS, Scrivener KL, Thomas JJ. Mechanisms of cement hydration. Cem Concr Res. 2011;41:1208–1223. [Google Scholar]
- 2.Scrivener KL, Juilland P, Monteiro JM. Advances in understanding hydration of Portland cement. Cem Con Rese. 2015;78:38–56. [Google Scholar]
- 3.Scherer GW, Zhang J, Thomas JJ. Nucleation and growth models for hydration of cement. Cem Concr Res. 2012;42:982–993. [Google Scholar]
- 4.Bullard JW. A determination of hydration mechanisms for tricalcium silicate using a kinetic cellular automation model. J Am Ceram Soc. 2008;91:2088–2097. [Google Scholar]
- 5.Biernacki JJ, Xie T. An advanced single particle model for C3S and alite hydration. J Am Ceram Soc. 2011;94:2037–2047. [Google Scholar]
- 6.Bullard JW, Scherer GW, Thomas JJ. Time dependent driving forces and the kinetics of tricalcium silicate hydration. Cem Concr Res. 2015;74:26–34. [Google Scholar]
- 7.Nicoleau L, Bertolim MA. Analytical model for the alite (C3S) dissolution topography. J Am Ceram Soc. 2015:1–14. [Google Scholar]
- 8.Scrivener KL, Nonat A. Hydration of cementitious materials, present and future. Cem Concr Res. 2011;41:651–665. [Google Scholar]
- 9.Thomas JJ, Biernacki JJ, Bullard JW, Bishnoi S, Dolado JS, Scherer GW, Luttge A. Modeling and simulation of cement hydration kinetics and microstructure development. Cem Concr Res. 2011;41:1257–1278. [Google Scholar]
- 10.Peled A, Castro J, Weiss WJ. Atomic force and lateral force microscopy (AFM and LFM) examination of cement and cement hydration products. Cem Concr Compos. 2013;36:48. [Google Scholar]
- 11.Garrault S, Finot E, Lesniewska E, Nonat A. Study of C-S-H growth on C3S surface during its early hydration. Mater Struct. 2005;38:435–442. [Google Scholar]
- 12.Goto S, Daimon M, Hosaka G, Kondo R. Composition and morphology of hydrated tricalcium silicate. J Am Ceram Soc. 1976;59:281–284. [Google Scholar]
- 13.Richardson IG. The nature of C-S-H in hardened cements. Cem Concr Res. 1999;29:1131–1147. [Google Scholar]
- 14.Tennis PD, Jennings HM. A model for two types of calcium silicate hydrate in the microstructure of Portland cement pastes. Cem Concr Res. 2000;30:855–863. [Google Scholar]
- 15.Jennings HM. A model for the microstructure of calcium silicate hydrate in cement paste. Cem Concr Res. 2000;30:101–106. [Google Scholar]
- 16.Constantinides G, Ulm F. The effect of two types of C-S-H on the elasticity of cement-based materials: Results from nanoindentation and micromechanical modeling. Cem Concr Res. 2004;34:67–80. [Google Scholar]
- 17.Vandamme M, Ulm F, Fonollosa P. Nanogranular packing of C-S-H at substochiometric conditions. Cem Concr Res. 2010;40:14–26. [Google Scholar]
- 18.Juilland P, Gallucci E, Flatt R, Scrivener KL. Dissolution theory applied to the induction period in alite hydration. Cem Concr Res. 2010;40:831–844. [Google Scholar]
- 19.Bazzoni A, Cantoni M, Scrivener KL. Impact of annealing on the early hydration of tricalcium silicate. J Am Ceram Soc. 2014;97:584–591. [Google Scholar]
- 20.Chen JJ, Sorelli L, Vandamme M, Ulm F, Chanvillard G. A coupled Nanoindentation/SEM-EDS study on low water/cement ratio Portland cement paste: evidence for C-S-H/Ca(OH)2 nanocomposites. J Am Ceram Soc. 2010;93:1484–1493. [Google Scholar]
- 21.Daimon M, Ueda S, Kondo R. Morphological study on hydration of tricalcium silicate. Cem Concr Res. 1971;1:391–401. [Google Scholar]
- 22.Richardson IG. The calcium silicate hydrates. Cem Concr Res. 2008;38:137–158. [Google Scholar]
- 23.Richardson IG. Tobermorite/jennite-and tobermorite/calcium hydroxide-based models for the structure of C-S-H: applicability to hardened pastes of tricalcium silicate, B-dicalcium siliate, Portland cement and blends of Portland cement with blast-furnace slage, metakaolin, or silica fume. Cem Concr Res. 2004;34:1733–1777. [Google Scholar]
- 24.Diamond S. Cement paste microstructure—an overview at several levels, in: Hydraulic cement pastes: Their structure and properties; Proceedings of a conference held at the University of Sheffield; 8–9th April 1976. Slough: Cement and Concrete Association; 1976. pp. 2–30. [Google Scholar]
- 25.Gallucci E, Mathur P, Scrivener KL. Microstructural development of early age hydration shells around cement grains. Cem Concr Res. 2010;40:4–13. [Google Scholar]
- 26.Menetrier D, Jawed J, Sun TS, Skalny J. ESCA and SEM studies on early C3S hydration. Cem Concr Res. 1979;9:473–482. [Google Scholar]
- 27.Kumar A, Reed J, Sant G. Vertical scanning interferometry: a new method to measure the dissolution dynamics of cementitious minerals. J Am Ceram Soc. 2013;96:2766–2778. [Google Scholar]
- 28.Barret P, Bertrandie D. Fundamental hydration features of the major cement constituents: Ca3SiO5 and bCa2SiO4, Journal de Chimie. Physique. 1986;83:765–775. [Google Scholar]
- 29.Greenberg SA, Chang TN. Investigation of the colloidal hydrated calcium silicates. II. Solubility relationships in the calcium oxide-silica-water system at 25°. J Phys Chem. 1965;69:182–188. [Google Scholar]
- 30.Taylor HFW. Hydrated calcium silicates. Part I. Compound formation at ordinary temperature. J Chem Soc. 1950:3682–3690. [Google Scholar]
- 31.Flint EP, Wells LS. Study of the system CaO-SiO2-H2O at 30 C and of the reaction of water on the anhydrous calcium silicates. J Res Natl Bur Stand. 1934;12:751–783. [Google Scholar]
- 32.Taylor HFW. Cement chemistry. Second. Thomas Telford; London: 1997. [Google Scholar]
- 33.Taylor HFW, Newbury DE. Calcium hydroxide distribution and calcium silicate hydrate composition in tricalcium silicate and b-dicalcium silicate pastes. Cem Concr Res. 1984;14:93–98. [Google Scholar]
- 34.Juilland P, Gallucci E. Morpho-topological investigation of the mechanisms and kinetic regions of alite dissolution. Cem Concr Res. 2015;76:180–191. [Google Scholar]
- 35.Juenger MCG, Monteiro PJM, Gartner EM, Denbeaux GP. A soft X-ray microscope investigation into the effects of calcium chloride on tricalcium silicate hydration. Cem Concr Res. 2005;35:19–25. [Google Scholar]
- 36.Silva DA, Monteiro PJM. The influence of polymers on the hydration of Portland cement phases analyzed by soft X-ray transmission microscopy. Cem Concr Res. 2006;36:1501–1507. [Google Scholar]
- 37.Provis JL, Rose V, Winarski RP, van Deventer JSJ. Hard X-ray nanotomography of amorphous aluminosilicate cements. Scripta Mater. 2011;65:316–319. [Google Scholar]
- 38.Hu Q, Aboustait M, Ley MT, Hanan JC, Rose V, Winarski RP. Combined three-dimensional structural and chemistry imaging with nanoscale resolution. Acta Mater. 2014;77:173–182. [Google Scholar]
- 39.Wang J, Chen-Wiegart YK, Wang J. In situ three-dimensional synchrotron X-ray nanotomography of the (De)lithiation processes in tin anodes. Angew Chem Int Ed. 2004;53:4460–4464. doi: 10.1002/anie.201310402. [DOI] [PubMed] [Google Scholar]
- 40.Bernal SA, Provis JL, Rose V, de Gutierrez R Mejia. High-resolution X-ray diffraction and fluorescence microscopy characterization of alkali-activated slag-metakaolin binders. J Am Ceram Soc. 2013;96:1951–1957. [Google Scholar]
- 41.Chae SR, Moon J, Yoon S, Bae S, Levitz P, Winarski R, Monteiro PJM. Advanced nanoscale characterization of cement based materials using X-ray synchrotron radiation: a review. Int j Concr Struct Mater. 2013;7:95–110. [Google Scholar]
- 42.Holt M, Harder R, Winarski R, Rose V. Nanoscale hard X-ray microscopy method for materials studies. Ann Rev Mater Res. 2013;43:183–211. [Google Scholar]
- 43.Chen Y, Geddes JB, III, Yin L, Wiltzius P, Braun PV. X-ray computed tomography of holographically fabricated three-dimensional photonic crystals. Adv Mater. 2012;24:2863–2868. doi: 10.1002/adma.201200411. [DOI] [PubMed] [Google Scholar]
- 44.Kak AC, Slaney M. Principal of Computerized Tomographic Imaging, Society of Industrial and Applied Mathematics. Philadelphia. 2001 [Google Scholar]
- 45.Kalender WA. Computed Tomography: Fundamentals, System Technology, Image quality, Applications. Third. Publicis Publishing; Erlangen: 2011. [Google Scholar]
- 46.Hu Q, Ley MT, Davis J, Hanan JC, Frazier R, Zhang Y. 3D chemical segmentation of fly ash particles with X-ray computed tomography and electron probe microanalysis. Fuel. 2014;116:229–236. [Google Scholar]
- 47.Gallucci E, Scrivener K, Groso A, Stampanoni M, Margaritondo G. 3D experimental investigation of the microstructure of cement pastes using synchrotron X-ray microtomography (μCT) Cem Concr Res. 2007;37:360–368. [Google Scholar]
- 48.Trtik P, Diaz A, Guizar-Sicairos M, Menzel A, Bunk O. Density mapping of hardened cement paste using ptychographic X-ray computed tomography. Cem Concr Compos. 2013;36:71–77. [Google Scholar]
- 49.Cloetens P, Pateyron-Salomé M, Buffiere JY, Peix G, Baruchel J, Peyrin F, Schlenker M. Observation of microstructure and damage in materials by phase sensitive radiography and tomography. J Appl Phys. 1997;81:5878–5886. [Google Scholar]
- 50.Gureyev TE, Mayo SC, Myers DE, Nesterets Y, Paganin DM, Pogany A, Stevenson AW, Wilkins SW. Refracting Röntgen’s rays: Propagation-based x-ray phase contrast for biomedical imaging. J Appl Phys. 2009;105:102005. [Google Scholar]
- 51.Provis JL, Rose V, Bernal SA, van Deventer JS. High-resolution nanoprobe X-ray fluorescence characterization of heterogeneous calcium and heavy metal distribution in alkali-activated fly ash. Langmuir. 2009;25:11897–11904. doi: 10.1021/la901560h. [DOI] [PubMed] [Google Scholar]
- 52.Damidot D, Nonat A, Barrel P. Kinetics of tricalcium silicate hydration in diluted suspensions by microcalorimetric measurements. J Am Ceram Soc. 1990;73:3319–3322. [Google Scholar]
- 53.de Jong JGM, Stein HN, Stevels JM. Hydration of tricalcium silicate. J Appl Chem. 1967;17:246–250. [Google Scholar]
- 54.Zhang J, Scherer GW. Comparison of methods for arresting hydration of cement. Cem Concr Res. 2011;41:1024–1036. [Google Scholar]
- 55.Snoeck D, Velasco LF, Mignon A, Van Vlierberghe S, Dubruel P, Lodewyckx P, De Belie N. The influence of different drying techniques on the water sorption properties of cement-based materials. Cem Concr Res. 2014;64:54–62. [Google Scholar]
- 56.Hughes DC, Crossley NL. Pore structure characterization of GGBS/OPC grouts using solvent techniques. Cem Concr Res. 1994;24:1255–1266. [Google Scholar]
- 57.Beaudoin JJ. Validity of using methanol for studying the microstructure of cement paste. Mater Struct. 1987;20:27–31. [Google Scholar]
- 58.Beaudoin JJ, Gu P, Marchand J, Tamtsia B, Myers RE, Liu Z. Solvent replacement studies of hydrated Portland cement systems: the role of calcium hydroxide. Adv Cem Based Mater. 1998;56:56–65. [Google Scholar]
- 59.Winarski RP, Holt MV, Rose V, Fuesz P, Carbaugh D, Benson C, Shu D, Kline D, Stephenson GB, McNulty I, Maser J. A hard X-ray nanoprobe beamline for nanoscale microscopy. J Synchrotron Rad. 2012;19:1056–1060. doi: 10.1107/S0909049512036783. [DOI] [PMC free article] [PubMed] [Google Scholar]
- 60.Hubbell J. Photon Mass Attenuation and Energy-Absorption Coefficients from 1 keV to 20 MeV. Int J Appl Radiat Isot. 1982;33:1269–1290. [Google Scholar]
- 61.Liu Y, Meirer F, Williams PA, Wang J, Andrews JC, Pianetta P. TXM-Wizard: a program for advanced data collection and evaluation in full-field transmission X-ray microscopy. J Synchrotron Rad. 2012;19:281–287. doi: 10.1107/S0909049511049144. [DOI] [PMC free article] [PubMed] [Google Scholar]
- 62.Vogt S. MAPS: A set of software tools for analysis and visualization of 3D X-ray fluorescence data sets. J Phys IV France. 2003;104:635–638. [Google Scholar]
- 63.Henke BL, Gullikson EM, Davis JC. X-ray interactions: photoabsorption, scattering, transmission, and reflection at E=50-30000 eV, Z=1-92. Atomic Data and Nuclear Data Tables. 1993;54:181–342. [Google Scholar]
- 64.Thomas JJ, Jennings HM, Allen AJ. The surface area of cement paste as measured by neutron scattering: evidence for two C-S-H morphologies. Cem Concr Res. 1998;28:897–905. [Google Scholar]
- 65.Garrault-Gauffinet S, Nonat A. Experimental investigation of calcium silicate hydrate (C-S-H) nucleation. J Crystal Growth. 1999;200:565–574. [Google Scholar]
- 66.Gartner EM, Jennings HM. Thermodynamics of calcium silicate hydrates and their solution. J Am Ceram Soc. 1987;80:743–749. [Google Scholar]
Associated Data
This section collects any data citations, data availability statements, or supplementary materials included in this article.


