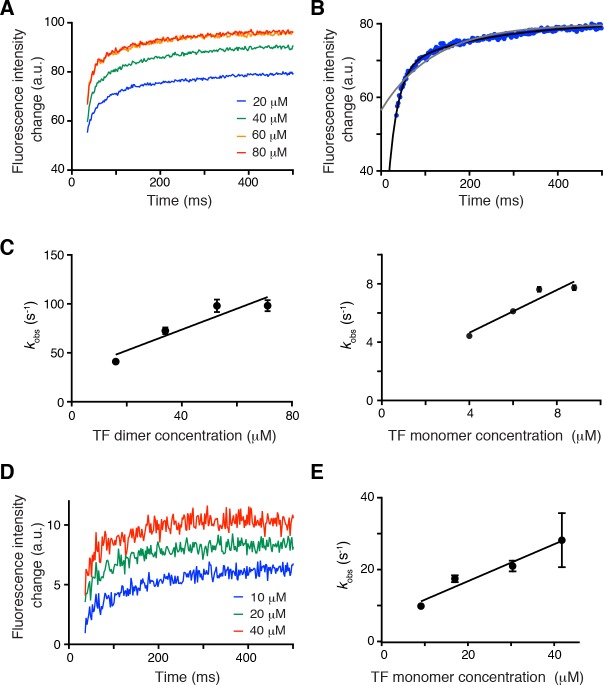
Figure 5. Effect of TF dimerization on binding kinetics.
(A) Association of unfolded PhoA with TF monitored by tryptophan fluorescence. (B) Fitting of the data for the association of PhoA with TF by a single exponential function (gray line) or the sum of two exponential functions (black line), indicating that two exponential functions are required to fit the data. (C) Plots of the observed rate constant (kobs) as a function of the concentration of the dimer (left) and the monomer (right) of TF. (D) Association of PhoA with TFmon monitored by tryptophan fluorescence. (E) Plot of the observed rate constant (kobs) as a function of the concentration of monomeric TF.


