

Abstract
Introduction
Disrupted topological organization of brain functional networks has been widely observed in posttraumatic stress disorder (PTSD). However, the topological organization of the brain grey matter (GM) network has not yet been investigated in pediatric PTSD who was more vulnerable to develop PTSD when exposed to stress.
Materials and methods
Twenty two pediatric PTSD patients and 22 matched trauma-exposed controls who survived a massive earthquake (8.0 magnitude on Richter scale) in Sichuan Province of western China in 2008 underwent structural brain imaging with MRI 8–15 months after the earthquake. Brain networks were constructed based on the morphological similarity of GM across regions, and analyzed using graph theory approaches. Nonparametric permutation testing was performed to assess group differences in each topological metric.
Results
Compared with controls, brain networks of PTSD patients were characterized by decreased characteristic path length (P = 0.0060) and increased clustering coefficient (P = 0.0227), global efficiency (P = 0.0085) and local efficiency (P = 0.0024). Locally, patients with PTSD exhibited increased centrality in nodes of the default-mode (DMN), central executive (CEN) and salience networks (SN), involving medial prefrontal (mPFC), parietal, anterior cingulate (ACC), occipital and olfactory cortex and hippocampus.
Conclusions
Our analyses of topological brain networks in children with PTSD indicate a significantly more segregated and integrated organization. The associations and disassociations between these grey matter findings and white matter (WM) and functional changes previously reported in this sample may be important for diagnostic purposes and understanding the brain maturational effects of pediatric PTSD.
Keywords: Pediatric PTSD, Topological organization, Graph theory, Brain network, MRI, Psychoradiology
Highlights
-
•
Brain networks of children with PTSD were psychoradiologically characterized by more segregated and integrated organization.
-
•
Locally, pediatric PTSD patients exhibited increased centrality in nodes of three core neocortical networks.
-
•
There are associations and disassociations among multimodal MRI findings in the same population of pediatric PTSD.
-
•
Increased local efficiency relative to controls was greater in 13-16 year old than 10-12 year old PTSD patients.
1. Introduction
Post-traumatic stress disorder (PTSD) can develop following exposure to extremely traumatic life events such as violence, combat, life-threatening accidents or natural disasters. PTSD is the only psychiatric disorder with known cause, and is characterized by a constellation of symptoms including re-experience, avoidance, and hyperarousal (Association, A.P., 2013). Its lifetime prevalence is 6.8% of general adult populations (Kessler et al., 2005) and 5% in adolescents (Merikangas et al., 2010), and it occurs in 24% of individuals after particularly serious stressors such as occur in earthquake survivors (Dai et al., 2016). The comorbidities of PTSD can include substance abuse, mood and anxiety disorders, impulsive or dangerous behavior and self-harm. PTSD is also associated with considerable medical comorbidities, including chronic pain and inflammation, cardiometabolic disorders and heightened risk of dementia. In children, the functional disability of PTSD can persist for years into adulthood, with long-term influence on social and brain development (Lamberg, 2001).
Both functional and structural brain alterations in PTSD have been reported (Chen et al., 2013; Li et al., 2016; Lui et al., 2009; Cisler et al., 2016a), but their neurobiology and pathogenesis remain unclear (Liberzon and Abelson, 2016). In recent years, studying the brain connectome using graph theory approaches has emerged as an important strategy for detecting alterations of brain networks in neuropsychiatric disorders (Sporns et al., 2005). The primate brain has been shown to be topologically organized in a small-world network which has higher segregation and integration functions than a random and regular network (He et al., 2007; Salvador et al., 2005; Stam, 2004). Disruption of this topological organization has been associated with epilepsy (Bernhardt et al., 2016; Bernhardt et al., 2015; Sethi et al., 2016), Alzheimer's disease (He et al., 2008; Stam et al., 2009; Tijms et al., 2013a), schizophrenia (Alexander-Bloch et al., 2013a; Li et al., 2012; van den Heuvel et al., 2010), and major depression (Zhang et al., 2011; Wang et al., 2016; Guo et al., 2012). Compared with healthy and trauma-exposed populations, patients with PTSD exhibited altered brain network organizations in previous resting state fMRI studies (Spielberg et al., 2015; Kennis et al., 2016; Cisler et al., 2016b). Our study of adult PTSD patients showed that functional networks demonstrated a shift toward “small-worldization” indicated by higher both segregation and integration (Lei et al., 2015a). A previous study of PTSD using diffusion-tensor imaging (DTI) showed that WM networks shifts toward “randomization” of network organization with only higher integration (Long et al., 2013).
Compared to studies of resting state fMRI and diffusion tensor imaging, there are few studies using grey matter to examine brain structural networks in patients with PTSD. As with fMRI and DTI data, grey matter structural MRI can also be used to delineate whole-brain connectivity patterns by calculating interregional morphological associations (He et al., 2007; Alexander-Bloch et al., 2013b) based on the structural covariance of grey matter volume and cortical thickness. This approach has been used to examine connectome organization in healthy individuals (He et al., 2007, Fan et al., 2011; Chen et al., 2008) and in patients with psychiatric disorders (He et al., 2008; Bassett et al., 2008; Singh et al., 2013). Only two studies have investigated GM network organizations of PTSD, both with adult participants. These studies demonstrated a loss of small world organization and characteristics of higher segregation and integration with a shorter path length and higher clustering (Mueller et al., 2015; Qi et al., 2017).
A new method proposed by Tijms and colleagues has been developed to statistically describe grey matter networks in individual subjects using T1-weighted MRI scans (Tijms et al., 2012). In this method, networks are constructed with nodes representing small brain regions whose connections are computed by evaluating intracortical similarities in grey matter morphology. This method has been successfully applied to study Alzheimer's disease (Tijms et al., 2013a; Tijms et al., 2016; Tijms et al., 2013b; Tijms et al., 2014) and individuals at risk for schizophrenia (Tijms et al., 2015). Batalle and colleagues (Batalle et al., 2013) extended this method to allow normalization of grey matter networks so that each person has the same network size (90 nodes). This method has advantages for comparative analyses such as in patient-control comparisons. No studies have applied this approach in PTSD.
Children are thought to be more vulnerable to developing PTSD following trauma than adults (Fletcher, 1996). To our knowledge, only two studies from our group investigated brain topological organization in pediatric PTSD. These studies demonstrated disruption of brain functional and WM networks using resting-state MRI (rs-MRI) and diffusion-tensor imaging (DTI) (Suo et al., 2017; Suo et al., 2015). The segregation function was increased in functional networks and decreased in WM networks, while the integration function of WM networks was decreased. Whether there are changes in the GM networks in children with PTSD and how such alterations may related to symptom severity and these previous findings using other imaging modalities is unknown.
The purpose of this study was to investigate the topological organization of brain GM networks in children who experienced a single traumatic event. We recruited 22 children with PTSD and 22 trauma-exposed healthy control subjects followed 1 year after the 8.0 magnitude Wenchuan earthquake in south-west China. After constructing individual morphological cortical networks, graph-based models were employed to characterize grey matter topology for each study participant. Given previous evidence of higher segregation function in resting-state fMRI networks and lower integration function of WM networks in pediatric PTSD, we hypothesized that (i) similar disruptions would also characterize the present grey matter networks in our pediatric sample. We also hypothesized (ii) lower nodal betweeness, degree and efficiency in our grey matter networks based on previous findings of two adult PTSD studies of grey matter networks (Mueller et al., 2015, Qi et al., 2017). Finally, (iii) we predicted relationships of network disruption with clinical severity and age.
2. Materials and methods
2.1. Participants
The participants who survived a massive earthquake (8.0 magnitude on Richter scale) in Sichuan Province of western China in 2008 were recruited in the town of Hanwang and nearby areas of Beichuan County, which are about 80 km and 113 km from the epicenter respectively. This study was approved by the local research ethics committee. Each child's guardian provided written informed consent and children provided assent prior to participation.
A large-scale PTSD survey was conducted by Y.C., S.L and X.H. among 4200 survivors 8–15 months after the earthquake. From that sample we selected participants who (i) physically experienced the earthquake, (ii) personally witnessed death, serious injury or the collapse of buildings, (iii)had no diagnosis of PTSD prior to the earthquake, (iv) were younger than 18 years of age, and (v) had an intelligence quotient >80.
The parent form of the PTSD Checklist (PCL) was used to screen potential subjects (Weathers et al., 1994) and the Clinician Administered PTSD Scale (CAPS) was completed when PCL scores were ≥35 (Blake et al., 1995). The subjects were considered eligible for inclusion in the PTSD group who had a CAPS score of 50 points or greater. Those with PCL scores < 30 were considered study eligible as non-PTSD controls who also experienced the stress of the earthquake (Jin et al., 2014). This yielded a total of 161 potential PTSD patients and 99 non-PTSD controls. In these subjects, the presence/absence of PTSD and psychiatric comorbidities were confirmed by an experienced psychiatrist (L.L.) using the Structured Clinical Interview for DSM-IV (SCID; Diagnostic and Statistical Manual of Mental Disorders, Fourth Edition (First et al., 1997)). Both the children and their parents were interviewed and the information from parents was combined by the psychiatrist to support diagnosis.
Exclusion criteria were: (i) history of depression, bipolar or psychotic disorder, or neurologic disorder (n = 42), (ii) contraindication to MR imaging (n = 30), (iii) treatment with psychiatric medications within two months before recruitment for MRI scanning (n = 24), (iv) unavailability of key data (n = 12); (v) left handedness (n = 10); (vi) CAPS score >35 but <50 (n = 8) (Jin et al., 2014), and (vii) history of brain injury (n = 7). Six patients and 4 controls were excluded because of excessive head motion during 3D T1 MRI scanning.
With these exclusions to obtain a relatively homogeneous sample, we recruited 22 drug-free first-episode patients with PTSD and a demographically matched group of 22 trauma exposed subjects who did not develop PTSD for the present study. The two groups had similar demographic characteristics, lifestyles, and earthquake experiences (Table 1). Selecting healthy individuals who also experienced the earthquake as a comparison group was done to control for stress exposure. Thus, our study was designed to identify factors associated with PTSD independent of stress exposure effects.
Table 1.
Demographic data and clinical characteristics of study participantsa.
| PTSD | Non-PTSD | P value | |
|---|---|---|---|
| Sample size | 22 | 22 | NA |
| Age (years)b | 13.32 ± 1.73 | 13.00 ± 1.45 | 0.325c |
| Gender (M/F) | 7/15 | 9/13 | 0.531d |
| Handedness (R/L) | 22/0 | 22/0 | NA |
| Years of educationb | 8.27 ± 1.83 | 8.00 ± 2.20 | 0.307c |
| Time since trauma (months)b | 12.64 ± 1.56 | 13.23 ± 1.45 | 0.194c |
| GM volume (cm3) | 817.35 ± 60.77 | 823.08 ± 59.51 | 0.746 c |
| PCL score | 56.00 ± 3.92 | 23.27 ± 1.86 | NA |
| CAPS score | 66.05 ± 6.48 | NA | NA |
Abbreviation: PTSD, posttraumatic stress disorder; PCL, PTSD checklist; CAPS, Clinician-administered PTSD scale.
Data are presented as means ± standard deviations. No significant differences were identified between the pediatric PTSD and the trauma controls in age, gender, years of education, time since trauma and GM volume.
Age, years of education and time since trauma were defined at the time of MRI scanning.
P value was obtained by two-tailed two-sample t test, P < 0.05.
P value was obtained by two-tailed Pearson χ2 test, P < 0.05.
2.2. Data acquisition and preprocessing
Participants underwent T1 structural imaging with a 3.0-T MR imaging system (Excite; GE Healthcare, Milwaukee, Wis) using an eight-channel phased-array head coil. The head was stabilized with cushions and ear plugs. Images were acquired using a spoiled gradient recalled sequence with repetition time (TR) = 8.5 ms, echo time (TE) = 3.4 ms, flip angle (FA) = 12°, 156 axial slices with slice thickness = 1 mm, field of view (FOV) = 24 × 24 cm2 and data matrix = 256 × 256.
Structural images were preprocessed using Statistical Parametric Mapping (SPM) software (http://www.fil.ion.ucl.ac.uk/spm/software/SPM8/). Briefly, individual structural images were first segmented into GM, WM and cerebrospinal fluid (CSF) using the unified segmentation model (Ashburner and Friston, 2005). We visually confirmed all automatic segmentations. Then, images were spatially normalized to Montreal Neurological Institute (MNI) coordinate space. Considering the difference of brain features between adults and children, the default tissue probability maps of SPM were replaced by a specific template created using all 44 participants in our study. Finally, the grey matter data were resampled to 2 mm3 voxels and spatially smoothed (Gaussian kernel with a full width at half maximum of 6 mm).
2.3. Extraction of brain networks
First, single-subject grey matter networks were obtained based on intracortical similarity using a completely automated and data-driven method that has been previously described (Tijms et al., 2012). Briefly, the method started with defining the network's nodes as small regions of interest corresponding to 3 × 3 × 3 voxel cubes of grey matter. These cubes kept the 3D structure of the cortex intact, thereby using spatial information from the MRI scan in addition to the grey matter values of voxels in the cubes. Compared with cortical volume and cortical thickness measures, the cubes contained both the local thickness measures and information about the folding structure of cortex. Then the structural similarity between 2 cubes was quantified by a correlation coefficient. As two similar cubes could be located at an angle from each other, their similarity value could decrease. Therefore, the maximum correlation value over different rotations of the seed cube was identified to estimate cube similarity. Next, unweighted and undirected graphs were constructed by binarizing the previous similarity matrices, after determining a threshold for each individual graph with a permutation based method to ensure a similar chance of identifying 5% (SD = 0.002) spurious correlations for all individuals (Weese et al., 1999). Only positive similarity values survived this threshold in the present study.
Similarity based grey matter networks defined in this way have different sizes. As network properties can vary with network size (van Wijk et al., 2010), it is critical to normalize the grey matter networks to have the same number of nodes and node size across participants. To achieve this, we followed the methodology proposed by Batalle et al. (Batalle et al., 2013) to normalize single subject grey matter networks based on the unified Automated Anatomical Labeling (AAL) parcellation template available in SPM software corresponding to the 90 nodes of the AAL atlas.
To perform the normalization, a node of the AAL was defined as the AAL region to which most voxels of each cube belonged. Each pair of nodes was considered to be connected with a weight corresponding to the ratio of actual significant correlations divided by the total possible connections between nodes. The weight obtained is bounded between 0 and 1. Self-connections were excluded. This procedure resulted in a 90 × 90 weighted normalized network for each subject. Note that in the present study, we use the term “connection” to refer to brain network edges indicating statistically similar grey matter morphology of two cubes, which can exist in the absence of axonal connectivity.
2.4. Network properties
GRETNA (www.nitrc.org/projects/gretna/) in Matlab was used to calculate network properties as in previous brain network studies (Wang et al., 2015). A wide range of sparsity (S) thresholds was applied to all the correlation matrices. The upper and lower limit of S values used was determined ensuring that the thresholded networks were estimable for the small-worldness scalar and that the small-world index was larger than 1.0. With these limits, our threshold range was 0.10 < S < 0.34 with an interval of 0.01. The area under the curve (AUC) reflecting measures across the sparsity parameter S was calculated for each network metric, providing a summarized scalar for the topological characterization of brain networks to avoid using an arbitrary single threshold selection. This approach has been shown to be sensitive for detecting topological alterations of brain networks (Zhang et al., 2011; Achard and Bullmore, 2007; He et al., 2009).
Both global and nodal network properties were calculated at each sparsity threshold. Several global metrics were examined in the present study. Small-world parameters (Watts and Strogatz, 1998) included the clustering coefficient Cp, characteristic path length Lp, normalized clustering coefficient γ, normalized characteristic path length λ, and small worldness σ. Normalization was achieved by comparison with a matched random network generated by rearranging the edges while keeping the degree distribution intact (Maslov and Sneppen, 2002). Network efficiency parameters (Achard and Bullmore, 2007) included local efficiency Eloc and global efficiency Eglob. The following three nodal centrality metrics were examined: the nodal degree, efficiency, and betweenness centrality.
2.5. Statistical analysis
Nonparametric permutation testing was performed to assess group differences in the AUC of each metric (small-world, network efficiency, and nodal centrality measures). Briefly, between-group differences were first calculated using the mean of each network metric across S values. To correct for multiple comparisons, all of the values were randomly reallocated into two groups and mean differences were recalculated between the two randomized groups for each network metric. This randomization procedure was repeated 10,000 times, and the 95th percentiles of each distribution were used as the critical values for significance testing. The nodal centralities were compared using the Benjamini-Hochberg false discovery rate to maintain a corrected significance threshold of P < 0.05 (Benjamini and Hochberg, 1995).
Region pairs with between-group differences of nodal characteristics in patients with PTSD were assessed with NBS and computed using the NBS toolbox for Matlab (www.nitrc.org/projects/nbs/). First, we chose the nodes that exhibited between group differences in at least one of the three nodal centralities (nodal degree, efficiency, and betweenness) and then created a connection matrix for each participant. Second, each connection in the connection matrix was separately tested for significance (here: P < 0.001 uncorrected connection-level) and then the resulting networks built by suprathreshold connections were again tested for significance (here: P < 0.05 FWE-corrected network-level). Details of this approach are described elsewhere (Zalesky et al., 2010).
Partial correlations using age, gender and intracranial volume as covariates were performed to verify the relationships between these metrics and the CAPS scores in the PTSD group. Statistical analysis was performed with SPSS software (http://www.spss.com), version 22.0. Age by group interaction effects were evaluated using two-way ANOVAs after dividing the age distribution into younger and older groups approximating pre and post adolescence (10–12 and 13–16 years).
3. Results
3.1. Alterations of global brain network properties
Normalized GM graphs for each participant had a higher average clustering coefficient (γ > 1) and similar characteristic path length (λ ≈ 1) to random reference networks, indicating that networks from each participant had a small world topology (γ/λ > 1) (Fig.1). However, this topology was altered in PTSD. The graphs from PTSD patients were characterized by a decreased characteristic path length (P = 0.006) and increased clustering coefficient (P = 0.023) in comparison to graphs from non-PTSD earthquake survivors. Furthermore, normalized characteristic path length was significantly higher in PTSD (P = 0.044), while no significant differences were identified in normalized clustering coefficients (P = 0.10) or in the small worldness index (P = 0.06). Both global efficiency (P = 0.008) and local efficiency (P = 0.002) were significantly increased in the networks of patients with PTSD compared with those of trauma-exposed control subjects (Fig. 2).
Fig. 1.

Both the PTSD and non-PTSD groups exhibited (A) normalized clustering coefficients (Cp) larger than 1 and (B) normalized path lengths (Lp) approximately equal to 1, indicating that both groups of stressed individuals exhibited the typical features of small-world topology.
Fig. 2.

Graphs showed differences in global topological properties between the PTSD and stressed non-PTSD controls. The global efficiency (Eglob) (P = 0.0085), local efficiency (Eloc) (P = 0.0024), clustering coefficient (Cp) (P = 0.0227), characteristic path length (Lp) (P = 0.0060) and normalized characteristic path length (λ) (P = 0.0443) were significantly different between the two groups. No significant differences were identified in normalized clustering coefficient (γ) (P = 0.0963) and small worldness (σ) (P = 0.0515). An asterisk designates network metrics with a significant difference (P < 0.05).
3.2. Alterations of nodal brain network properties
Brain regions exhibiting significant between-group differences in at least one nodal metric were identified (false discovery rate corrected P < 0.05). Compared to control subjects, patients with PTSD exhibited increased nodal degree in right olfactory gyrus and right inferior parietal gyrus, and increased nodal efficiency in right olfactory gyrus, right inferior parietal gyrus, hippocampus, right superior and inferior occipital gyrus, left middle occipital gyrus, right postcentral gyrus and right caudate nucleus. The betweenness centrality was increased in the right olfactory gyrus, bilateral medial superior frontal gyri, bilateral angular gyri, left anterior cingulate gyrus, right postcentral gyrus, left gyrus rectus, and bilateral occipital gyri (Table 2).
Table 2.
Regions exhibiting altered nodal centralities in patients with PTSD versus trauma exposed control subjects.
| Brain regions |
P values |
||
|---|---|---|---|
| Nodal degree | Nodal efficiency | Nodal betweenness | |
| PTSD > non-PTSD | |||
| Olfactory cortex R | 0.0003 | 0.0034 | 0.0019 |
| Medial superior frontal gyrus L | 0.4840 | 0.1778 | 0.0001 |
| Medial superior frontal gyrus R | 0.0885 | 0.3283 | 0.0001 |
| Anterior cingulate gyrus L | 0.3471 | 0.3405 | 0.0001 |
| Hippocampus L | 0.1050 | 0.0029 | 0.3470 |
| Hippocampus R | 0.0934 | 0.0049 | 0.3455 |
| Superior occipital gyrus R | 0.0575 | 0.0021 | 0.0001 |
| Middle occipital gyrus L | 0.0218 | 0.0010 | 0.0001 |
| Inferior occipital gyrus R | 0.1183 | 0.0040 | 0.0001 |
| Postcentral gyrus R | 0.0330 | 0.0012 | 0.0001 |
| Superior parietal gyrus L | 0.4957 | 0.0297 | 0.0001 |
| Inferior parietal gyrus R | 0.0009 | 0.0048 | 0.0001 |
| Angular gyrus L | 0.2109 | 0.0082 | 0.0001 |
| Angular gyrus R | 0.1311 | 0.0134 | 0.0001 |
| Caudate nucleus R | 0.0233 | 0.0036 | 0.4981 |
| PTSD < non-PTSD | |||
| Medial orbital superior frontal gyrus R | 0.0144 | 0.1880 | 0.0001 |
| Gyrus rectus L | 0.4696 | 0.3064 | 0.0001 |
Regions are listed above if there were significant between-group differences in at least one nodal centrality parameter (shown in bold font).
The Benjamini-Hochberg false discovery rate correction was applied to each nodal measure.
The P value thresholds for nodal degree, nodal efficiency and nodal betweeness were 0.0009, 0.0049 and 0.0019, respectively. All P values were obtained by using a permutation test.
All the brain regions are from AAL (automated anatomical labeling).
Abbreviation: R: right, L: left.
Using age, gender and intracranial volume as covariates in partial correlation analysis, we did not detect significant correlations between the CAPS scores and network parameters that differed between groups. Increased local efficiency relative to controls was greater in 13–16 year old than 10–12 year old PTSD patients (F (1, 40) = 5.93, df = 1, 43, P = 0.019, Fig.3).
Fig. 3.
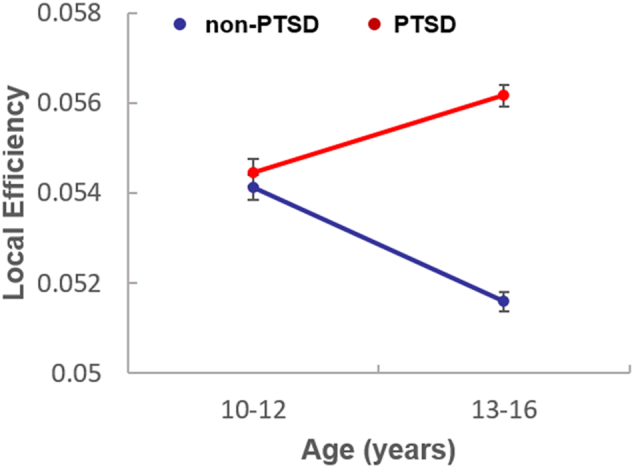
Local efficiency in 13–16 year old and 10–12 year old PTSD patients. Increased local efficiency relative to controls was greater in 13–16 year old than 10–12 year old PTSD patients (F (1, 40) = 5.93, df = 1, 43, P = 0.019).
3.3. PTSD-related alterations in network connectivity
A network with 10 nodes and 18 edges was identified that was significantly altered in PTSD using NBS (Fig. 4). The nodes included regions in DMN (mPFC, hippocampus, left angular gyrus), CEN (right inferior parietal cortex), visual areas (superior and middle occipital gyrus) and right olfactory cortex. Significantly altered edges were observed involving each of these regions. All connectivity alterations within this network were increased in the PTSD group (corrected for multiple comparison).
Fig. 4.

Regions with significantly altered nodal centralities of the brain structural connectome in pediatric PTSD patients are presented in comparison with trauma exposed non-PTSD controls (corrected P < 0.05). Increased connections in the PTSD patients were seen in a single network that had 10 nodes and 18 edges (P = 0.001, corrected). OLF = olfactory cortex, mSFG = medial superior frontal gyrus, HIP = hippocampus, SOG = superior occipital gyrus, MOG = middle occipital gyrus, PoCG = postcentral gyrus, IPG = inferior parietal gyrus, ANG = angular gyrus, CAU = caudate nucleus, L = left, R = right. The results were visualized using the BrainNet viewer package (http://www.nitrc.org/projects/bnv).
4. Discussion
The present study, to the best of our knowledge, demonstrated for the first time that there are significant alterations in topological properties of GM networks in pediatric PTSD. This was achieved using a recently developed method to describe patterns of intracortical similarities using structural MRI data. We found that pediatric PTSD patients showed a more segregated and integrated organization reflected in an increased clustering coefficient and decreased characteristic path length relative to non-PTSD trauma exposed controls that had similar stressful experiences during the earthquake. Altered nodal centrality was found in specific regions known to be components of three neocortical networks: DMN, SN and CEN.
Previous studies have indicated that exposure to intensive traumatic stress changes the molecular organization of stress-response systems and leads to abnormal cellular events such as synaptic pruning (Caldji et al., 1998; Teicher et al., 2002). Altered synaptic pruning and other cellular changes may contribute to our findings of altered anatomic network organization, and to other altered global network metrics extracted reported previously in DTI and resting state fMRI studies of adult and pediatric PTSD (Lei et al., 2015a; Suo et al., 2017; Suo et al., 2015). Changes in cortical structure induced by alterations in the distribution and/or density of cell bodies may also contribute to neural network disruptions (Fagel et al., 2006). Some of these changes in morphological networks may result from heightened functional activity and functional coactivation between regions sharing dense direct or indirect white matter axonal connectivity (Tijms et al., 2013a; Batalle et al., 2013). This latter possibility is supported by fMRI studies suggesting increased activity and connectivity in PTSD (Koch et al., 2016).
Our findings complement those from our previous WM and functional network studies on the same sample examined in the present study (Table 3). The human brain is generally organized as complex networks with two main organizational principles, segregation (reflected by clustering or local efficiency), and integration (reflected by path length and global efficiency) (Bullmore and Sporns, 2012). Thus, our GM similarity results fit with the functional network findings regarding brain segregation reflected by increased Cp and Eloc, in our resting state functional MRI study, but represent opposite findings from those observed in our topographic modeling of DTI results in terms of segregation and integration.
Table 3.
Brain network organization changes observed across different MRI modalities in the same population of pediatric PTSD patients versus trauma-exposed controls.
| Study | Modality | Sample size (PTSD/TEC) |
Cp | Eloc | Segregation | Lp | Eglob | Integration |
|---|---|---|---|---|---|---|---|---|
| Suo et al. | rs-fMRI | 24/24 | ↑ | ↑ | ↑ | – | – | – |
| Suo et al. | DTI | 24/23 | – | ↓ | ↓ | ↑ | ↓ | ↓ |
| Present study | T1-weighted | 22/22 | ↑ | ↑ | ↑ | ↓ | ↑ | ↑ |
Brain parcellation was achieved for each modality using the AAL template (automated anatomical labeling).
The graph theory analysis for all modalities was conducted by GRETNA (www.nitrc.org/projects/gretna/) in Statistical Parametric Mapping (SPM) software (www.fil.ion.ucl.ac.uk/spm/software/SPM8/).
Samples were identical except for modest loss of data due to movement or other artifact.
Although complete mechanistic understanding of all causes of grey matter covariance remains to be developed, synaptogenesis resulting from synchronous firing and synaptic mutually trophic and protective effects via influences of glutamatergic N-methyl-d-aspartate pathways have been speculated to be the two main mechanisms (Alexander-Bloch et al., 2013b). The parallel pattern of altered inter-regional grey matter covariance seen in this study and our previous rs-fMRI findings from this pediatric sample is similar to the consistent pattern associated functional and grey matter connectivity indices in previous studies of healthy human (Segall et al., 2012; Seeley et al., 2009). A common interpretation is that the functional connectivity of synchronous neuronal activation results in network changes in regional grey matter covariance. Thus, our present findings add new evidence for the correspondence between grey matter covariance and functional connectivity by showing consistent patterns of divergence from control participants from these two MRI modalities in our pediatric population. While our data suggest modest relations between these brain network changes and PTSD symptom severity, their relation to cognitive changes is unclear and remains a question to be addressed in future neuropsychological and task-based fMRI research.
In contrast to the similarity of GM and functional changes in network typology, the relative disassociation between these changes and those in WM were unexpected. The changes of segregation and integration in GM were opposite to those in WM. While more research is needed in this area, we propose two potential explanations that might account for this dissociation. First, the most obvious explanation is that the biological meaning of brain network organization revealed by GM and WM are fundamentally different. Previous studies have revealed that brain regions connected via WM tracts covary strongly in grey matter morphology (Alexander-Bloch et al., 2013b) and significant connections by grey matter covariance were partly matched to anatomic connections obtained from DTI (He et al., 2007). However, the only study in which the authors performed a direct pair-by-pair comparison between WM and GM connections, done in healthy individuals, indicated that only 35–40% of GM correlations had convergent WM connections among region pairs with positive cortical thickness correlations, while the percentage of convergent WM connections and GM correlations was <10% among GM regions with negative cortical thickness correlation (Gong et al., 2012). This finding highlights a significant dissociation of GM and WM topographic measurements, which might be further dissociated in disease states, and thus suggests independent mechanisms regulating these two brain parameters. Further, as only a small percent of the 90 × 90 matrix of brain region correlations can be related to WM connections observable using currently available DTI protocols, differences in global patterns of effect are perhaps not surprising. The different changes of brain network from GM and WM observed in our patients emphasize the importance of different information provided by different MRI modalities in pediatric PTSD, and the general importance of multimodal imaging for examining the brain connectome. We note that WM and other imaging data were not only dissociated but actually indicated opposite changes in brain networks. While this may be due to different brain connections being examined, divergent effects of PTSD on brain white matter is an observation requiring replication and focused research in future research. A second possible explanation for the different findings in WM than GM and functional measures may be that decreased segregation and integration of WM might lead to increased GM covariance as a compensation. Li et al. observed increased cortical thickness of brain regions and reduced volume of WM connecting those regions in adult patients with PTSD (Li et al., 2016). One possibility for these observations, and our own, is that GM thickness may increase to compensate for reduced WM fiber tract input by adding capacity for processing information via enhanced local dendritic arborization in cortex. In a previous study with this sample, we showed that the FA (fractional anisotropy) decreased significantly in some brain regions (Lei et al., 2015b). The reduced fiber tract projections of brain networks were observed in parallel with reduced segregation and integration of WM across the brain. This might occur because of the reduction in pathways to its nearest neighbors and remote regions. Finally, such a secondary compensatory adjustment leading to increased GM covariance might occur in order to support function of information transfer in alternative pathways to optimize residual functional brain capacity. These adaptive processes are known to have increased plasticity during neurodevelopment, which may account for the different and more extensive patterns of brain alteration seen in our pediatric sample relative to prior studies of PTSD in adults (Alexander-Bloch et al., 2013b).
The pediatric PTSD findings we observed had multiple differences relative to those of adult PTSD studies. For instance, the small world index sigma has been shown to be significantly lower in adult PTSD while we observed no significant difference in our pediatric patients (Mueller et al., 2015). Both Mueller et al. (Mueller et al., 2015) and Long et al. (Long et al., 2013) did not detect significant changes of whole brain clustering coefficients in adult PTSD using cortical thickness and DTI data respectively. However, both our GM and functional studies demonstrated increased clustering coefficients in pediatric PTSD (Suo et al., 2015). Our findings therefore may need to be considered in the context of ongoing brain development in pediatric patients upon which effects of PTDS are superimposed.
One possibility is that the structural brain alterations seen in our pediatric PTSD may represent consequences of disruptions in brain maturation trajectory, with implications for the functional organization and differentiation of complex brain systems and the higher-order psychological processes they support (Daniels et al., 2011). By dividing the age distribution into two stages as in prior studies as an approximation for separating pre and post pubertal children (Parent et al., 2003), we demonstrated decreased local efficiency in 13–16 year old relative to 10–12 year old controls while the trend in PTSD patients during these ages was in the opposite direction. Khundrakpam et al. (Khundrakpam et al., 2013) in a study of the developmental trend of local efficiency in childhood and adolescence showed a reduction of local efficiency from early (5–8 year old) to late childhood (9–11 year old). Thus our findings suggested that even in non-PTSD participants who experienced a traumatic life stress, there may be a delay in the typical reduction of local brain efficiency.
Neuroendocrine studies have suggested that early life stress in children is associated with abnormal development of the hypothalamic-pituitary-adrenal (HPA) axis (Mccrory et al., 2010). One possibility is that over time there is sensitization of brain system to stressful situations reflected in HPA overactivation which might contribute to the pattern of increased regional segregation and white matter changes observed in our studies. Further research with a longitudinal design following pediatric PTSD patients is needed to clarify the neurobiological substrate of this increased segregation including examination of trophic influences, contribution of heredity, and experience-related plasticity during brain maturation (He et al., 2007).
In addition to changes in global network characteristics, specific nodal changes were observed in three core networks previously shown to be altered in PTSD patients, the DMN, CEN and SN. This “triple network model” proposed by Menon, and supported by a recent meta-analysis of functional alterations in PTSD (Patel et al., 2012) suggests that there are stress related alterations in all these networks. Such alterations may account for the broad and longstanding impact on higher brain and cognitive function in PTSD (Menon, 2011).
PTSD-related alterations in nodal centralities were found in olfactory and visual cortex, areas not commonly affected in adult PTSD. Alterations in visual cortex have been reported both in our previous WM and functional studies, and have been correlated with PTSD symptom severity (Suo et al., 2017). We also found dysfunction of nodal centrality in right olfactory cortex in the present study. Alterations in these sensory systems may be related to repeated flashbacks involving ongoing re-experiencing of images and smells as reported previously (Dileo et al., 2008; Chao et al., 2012). As such flashbacks are one of the most common and severe symptoms in PTSD, these findings may be of direct clinical relevance, and are noteworthy because of their apparently greater prominence in pediatric PTSD patients relative to stressed controls.
It is important to note that both increases and decreases in network parameters were seen in our patients, and that these changes were not consistent across different MRI modalities. We note that our direct comparison of findings from three network modalities in a single patient group, GM, WM and function, remains relatively novel in studies of brain disorders. Thus, interpretation of differences seen across modalities must be made with some caution. Dissociations between brain topological disruptions observed in different imaging modalities need to be better understood in terms of basic biological mechanisms and their impact on brain maturation and organization, perhaps through animal model studies.
The present study had several limitations. All participants were recruited after the earthquake occurred, thus it is not clear whether findings we report reflect consequences of PTSD or some influence of prior risk factors for developing the illness. Second, we do not present direct comparison of matched pediatric and adult samples. Such comparisons will be important in the future for understanding differences between pediatric and adult onset PTSD. Third, our sample was not large, thus replication and characterizing the relation of age of onset to neuroanatomic alterations are important in future. Fourth, the single trauma in the present study increased the sample's homogeneity, but is restricted to only earthquake related PTSD. Caution need to be taken when applying our findings to community population with other acute stressors and more situations with long term elevation in life stress. The single trauma exposure might also be one of the reasons why there was no relation between our network measures and clinical severity in PTSD group. Further, while longer time to our follow up scans helped differentiate those who did and did not later develop PTSD, it may have weakened clinical correlations with MRI data as intervening supportive and stressful events and variable expression of PTSD symptoms over the illness course may have weakened these relations. Finally, we selected an earthquake-exposed control group who did not develop PTSD to differentiate PTSD and general stress effects. Whether and how both of these groups might differ from unstressed community controls remains to be determined to provide more comprehensive insights into how PTSD and major life stress impact the brain connectome. In particular, the current study adds to psychoradiology (https://radiopaedia.org/articles/psychoradiology), an evolving subspecialty of radiology mainly for psychiatric and psychological brain (Lui et al., 2016).
Our analyses of topological brain grey matter networks indicate a significantly more segregated and integrated brain network organization in children with PTSD. The association and disassociation between the WM, GM and rs-fMRI changes seen in our multimodal studies of this population may be important for diagnostic purposes and for understanding the nature of the brain organization changes in children with PTSD. In conclusion, PTSD is a highly prevalent and poorly understood brain disorder, and our study shows that the disorder involves complex pathologies of neocortical network organization that may more extensively impact brain systems in pediatric populations.
Funding information
This study was supported by the National Natural Science Foundation of China (81621003, 81220108013, and 81501452) and the Program for Changjiang Scholars and Innovative Research Team in University of China (IRT16R52). Q.G. was supported by a Changjiang Scholar Professorship Award (T2014190) and the China Medical Board Distinguished Professorship Award (F510000/G16916411) administered by the Institute of International Education, USA. D.L. was supported by the Newton International Fellowship from the Royal Society.
Acknowledgements
The authors would like to thank the study participants and their families. We would like to acknowledge Dafnis Batalle (King's College London) and Jinghui Wang (Hangzhou Normal University, China) for assistance with this research project.
References
- Achard S., Bullmore E. Efficiency and cost of economical brain functional networks. PLoS Comput. Biol. 2007;3(2) doi: 10.1371/journal.pcbi.0030017. [DOI] [PMC free article] [PubMed] [Google Scholar]
- Alexander-Bloch A.F. The anatomical distance of functional connections predicts brain network topology in health and schizophrenia. Cereb. Cortex. 2013;23(1):127–138. doi: 10.1093/cercor/bhr388. [DOI] [PMC free article] [PubMed] [Google Scholar]
- Alexander-Bloch A., Giedd J.N., Bullmore E. Imaging structural co-variance between human brain regions. Nat. Rev. Neurosci. 2013;14(5):322–336. doi: 10.1038/nrn3465. [DOI] [PMC free article] [PubMed] [Google Scholar]
- Ashburner J., Friston K.J. Unified segmentation. NeuroImage. 2005;26(3):839–851. doi: 10.1016/j.neuroimage.2005.02.018. [DOI] [PubMed] [Google Scholar]
- Association, A.P . American Psychiatric Pub; 2013. Diagnostic and Statistical Manual of Mental Disorders (DSM-5®) [Google Scholar]
- Bassett D.S. Hierarchical organization of human cortical networks in health and schizophrenia. J. Neurosci. 2008;28(37):9239–9248. doi: 10.1523/JNEUROSCI.1929-08.2008. [DOI] [PMC free article] [PubMed] [Google Scholar]
- Batalle D. Normalization of similarity-based individual brain networks from gray matter MRI and its association with neurodevelopment in infants with intrauterine growth restriction. NeuroImage. 2013;83:901–911. doi: 10.1016/j.neuroimage.2013.07.045. [DOI] [PubMed] [Google Scholar]
- Benjamini Y., Hochberg Y. Controlling the false discovery rate - a practical and powerful approach to multiple testing. J. R. Stat. Soc. Ser. B Methodol. 1995;57(1):289–300. [Google Scholar]
- Bernhardt B.C., Bonilha L., Gross D.W. Network analysis for a network disorder: the emerging role of graph theory in the study of epilepsy. Epilepsy Behav. 2015;50:162–170. doi: 10.1016/j.yebeh.2015.06.005. [DOI] [PubMed] [Google Scholar]
- Bernhardt B.C. Subregional mesiotemporal network topology is altered in temporal lobe epilepsy. Cereb. Cortex. 2016;26(7):3237–3248. doi: 10.1093/cercor/bhv166. [DOI] [PMC free article] [PubMed] [Google Scholar]
- Blake D.D. The development of a clinician-administered PTSD scale. J. Trauma. Stress. 1995;8(1):75–90. doi: 10.1007/BF02105408. [DOI] [PubMed] [Google Scholar]
- Bullmore E., Sporns O. The economy of brain network organization. Nat. Rev. Neurosci. 2012;13(5):336–349. doi: 10.1038/nrn3214. [DOI] [PubMed] [Google Scholar]
- Caldji C. Maternal care during infancy regulates the development of neural systems mediating the expression of fearfulness in the rat. Proc. Natl. Acad. Sci. U. S. A. 1998;95(9):5335–5340. doi: 10.1073/pnas.95.9.5335. [DOI] [PMC free article] [PubMed] [Google Scholar]
- Chao L.L., Lenoci M., Neylan T.C. Effects of post-traumatic stress disorder on occipital lobe function and structure. Neuroreport. 2012;23(7):412–419. doi: 10.1097/WNR.0b013e328352025e. [DOI] [PubMed] [Google Scholar]
- Chen Z.J. Revealing modular architecture of human brain structural networks by using cortical thickness from MRI. Cereb. Cortex. 2008;18(10):2374–2381. doi: 10.1093/cercor/bhn003. [DOI] [PMC free article] [PubMed] [Google Scholar]
- Chen L. Impact of acute stress on human brain microstructure: an MR diffusion study of earthquake survivors. Hum. Brain Mapp. 2013;34(2):367–373. doi: 10.1002/hbm.21438. [DOI] [PMC free article] [PubMed] [Google Scholar]
- Cisler J.M. Changes in functional connectivity of the amygdala during cognitive reappraisal predict symptom reduction during trauma-focused cognitive-behavioral therapy among adolescent girls with post-traumatic stress disorder. Psychol. Med. 2016;1(14):1–11. doi: 10.1017/S0033291716001847. [DOI] [PubMed] [Google Scholar]
- Cisler J.M. Modes of large-scale brain network organization during threat processing and posttraumatic stress disorder symptom reduction during TF-CBT among adolescent girls. PLoS One. 2016;11(8) doi: 10.1371/journal.pone.0159620. [DOI] [PMC free article] [PubMed] [Google Scholar]
- Dai W. The incidence of post-traumatic stress disorder among survivors after earthquakes: a systematic review and meta-analysis. BMC Psychiatry. 2016;16:188. doi: 10.1186/s12888-016-0891-9. [DOI] [PMC free article] [PubMed] [Google Scholar]
- Daniels J.K. Default mode alterations in posttraumatic stress disorder related to early-life trauma: a developmental perspective. J. Psychiatry Neurosci. 2011;36(1):56–59. doi: 10.1503/jpn.100050. [DOI] [PMC free article] [PubMed] [Google Scholar]
- Dileo J.F. Olfactory identification dysfunction, aggression and impulsivity in war veterans with post-traumatic stress disorder. Psychol. Med. 2008;38(4):523–531. doi: 10.1017/S0033291707001456. [DOI] [PubMed] [Google Scholar]
- Fagel D.M. Cortical neurogenesis enhanced by chronic perinatal hypoxia. Exp. Neurol. 2006;199(1):77–91. doi: 10.1016/j.expneurol.2005.04.006. [DOI] [PubMed] [Google Scholar]
- Fan Y. Brain anatomical networks in early human brain development. NeuroImage. 2011;54(3):1862–1871. doi: 10.1016/j.neuroimage.2010.07.025. [DOI] [PMC free article] [PubMed] [Google Scholar]
- First M.B. American Psychiatric Pub; 1997. Structured Clinical Interview for DSM-IV Axis II Personality Disorders: SCID-II. [Google Scholar]
- Fletcher K.E. Childhood posttraumatic stress disorder. J. Clin. Child Psychol. 1996:242–276. [Google Scholar]
- Gong G. Convergence and divergence of thickness correlations with diffusion connections across the human cerebral cortex. NeuroImage. 2012;59(2):1239–1248. doi: 10.1016/j.neuroimage.2011.08.017. [DOI] [PubMed] [Google Scholar]
- Guo H. Machine learning classifier using abnormal brain network topological metrics in major depressive disorder. Neuroreport. 2012;23(17):1006–1011. doi: 10.1097/WNR.0b013e32835a650c. [DOI] [PubMed] [Google Scholar]
- He Y., Chen Z.J., Evans A.C. Small-world anatomical networks in the human brain revealed by cortical thickness from MRI. Cereb. Cortex. 2007;17(10):2407–2419. doi: 10.1093/cercor/bhl149. [DOI] [PubMed] [Google Scholar]
- He Y., Chen Z., Evans A. Structural insights into aberrant topological patterns of large-scale cortical networks in Alzheimer's disease. J. Neurosci. 2008;28(18):4756–4766. doi: 10.1523/JNEUROSCI.0141-08.2008. [DOI] [PMC free article] [PubMed] [Google Scholar]
- He Y. Impaired small-world efficiency in structural cortical networks in multiple sclerosis associated with white matter lesion load. Brain. 2009;132(Pt 12):3366–3379. doi: 10.1093/brain/awp089. [DOI] [PMC free article] [PubMed] [Google Scholar]
- van den Heuvel M.P. Aberrant frontal and temporal complex network structure in schizophrenia: a graph theoretical analysis. J. Neurosci. 2010;30(47):15915–15926. doi: 10.1523/JNEUROSCI.2874-10.2010. [DOI] [PMC free article] [PubMed] [Google Scholar]
- Jin C. Abnormalities in whole-brain functional connectivity observed in treatment-naive post-traumatic stress disorder patients following an earthquake. Psychol. Med. 2014;44(9):1927–1936. doi: 10.1017/S003329171300250X. [DOI] [PubMed] [Google Scholar]
- Kennis M. Functional network topology associated with posttraumatic stress disorder in veterans. Neuroimage Clin. 2016;10:302–309. doi: 10.1016/j.nicl.2015.12.008. [DOI] [PMC free article] [PubMed] [Google Scholar]
- Kessler R.C. Lifetime prevalence and age-of-onset distributions of DSM-IV disorders in the National Comorbidity Survey Replication. Arch. Gen. Psychiatry. 2005;62(6):593–602. doi: 10.1001/archpsyc.62.6.593. [DOI] [PubMed] [Google Scholar]
- Khundrakpam B.S. Developmental changes in organization of structural brain networks. Cereb. Cortex. 2013;23(9):2072–2085. doi: 10.1093/cercor/bhs187. [DOI] [PMC free article] [PubMed] [Google Scholar]
- Koch S.B.J. Aberrant resting-state brain activity in posttraumatic stress disorder: a meta-analysis and systematic review. Depress. Anxiety. 2016;(7) doi: 10.1002/da.22478. [DOI] [PubMed] [Google Scholar]
- Lamberg L. Psychiatrists explore legacy of traumatic stress in early life. JAMA. 2001;286(5):523–526. doi: 10.1001/jama.286.5.523. [DOI] [PubMed] [Google Scholar]
- Lei D. Disrupted functional brain connectome in patients with posttraumatic stress disorder. Radiology. 2015;276(3):818–827. doi: 10.1148/radiol.15141700. [DOI] [PubMed] [Google Scholar]
- Lei D. Microstructural abnormalities in children with post-traumatic stress disorder: a diffusion tensor imaging study at 3.0T. Sci. Rep. 2015;5:8933. doi: 10.1038/srep08933. [DOI] [PMC free article] [PubMed] [Google Scholar]
- Li X. Unique topology of language processing brain network: a systems-level biomarker of schizophrenia. Schizophr. Res. 2012;141(2–3):128–136. doi: 10.1016/j.schres.2012.07.026. [DOI] [PMC free article] [PubMed] [Google Scholar]
- Li S. Posttraumatic stress disorder: structural characterization with 3-T MR imaging. Radiology. 2016;280(2):537–544. doi: 10.1148/radiol.2016150477. [DOI] [PubMed] [Google Scholar]
- Liberzon I., Abelson J.L. Context processing and the neurobiology of post-traumatic stress disorder. Neuron. 2016;92(1):14–30. doi: 10.1016/j.neuron.2016.09.039. [DOI] [PMC free article] [PubMed] [Google Scholar]
- Long Z. Altered brain structural connectivity in post-traumatic stress disorder: a diffusion tensor imaging tractography study. J. Affect. Disord. 2013;150(3):798–806. doi: 10.1016/j.jad.2013.03.004. [DOI] [PubMed] [Google Scholar]
- Lui S. High-field MRI reveals an acute impact on brain function in survivors of the magnitude 8.0 earthquake in China. Proc. Natl. Acad. Sci. U. S. A. 2009;106(36):15412–15417. doi: 10.1073/pnas.0812751106. [DOI] [PMC free article] [PubMed] [Google Scholar]
- Lui S., Zhou X.J., Sweeney J.A., Gong Q. Psychoradiology: the frontier of neuroimaging in psychiatry. Radiology. 2016;281:357–372. doi: 10.1148/radiol.2016152149. [DOI] [PMC free article] [PubMed] [Google Scholar]
- Maslov S., Sneppen K. Specificity and stability in topology of protein networks. Science. 2002;296(5569):910–913. doi: 10.1126/science.1065103. [DOI] [PubMed] [Google Scholar]
- Mccrory E., De Brito S.A., Viding E. Research review: the neurobiology and genetics of maltreatment and adversity. J. Child Psychol. Psychiatry. 2010;51(10):1079–1095. doi: 10.1111/j.1469-7610.2010.02271.x. [DOI] [PubMed] [Google Scholar]
- Menon V. Large-scale brain networks and psychopathology: a unifying triple network model. Trends Cogn. Sci. 2011;15(10):483–506. doi: 10.1016/j.tics.2011.08.003. [DOI] [PubMed] [Google Scholar]
- Merikangas K.R. Lifetime prevalence of mental disorders in U.S. adolescents: results from the National Comorbidity Survey Replication–Adolescent Supplement (NCS-A) J. Am. Acad. Child Adolesc. Psychiatry. 2010;49(10):980–989. doi: 10.1016/j.jaac.2010.05.017. [DOI] [PMC free article] [PubMed] [Google Scholar]
- Mueller S.G. Evidence for disrupted gray matter structural connectivity in posttraumatic stress disorder. Psychiatry Res. 2015;234(2):194–201. doi: 10.1016/j.pscychresns.2015.09.006. [DOI] [PubMed] [Google Scholar]
- Parent A.S. The timing of normal puberty and the age limits of sexual precocity: variations around the world, secular trends, and changes after migration. Endocr. Rev. 2003;24(5):668–693. doi: 10.1210/er.2002-0019. [DOI] [PubMed] [Google Scholar]
- Patel R. Neurocircuitry models of posttraumatic stress disorder and beyond: a meta-analysis of functional neuroimaging studies. Neurosci. Biobehav. Rev. 2012;36(9):2130–2142. doi: 10.1016/j.neubiorev.2012.06.003. [DOI] [PubMed] [Google Scholar]
- Qi S. Anomalous gray matter structural networks in recent onset post-traumatic stress disorder. Brain Imaging Behav. 2017 doi: 10.1007/s11682-017-9693-z. [DOI] [PubMed] [Google Scholar]
- Salvador R. Neurophysiological architecture of functional magnetic resonance images of human brain. Cereb. Cortex. 2005;15(9):1332–1342. doi: 10.1093/cercor/bhi016. [DOI] [PubMed] [Google Scholar]
- Seeley W.W. Neurodegenerative diseases target large-scale human brain networks. Neuron. 2009;62(1):42–52. doi: 10.1016/j.neuron.2009.03.024. [DOI] [PMC free article] [PubMed] [Google Scholar]
- Segall J.M. Correspondence between structure and function in the human brain at rest. Front. Neuroinform. 2012;6:10. doi: 10.3389/fninf.2012.00010. [DOI] [PMC free article] [PubMed] [Google Scholar]
- Sethi M., Pedersen M., Jackson G.D. Polymicrogyric cortex may predispose to seizures via abnormal network topology: an fMRI connectomics study. Epilepsia. 2016;57(3):e64–8. doi: 10.1111/epi.13304. [DOI] [PubMed] [Google Scholar]
- Singh M.K. Anomalous gray matter structural networks in major depressive disorder. Biol. Psychiatry. 2013;74(10):777–785. doi: 10.1016/j.biopsych.2013.03.005. [DOI] [PMC free article] [PubMed] [Google Scholar]
- Spielberg J.M. Brain network disturbance related to posttraumatic stress and traumatic brain injury in veterans. Biol. Psychiatry. 2015;78(3):210–216. doi: 10.1016/j.biopsych.2015.02.013. [DOI] [PubMed] [Google Scholar]
- Sporns O., Tononi G., Kotter R. The human connectome: a structural description of the human brain. PLoS Comput. Biol. 2005;1(4) doi: 10.1371/journal.pcbi.0010042. [DOI] [PMC free article] [PubMed] [Google Scholar]
- Stam C.J. Functional connectivity patterns of human magnetoencephalographic recordings: a 'small-world' network? Neurosci. Lett. 2004;355(1–2):25–28. doi: 10.1016/j.neulet.2003.10.063. [DOI] [PubMed] [Google Scholar]
- Stam C.J. Graph theoretical analysis of magnetoencephalographic functional connectivity in Alzheimer's disease. Brain. 2009;132(Pt 1):213–224. doi: 10.1093/brain/awn262. [DOI] [PubMed] [Google Scholar]
- Suo X. Disrupted brain network topology in pediatric posttraumatic stress disorder: a resting-state fMRI study. Hum. Brain Mapp. 2015;36(9):3677–3686. doi: 10.1002/hbm.22871. [DOI] [PMC free article] [PubMed] [Google Scholar]
- Suo X. Anatomic insights into disrupted small-world networks in pediatric posttraumatic stress disorder. Radiology. 2017;282(3):826–834. doi: 10.1148/radiol.2016160907. [DOI] [PubMed] [Google Scholar]
- Teicher M.H. Developmental neurobiology of childhood stress and trauma. Psychiatr. Clin. North Am. 2002;25(2):397–426. doi: 10.1016/s0193-953x(01)00003-x. (vii–viii) [DOI] [PubMed] [Google Scholar]
- Tijms B.M. Similarity-based extraction of individual networks from gray matter MRI scans. Cereb. Cortex. 2012;22(7):1530–1541. doi: 10.1093/cercor/bhr221. [DOI] [PubMed] [Google Scholar]
- Tijms B.M. Single-subject grey matter graphs in Alzheimer's disease. PLoS One. 2013;8(3) doi: 10.1371/journal.pone.0058921. [DOI] [PMC free article] [PubMed] [Google Scholar]
- Tijms B.M. Alzheimer's disease: connecting findings from graph theoretical studies of brain networks. Neurobiol. Aging. 2013;34(8):2023–2036. doi: 10.1016/j.neurobiolaging.2013.02.020. [DOI] [PubMed] [Google Scholar]
- Tijms B.M. Single-subject gray matter graph properties and their relationship with cognitive impairment in early- and late-onset Alzheimer's disease. Brain Connect. 2014;4(5):337–346. doi: 10.1089/brain.2013.0209. [DOI] [PubMed] [Google Scholar]
- Tijms B.M. Grey matter networks in people at increased familial risk for schizophrenia. Schizophr. Res. 2015;168(1–2):1–8. doi: 10.1016/j.schres.2015.08.025. [DOI] [PubMed] [Google Scholar]
- Tijms B.M. Gray matter network disruptions and amyloid beta in cognitively normal adults. Neurobiol. Aging. 2016;37:154–160. doi: 10.1016/j.neurobiolaging.2015.10.015. [DOI] [PubMed] [Google Scholar]
- Wang J. GRETNA: a graph theoretical network analysis toolbox for imaging connectomics. Front. Hum. Neurosci. 2015;9:386. doi: 10.3389/fnhum.2015.00386. [DOI] [PMC free article] [PubMed] [Google Scholar]
- Wang T. Disorganized cortical thickness covariance network in major depressive disorder implicated by aberrant hubs in large-scale networks. Sci. Rep. 2016;6 doi: 10.1038/srep27964. (pp. 27964) [DOI] [PMC free article] [PubMed] [Google Scholar]
- Watts D.J., Strogatz S.H. Collective dynamics of ‘small-world’ networks. Nature. 1998;393(6684):440–442. doi: 10.1038/30918. [DOI] [PubMed] [Google Scholar]
- Weathers F. National Center for PTSD; Boston, MA: 1994. The PTSD Checklist-Civilian Version (PCL-C) [Google Scholar]
- Weese J. Gray-value based registration of CT and MR images by maximization of local correlation. In: Taylor C., Colchester A., editors. Medical Image Computing and Computer-Assisted Intervention, Miccai'99, Proceedings. 1999. pp. 656–663. [Google Scholar]
- van Wijk B.C.M., Stam C.J., Daffertshofer A. Comparing Brain networks of different size and connectivity density using graph theory. PLoS One. 2010;5(10) doi: 10.1371/journal.pone.0013701. [DOI] [PMC free article] [PubMed] [Google Scholar]
- Zalesky A., Fornito A., Bullmore E.T. Network-based statistic: identifying differences in brain networks. NeuroImage. 2010;53(4):1197–1207. doi: 10.1016/j.neuroimage.2010.06.041. [DOI] [PubMed] [Google Scholar]
- Zhang J. Disrupted brain connectivity networks in drug-naive, first-episode major depressive disorder. Biol. Psychiatry. 2011;70(4):334–342. doi: 10.1016/j.biopsych.2011.05.018. [DOI] [PubMed] [Google Scholar]