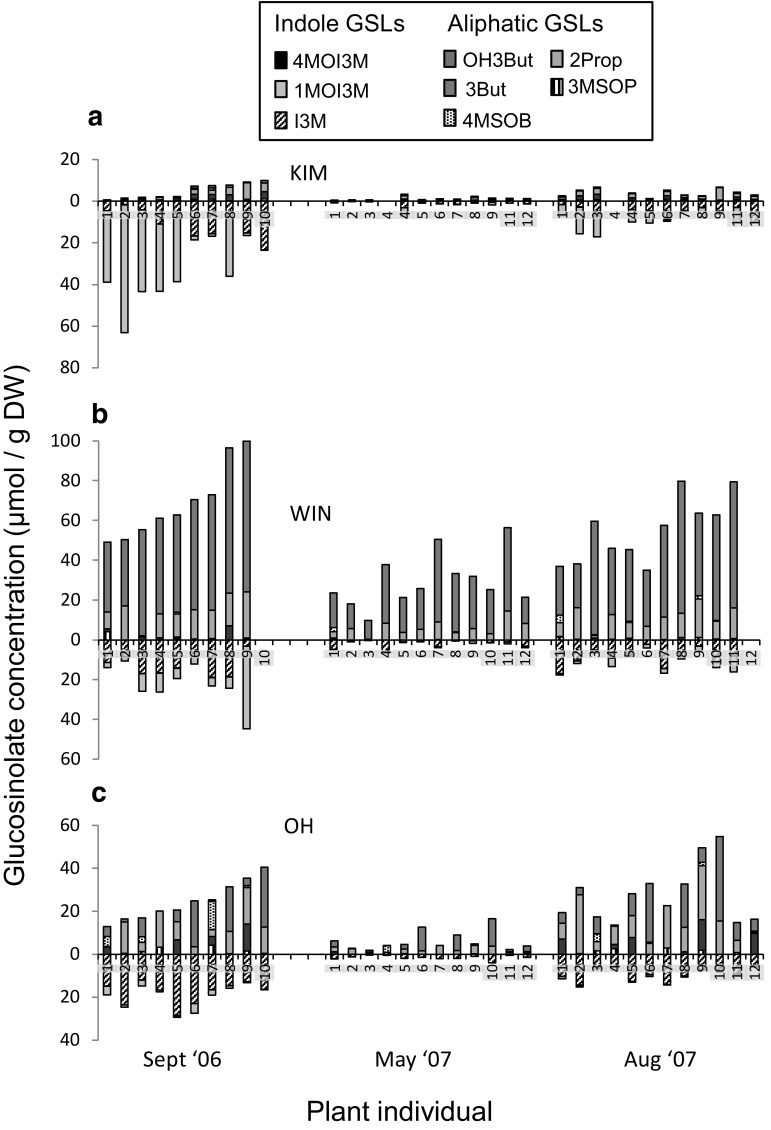
Fig. 2.
Foliar glucosinolate (GSL) concentrations measured repeatedly in the same plant individual during 2 years of growth in three wild cabbage populations, a KIM, b WIN and c OH, originating in Dorset, England and grown in a common garden. Concentrations above the x-axis depict aliphatic GSL concentrations, those below the x-axis depict indole GSLs. Pants were sampled in September 2006 (first year of growth), and in May and August of the following year. For the full names of the GSL compounds see Fig. 1 and the “Glucosinolate analysis” section

