

Abstract
Background
Compared to transvenous (TV) implantable cardioverter defibrillators (ICD), subcutaneous (S) ICDs require a higher energy for effective defibrillation. Although ventricular fibrillation (VF) conversion testing (CT) is recommended after S-ICD implantation to ensure an adequate margin between the defibrillation threshold and maximum device output (80J), prior work found that adherence to this recommendation is declining.
Methods
We studied first time S-ICD recipients (between September 28, 2012 and April 1, 2016) in the National Cardiovascular Database Registry ICD Registry to determine: predictors of use of CT, predictors of an insufficient safety margin (ISM, defined as VF conversion energy >65J) during testing, and in-hospital outcomes associated with use of CT. Multivariable logistic regression analysis was used to predict use of CT and ISM. Inverse probability weighted logistic regression analysis was used to examine the association between use of CT and in-hospital adverse events including death.
Results
CT testing was performed in 70.7% (n=5,624) of 7,960 S-ICD patients. Although deferral of CT was associated with several patient characteristics (including increased body mass index, increased body surface area, severely reduced ejection fraction, dialysis dependence, warfarin use, anemia, hypertrophic cardiomyopathy), the facility effect was comparatively more important (area under the curve for patient level versus generalized linear mixed model: 0.619 vs. 0.877). An ISM occurred in 6.9% (n=336) of 4,864 patients without a prior ICD and was more common among white patients and those with ventricular pacing on the pre-implant ECG, higher pre-implant blood pressure, larger body surface area, higher body mass index, and lower ejection fraction. A risk score was able to identify patients at low (<5%), medium (5-10%), and higher risk (>10%) for ISM. CT testing was not associated with a composite of in-hospital complications including death.
Conclusions
Use of CT testing after S-ICD implantation was driven by facility preference to a greater extent than patient factors and was not associated with a composite of in-hospital complications or death. ISM was relatively uncommon and is associated with several widely available patient characteristics. These data may inform ICD system selection and a targeted approach to CT.
Keywords: subcutaneous implantable cardioverter defibrillator, defibrillation, implantable cardioverter defibrillator
INTRODUCTION
The subcutaneous (S) implantable cardioverter defibrillator (ICD)(Boston Scientific, Natick, MA) is an entirely subcutaneous system that does not require intraprocedural vascular access or endovascular defibrillator leads or coils.1 The S-ICD has a novel mechanism of defibrillation and is associated with an increased energy requirement for defibrillation when compared to traditional transvenous ICDs.1 These factors, in association with an absence of data on the safety of forgoing VF conversion testing at the time of implant, have made VF conversion testing at the time of S-ICD implant a Class I (level of evidence C) recommendation.2 This is in stark contrast to the recommended approach for defibrillation threshold testing (DFT) testing at the time of transvenous ICD implant, where testing is not required routinely and is typically reserved for those at higher risk for inadequate safety margins (ISM).2
Prior research from the National Cardiovascular Data Registry (NCDR) ICD Registry has demonstrated a compelling need for additional research on VF conversion testing at the time of S-ICD implantation based on: very high rates of successful VF conversion testing at the time of S-ICD implant (92.7% and 99.8% at ≤65J and ≤80J, respectively); declining adherence to the Class I recommendation for use of VF conversion testing at the time of S-ICD implant; and increased incidence of peri-procedural cardiac arrest among S-ICD recipients (compared to transvenous ICD recipients) which could be related to VF conversion testing.3 Based on these knowledge gaps regarding VF conversion testing after S-ICD implantation, we performed an analysis of the NCDR ICD registry to understand factors associated with use of VF conversion testing, predictors of ISM at the time of VF conversion testing, and in-hospital outcomes associated with VF conversion testing.
METHODS
The data, analytic methods, and study materials cannot be made available to other researchers by the authors for purposes of reproducing the results or replicating the procedure, because the data are owned by the NCDR. The Yale University Human Investigation Committee approved the present analysis with waiver of informed consent.
Patient Characteristics
Baseline characteristics were obtained from the ICD Registry V2.1 Data Collection Form and included demographics, history and risk factors, diagnostic studies, and relevant pre-procedure hospitalization data. We considered all patients who underwent S-ICD implantation between September 28, 2012, the date of the Food and Drug Administration approval, and April 1, 2016, the date at which the NCDR transitioned to an updated case report form that did not include information on VF conversion testing. For the 1st aim (predicting use of VF conversion testing), we excluded patients who underwent S-ICD generator replacement, reportedly underwent upper limit of vulnerability testing (which is not feasible with the S-ICD), and those implanted outside of the United States. For the 2nd aim (predictors of ISM), we included the subset of the Aim 1 patients who underwent VF conversion testing, and additionally excluded those with a reported VF conversion testing result outside of the plausible range (<10J or >80J) and those with a prior ICD (or missing information regarding history of a prior ICD). For the 3rd aim (in-hospital outcomes), we included the subset of patients from the 1st aim who were admitted for the S-ICD procedure and excluded those with a prior ICD (or missing information regarding history of a prior ICD).
Predictors of interest
We considered several variables for the multivariable models, including demographics (age, sex, ethnicity, and race), anthropometric variables (height, weight, body mass index, and body surface area), hospital characteristics, and past medical history. GFR was calculated using the Modification of Diet in Renal Disease formula.4 Implausible clinical values for continuous variables were set to missing prior to the start of the analysis and later imputed. Both missing continuous variables and categorical variables were imputed using fully conditional specification prior to modeling.5
Outcomes
All outcomes were ascertained from the NCDR ICD Registry case report form. For the 1st aim, which sought to identify predictors of use of VF conversion testing after S-ICD implantation, the outcome of interest was use of VF conversion testing as reported in the case report form. For the 2nd aim, ISM was defined as when the lowest energy that resulted in conversion of ventricular fibrillation was >65J during the procedure. This definition was based on the widely held belief that a successful conversion at 65J represents an adequate safety margin relative to 80J, which is the only programmable output used outside of testing in the electrophysiology laboratory. Since device revision due to an ISM may have been performed prior to the lowest achieved VF conversion energy, the VF conversion value for this study best reflects the VF conversion energy at the final device position. The ICD Registry does not contain data regarding if multiple tests were performed and if device revisions were required to achieve the lowest reported value; as such, data on the frequency and outcomes associated with multiple testing and device revisions cannot be presented. For the 3rd aim, the primary endpoint was a composite of in-hospital adverse events consisting of: death, cardiac arrest, cardiac perforation, valve injury, hematoma requiring re-operation or blood transfusion, hemothorax, infection, lead dislodgement, myocardial infarction, pericardial tamponade, set screw problem, pneumothorax, transient ischemic attack or stroke, or urgent cardiac surgery.
Statistical Analysis
Aim1: Predictors of use of VF conversion Testing
We described the characteristics of patients, centers, and physicians associated with use versus non-use of VF conversion testing. Between group differences were tested using the Chi-square test for categorical variables and the Wilcoxon rank sum tests or t-tests for continuous variables. We employed multivariable logistic regression using Generalized Estimating Equations (GEE) accounting for clustering within facilities. Purposeful selection (as described by Hosmer and Lemeshow6) was used for patient level model selection. All variables in Table 1 were considered for inclusion except for year of implantation and giant cell myocarditis (n=1, precluding ability to generate an estimate). When a non-linear relationship between a continuous variable and use/non-use of VF conversion testing was observed, we plotted the relationship and binned the variable based on the observed relationship using clinically relevant thresholds. Generalized linear mixed models and hospital specific median odds ratios7 were later used to ascertain facility specific effects.
Table 1.
Patient, hospital, and physician characteristics for S-ICD patients who did and did not undergo DFT testing.
| Total (n=7,960) |
VF conversion Testing (n=5,624) |
No VF conversion Testing (n=2,336) |
||||
|---|---|---|---|---|---|---|
| Mean or absolute number | Proportion or standard deviation | Mean or absolute number | Proportion or standard deviation | Mean or absolute number | Proportion or standard deviation | |
| Age - Mean(SD) | 53.0 | 15.4 | 52.6 | 15.3 | 54.1 | 15.5 |
| Female | 2,417 | 30.4 | 1,682 | 29.9 | 735 | 31.5 |
| Race | ||||||
| White non-Hispanic | 4,813 | 60.5 | 3,524 | 62.7 | 1,289 | 55.2 |
| Black non-Hispanic | 2,217 | 27.9 | 1,470 | 26.1 | 747 | 32.0 |
| Hispanic | 573 | 7.2 | 380 | 6.8 | 193 | 8.3 |
| Other | 357 | 4.5 | 250 | 4.5 | 107 | 4.6 |
| Insurance Payor (not mutually exclusive) | ||||||
| Private | 4,748 | 59.7 | 3,398 | 60.4 | 1,350 | 57.8 |
| Medicare | 3,468 | 43.6 | 2,360 | 42.0 | 1,108 | 47.4 |
| Medicaid | 1,778 | 22.3 | 1,221 | 21.7 | 557 | 23.8 |
| Other | 334 | 4.2 | 250 | 4.5 | 84 | 3.6 |
| None | 236 | 3.0 | 172 | 3.1 | 64 | 2.7 |
| Height, m - Mean(SD) | 1.7 | 0.1 | 1.7 | 0.1 | 1.7 | 0.1 |
| Weight, kg - Mean(SD) | 88.3 | 23.4 | 88.3 | 22.8 | 88.4 | 24.7 |
| Body Surface Area, m2 - Mean (SD) | 29.5 | 6.9 | 29.5 | 6.8 | 29.7 | 7.2 |
| Body Mass Index, kg/m2-Mean (SD) | 2.0 | 0.3 | 2.0 | 0.3 | 2.0 | 0.3 |
| QRS Duration, ms - Mean(SD) | 103.6 | 20.3 | 103.5 | 20.1 | 103.9 | 20.8 |
| PR Interval, ms - Mean(SD) | 170.8 | 31.9 | 170.3 | 31.7 | 172.1 | 32.3 |
| Non-Ischemic Dilated Cardiomyopathy | 3,352 | 42.2 | 2,319 | 41.3 | 1,033 | 44.4 |
| Ischemic HD | 3,423 | 43.0 | 2,432 | 43.3 | 991 | 42.5 |
| Atrial Fibrillation/Flutter | 1,447 | 18.2 | 910 | 16.2 | 537 | 23.0 |
| Ventricular Tachycardia | 2,270 | 28.6 | 1,611 | 28.7 | 659 | 28.3 |
| Preoperative Warfarin | 1,310 | 16.5 | 826 | 14.7 | 484 | 20.7 |
| If yes-Held | 947 | 72.5 | 588 | 71.3 | 359 | 74.5 |
| If yes-INR | 1.6 | 0.6 | 1.6 | 0.6 | 1.6 | 0.7 |
| NYHA Class | ||||||
| I | 2,029 | 25.7 | 1,493 | 26.7 | 536 | 23.1 |
| II | 3,326 | 42.1 | 2,392 | 42.8 | 934 | 40.3 |
| III | 2,425 | 30.7 | 1,628 | 29.1 | 797 | 34.4 |
| IV | 129 | 1.6 | 77 | 1.4 | 52 | 2.2 |
| Previous ICD | 1,004 | 12.6 | 711 | 12.6 | 293 | 12.5 |
| Previous Pacemaker | 138 | 1.7 | 90 | 1.6 | 48 | 2.1 |
| Previous PCI | 2,162 | 27.2 | 1,573 | 28.0 | 589 | 25.3 |
| Previous CABG | 1,307 | 16.5 | 937 | 16.7 | 370 | 15.9 |
| Diabetes | 2,917 | 36.7 | 2,015 | 35.9 | 902 | 38.7 |
| Previous MI | 3,079 | 38.7 | 2,191 | 39.0 | 888 | 38.1 |
| Structural Abnormalities | ||||||
| Amyloidosis | 5 | 0.1 | 2 | 0.0 | 3 | 0.1 |
| Ebsteins anomaly | 5 | 0.1 | 3 | 0.1 | 2 | 0.1 |
| Transposition of the Great Vessels | 23 | 0.3 | 12 | 0.2 | 11 | 0.5 |
| Giant Cell Myocarditis | 1 | 0.0 | 1 | 0.0 | 0 | 0.0 |
| LV non-compaction | 57 | 0.7 | 46 | 0.8 | 11 | 0.5 |
| Tetrology of Fallot | 26 | 0.3 | 15 | 0.3 | 11 | 0.5 |
| Hypertrophic cardiomyopathy | 428 | 5.4 | 339 | 6.1 | 89 | 3.8 |
| ARVD | 44 | 0.6 | 36 | 0.6 | 8 | 0.3 |
| Common Ventricle | 8 | 0.1 | 5 | 0.1 | 3 | 0.1 |
| Syndromes Associated with SCD | ||||||
| Long QT Syndrome | 334 | 4.2 | 239 | 4.3 | 95 | 4.1 |
| Short QT Syndrome | 6 | 0.1 | 3 | 0.1 | 3 | 0.1 |
| Brugada Syndrome | 129 | 1.6 | 92 | 1.6 | 37 | 1.6 |
| Catecholaminergic Polymorphic VT | 14 | 0.2 | 9 | 0.2 | 5 | 0.2 |
| Idiopathic VF | 117 | 1.5 | 87 | 1.6 | 30 | 1.3 |
| Chronic Lung Disease | 1,291 | 16.2 | 882 | 15.7 | 409 | 17.5 |
| Sleep Apnea | ||||||
| No | 4,612 | 58.1 | 3,248 | 57.9 | 1,364 | 58.6 |
| Yes | 1,094 | 13.8 | 767 | 13.7 | 327 | 14.1 |
| Not Assessed | 2,237 | 28.2 | 1,600 | 28.5 | 637 | 27.4 |
| Cerebrovascular Disease | 937 | 11.8 | 637 | 11.3 | 300 | 12.9 |
| Cardiac Arrest | 1,582 | 19.9 | 1,149 | 20.5 | 433 | 18.6 |
| Hypertension | 5,613 | 70.6 | 3,919 | 69.8 | 1,694 | 72.6 |
| Syncope | 1,310 | 16.5 | 940 | 16.7 | 370 | 15.9 |
| CHF Duration >9 months (among those with HF) | 3,991 | 68.5 | 2,762 | 68.1 | 1,229 | 69.3 |
| AV Conduction | ||||||
| 2nd degree block | 16 | 0.2 | 8 | 0.1 | 8 | 0.3 |
| 3rd degree block | 13 | 0.2 | 7 | 0.1 | 6 | 0.3 |
| Ventricular Pacing | 67 | 0.8 | 46 | 0.8 | 21 | 0.9 |
| EF % - Mean(SD) | 31.8 | 14.3 | 32.5 | 14.4 | 30.1 | 14.0 |
| GFR, ml/min/1.73 m2 | ||||||
| ≥60 | 4,807 | 61.1 | 3,541 | 63.7 | 1,266 | 55.0 |
| 30-59 | 1,258 | 16.0 | 869 | 15.6 | 389 | 16.9 |
| 15-29 | 254 | 3.2 | 171 | 3.1 | 83 | 3.6 |
| <15 including those on dialysis | 1,543 | 19.6 | 978 | 17.6 | 565 | 24.5 |
| Dialysis | 1,430 | 18.0 | 917 | 16.3 | 513 | 22.0 |
| BUN mg/dL - Median (25th-75th) | 19.0 | (14.00-29.00) | 18.0 | (13.00-27.00) | 20.0 | (14.00-32.00) |
| Hemoglobin, g/dL - Mean(SD) | 12.7 | 2.2 | 12.8 | 2.1 | 12.4 | 2.2 |
| Potassium, mEq/L- Mean(SD) | 4.2 | 0.5 | 4.2 | 0.5 | 4.3 | 0.5 |
| Sodium, mEq/L - Mean(SD) | 138.5 | 3.2 | 138.5 | 3.2 | 138.4 | 3.4 |
| Systolic BP, mmHg-Mean(SD) | 127.2 | 22.6 | 127.2 | 22.6 | 127.1 | 22.7 |
| Diastolic BP, mmHg-Mean(SD) | 73.4 | 14.1 | 73.6 | 14.1 | 72.9 | 14.0 |
| Reason for Admission | ||||||
| Procedure | 6,043 | 76.0 | 4,349 | 77.4 | 1,694 | 72.6 |
| Heart Failure | 420 | 5.3 | 248 | 4.4 | 172 | 7.4 |
| Other Cardiac | 1,254 | 15.8 | 874 | 15.6 | 380 | 16.3 |
| Non-Cardiac | 238 | 3.0 | 149 | 2.7 | 89 | 3.8 |
| EP Operator Training | ||||||
| Board Certified | 6,230 | 78.3 | 4,475 | 79.6 | 1,755 | 75.1 |
| Surgeon | 52 | 0.7 | 32 | 0.6 | 20 | 0.9 |
| Other | 1,389 | 17.5 | 917 | 16.3 | 472 | 20.2 |
| None | 244 | 3.1 | 165 | 2.9 | 79 | 3.4 |
| Unknown | 45 | 0.6 | 35 | 0.6 | 10 | 0.4 |
| Census Region | ||||||
| Midwest Region | 1,995 | 25.1 | 1,465 | 26.1 | 530 | 22.7 |
| Northeast Region | 1,871 | 23.5 | 1,267 | 22.5 | 604 | 25.9 |
| South Region | 2,916 | 36.6 | 2,042 | 36.3 | 874 | 37.4 |
| West Region | 1,178 | 14.8 | 850 | 15.1 | 328 | 14.0 |
| Is a teaching hospital | 5,271 | 66.2 | 3,652 | 64.9 | 1,619 | 69.3 |
| Is a public hospital | 4,150 | 52.1 | 3,051 | 54.3 | 1,099 | 47.1 |
| # of Patient Beds - Median (25th-75th) | 533.0 | (369.00-714.00) | 515.0 | (372.00-710.50) | 554.0 | (366.00-751.00) |
| # of Patient Beds | ||||||
| ≤100 | 132 | 1.7 | 77 | 1.4 | 55 | 2.4 |
| 101-500 | 3,561 | 44.7 | 2,652 | 47.2 | 909 | 38.9 |
| 501+ | 4,267 | 53.6 | 2,895 | 51.5 | 1,372 | 58.7 |
| Community | ||||||
| Rural | 515 | 6.5 | 323 | 5.7 | 192 | 8.2 |
| Suburban | 2,111 | 26.5 | 1,468 | 26.1 | 643 | 27.5 |
| Urban | 5,334 | 67.0 | 3,833 | 68.2 | 1,501 | 64.3 |
| Profit Type | ||||||
| Government | 74 | 0.9 | 56 | 1.0 | 18 | 0.8 |
| Private/Community | 5,320 | 66.8 | 3,796 | 67.5 | 1,524 | 65.2 |
| University | 2,566 | 32.2 | 1,772 | 31.5 | 794 | 34.0 |
| Implant Year | ||||||
| 2012 | 73 | 0.9 | 64 | 1.1 | 9 | 0.4 |
| 2013 | 339 | 4.3 | 272 | 4.8 | 67 | 2.9 |
| 2014 | 2,501 | 31.4 | 1,891 | 33.6 | 610 | 26.1 |
| 2015 | 3,913 | 49.2 | 2,643 | 47.0 | 1,270 | 54.4 |
| 2016 | 1,134 | 14.3 | 754 | 13.4 | 380 | 16.3 |
BMI=body mass index, CABG=coronary artery bypass grafting, BUN=blood urea nitrogen, CHF=congestive heart failure, EF=ejection fraction, EP=Electrophysiology, GFR= glomerular filtration rate ICD=implantable cardioverter defibrillator, INR=international normalized ratio, NYHA=New York Heart Association, MI=myocardial infarction, PCI=percutaneous coronary intervention, SD=standard deviation, VF=ventricular fibrillation, VT=ventricular tachycardia,
Aim 2: Predictors of ISM
We described the characteristics of patients, centers, and physicians associated with sufficient vs. ISM after S-ICD implantation. Between group differences and non-linear continuous variables were handled as per Aim 1. We created patient level multivariable logistic regression models (using GEE to account for clustering within facility) to identify independent predictors of an ISM at VF conversion testing. We considered all variables from Aim 1 after additionally excluding several variables with low prevalence: amyloidosis, Ebsteins anomaly, transposition of the great vessels, common ventricle, and short QT syndrome. Beta coefficients derived from the model were subsequently used to generate a weighted risk score.
We included sensitivity analyses assessing the association between use of amiodarone and sotalol at time of discharge and ISM, given the known impact of these drugs on the defibrillation threshold of transvenous ICDs. These variables were not considered in the main model because the case report form only collects discharge medication and it is possible that these medications could have been started or stopped after VF conversion testing.
Aim 3: The association between VF conversion testing and in-hospital events
In order to determine the risk adjusted association between use of VF conversion testing and in-hospital outcomes, we utilized generalized boosted models (GBM) to calculate inverse probability of treatment weights.8, 9 For each model, GBM fits a piecewise constant model to predict the probability of VF conversion testing. The model consists of many simple regression trees iteratively combined to create an overall piecewise constant function. The GBM models were fitted iteratively until the imbalance between groups was minimized. For our models, we set the maximum number of trees to be 20,000 and restricted interactions to two levels. Balance between groups was assessed using weighted standardized differences with values < 10% being considered sufficiently balanced.10, 11
We calculated weighted average treatment effects for each outcome defined above using weighted logistic regression with the outcome of interest as the dependent variable and VF conversion testing as the independent variable. Comparisons were summarized using odds ratios (ORs) with 95% confidence limits.
Analyses were performed using SAS (Version 9.4, SAS institute, Cary, NC) and R (Version 3.4.0, R Foundation for Statistical Computing, Vienna, Austria).
RESULTS
Predictors of Use of VF conversion Testing
A total of 8,190 patients underwent S-ICD implantation between September 28, 2012, and April 1, 2016. After excluding 60 patients who underwent S-ICD generator replacement, 169 patients who reportedly underwent upper limit of vulnerability testing (which is not possible with the S-ICD), and 1 patient who was implanted outside the United States, a total of 7,960 patients remained for analysis (Figure 1). Of these patients, 5,624 (70.7%) underwent VF conversion testing. The baseline characteristics of patients who did and did not undergo VF conversion testing are depicted in Table 1.
Figure 1.
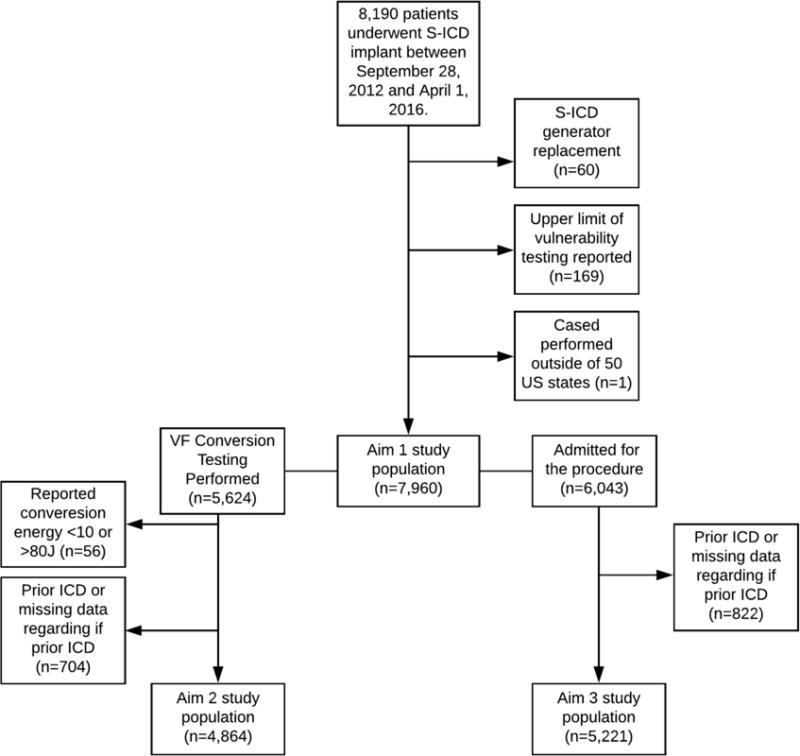
A consort diagram depicting cohort derivation for the 3 study aims. Patients with a history of either S-ICD or transvenous ICD were excluded from the 2nd and 3rd aims.
In logistic regression analyses, deferral of VF conversion testing was independently associated with several patient characteristics (Table 2), including increased body mass index, increased body surface area, severely reduced ejection fraction (<20%), dialysis dependence, warfarin use, and anemia. VF conversion testing was more common in patients with prior coronary artery bypass grafting, hypertrophic cardiomyopathy, and implant at a public hospital.
Table 2.
Multivariable model predicting non-use of VF conversion *
| OR (95% CI)† | p-value | |
|---|---|---|
| Body Mass Index, kg/m2 (per 10 unit increase) | 1.14(1.02-1.27) | 0.0188 |
| Body Surface Area, m2 | ||
| <2.0 | 1.12(0.97-1.30) | 0.1235 |
| ≥2.0 to <2.5 | Reference | |
| ≥2.5 + | 1.60(1.17-2.19) | 0.0033 |
| PR Interval Not Obtainable | 2.90(2.31-3.65) | 0.0000 |
| Preoperative Warfarin | ||
| No | Reference | |
| Yes-not held | 1.29(0.97-1.73) | 0.0838 |
| Yes-held | 1.61(1.33-1.96) | 0.0000 |
| NYHA Class | ||
| I | Reference | |
| II | 0.83(0.67-1.02) | 0.0694 |
| III | 1.02(0.82-1.27) | 0.8357 |
| IV | 1.44(0.89-2.34) | 0.1400 |
| Previous CABG | 0.78(0.65-0.93) | 0.0058 |
| Transposition of the Great Vessels | 3.62(1.32-9.91) | 0.0124 |
| Hypertrophic cardiomyopathy | 0.67(0.48-0.94) | 0.0187 |
| Cardiac Arrest | 0.76(0.63-0.91) | 0.0037 |
| EF, % | ||
| <20 | 1.76(1.24-2.50) | 0.0016 |
| 20-29 | 0.99(0.72-1.36) | 0.9413 |
| 30-39 | 0.84(0.61-1.15) | 0.2730 |
| 40-49 | Reference | |
| ≥50 | 1.10(0.79-1.51) | 0.5820 |
| GFR, ml/min/1.73 m2 | ||
| ≥60 | Reference | |
| 30-59 | 1.09(0.91-1.30) | 0.3621 |
| 15-29 | 0.97(0.68-1.39) | 0.8867 |
| <15 including those on dialysis | 1.38(1.14-1.66) | 0.0008 |
| Hemoglobin, g/dL | ||
| <9 | 2.03(1.49-2.75) | 0.0000 |
| 9-12.9 | 1.28(1.10-1.48) | 0.0010 |
| 13-16.9 | 1.00 | |
| ≥17 | 1.37(0.80-2.34) | 0.2537 |
| Potassium, mEq/L | ||
| <3.5 | 1.33(0.97-1.82) | 0.0804 |
| 3.5-4.4 | 1.00 | |
| ≥4.5 | 1.19(1.03-1.37) | 0.0153 |
| Public (vs. private) hospital | 0.65(0.48-0.88) | 0.0054 |
The area under the curve for the patient level model is 0.619, compared to 0.877 for the generalized linear mixed model. The hospital specific median odds ratio represents the median value of the odds ratio generated by comparing the rates of VF conversion testing in two randomly selected hospitals.7 The hospital specific median odds ratio for use of VF conversion was 5.16, emphasizing that facility preference is a very strong factor in determining use vs. non-use of VF conversion testing.
Odds ratio should be interpreted as the odds of not undergoing VF conversion testing
CABG=coronary artery bypass grafting, EF=ejection fraction, GFR=glomerular filtration rate, NYHA=New York Heart Association
The area under the curve for the generalized linear mixed model that incorporated a facility specific effect was substantially greater than that for the patient level model only accounting for facility clustering (0.877 vs. 0.619) and the hospital specific median odds ratio was 5.16, demonstrating facility preference is a major determinant of VF conversion testing.
Predictors of ISM at DFT Testing
For this analysis, we additionally excluded patients with an improbable VF conversion testing value (n=56) or a prior ICD (or missing data regarding prior ICD)(n=704). Of the resulting 4,864 patients, a total of 336 (6.9%) were found to have an ISM; all patients had successful VF conversion at ≤80J. The baseline characteristics of patients who did and did not have ISM at time of VF conversion testing are depicted in Table 3. Two of the patients with an ISM required a separate procedure (during the index hospitalization) to revise the S-ICD.
Table 3.
Patient and physician characteristics among all S-ICD patients stratified by VF conversion testing result (sufficient vs. insufficient safety margin).
| Total (n=4,864) |
Sufficient (n=4,528) |
Insufficient (n=336) |
||||
|---|---|---|---|---|---|---|
| Mean or absolute number | Proportion or standard deviation | Mean or absolute number | Proportion or standard deviation | Mean or absolute number | Proportion or standard deviation | |
| Age - Mean (SD) | 52.36 | 15.38 | 52.44 | 15.40 | 51.30 | 15.03 |
| Female | 1,476 | 30.35 | 1,391 | 30.72 | 85 | 25.30 |
| Race | ||||||
| White non-Hispanic | 3,009 | 61.86 | 2,787 | 61.55 | 222 | 66.07 |
| Black non-Hispanic | 1,295 | 26.62 | 1,217 | 26.88 | 78 | 23.21 |
| Hispanic | 339 | 6.97 | 318 | 7.02 | 21 | 6.25 |
| Other | 221 | 4.54 | 206 | 4.55 | 15 | 4.46 |
| Insurance Payor (not mutually exclusive) | ||||||
| Private | 2,944 | 60.53 | 2,746 | 60.64 | 198 | 58.93 |
| Medicare | 1,965 | 40.40 | 1,826 | 40.33 | 139 | 41.37 |
| Medicaid | 1,047 | 21.53 | 971 | 21.44 | 76 | 22.62 |
| Other | 225 | 4.63 | 211 | 4.66 | 14 | 4.17 |
| None | 159 | 3.27 | 148 | 3.27 | 11 | 3.27 |
| Height, m - Mean (SD) | 1.73 | 0.11 | 1.73 | 0.11 | 1.75 | 0.12 |
| Weight, kg - Mean (SD) | 88.13 | 22.63 | 87.21 | 22.05 | 100.63 | 26.45 |
| Body Surface Area, m2 - Mean (SD) | 2.01 | 0.27 | 2.00 | 0.26 | 2.14 | 0.29 |
| Body Mass Index, kg/m2 - Mean (SD) | 29.43 | 6.81 | 29.17 | 6.64 | 32.94 | 8.07 |
| QRS Duration, ms - Mean (SD) | 102.86 | 19.43 | 102.68 | 19.53 | 105.30 | 17.93 |
| PR Interval, ms - Mean (SD) | 169.58 | 31.21 | 169.31 | 31.19 | 173.42 | 31.29 |
| Non-Ischemic Dilated Cardiomyopathy | 2,064 | 42.50 | 1,893 | 41.87 | 171 | 50.89 |
| Ischemic HD | 2,069 | 42.54 | 1,930 | 42.62 | 139 | 41.37 |
| Atrial Fibrillation / Flutter | 721 | 14.83 | 659 | 14.56 | 62 | 18.45 |
| Ventricular Tachycardia | 1,227 | 25.24 | 1,147 | 25.35 | 80 | 23.81 |
| Preoperative Warfarin | 645 | 13.27 | 592 | 13.08 | 53 | 15.77 |
| If yes - held | 448 | 69.57 | 413 | 69.88 | 35 | 66.04 |
| If yes - INR | 1.63 | 0.57 | 1.64 | 0.58 | 1.55 | 0.48 |
| NYHA Class | ||||||
| I | 1,255 | 25.94 | 1,190 | 26.43 | 65 | 19.40 |
| II | 2,091 | 43.22 | 1,939 | 43.06 | 152 | 45.37 |
| III | 1,436 | 29.68 | 1,320 | 29.31 | 116 | 34.63 |
| IV | 56 | 1.16 | 54 | 1.20 | 2 | 0.60 |
| Previous Pacemaker | 52 | 1.07 | 45 | 0.99 | 7 | 2.08 |
| Previous PCI | 1,339 | 27.54 | 1,249 | 27.59 | 90 | 26.87 |
| Previous CABG | 764 | 15.73 | 730 | 16.14 | 34 | 10.12 |
| Diabetes | 1,734 | 35.66 | 1,609 | 35.55 | 125 | 37.20 |
| Previous MI | 1,862 | 38.30 | 1,736 | 38.36 | 126 | 37.50 |
| Structural Abnormalities | ||||||
| Amyloidosis | 2 | 0.04 | 2 | 0.04 | 0 | 0.00 |
| Ebsteins anomaly | 3 | 0.06 | 3 | 0.07 | 0 | 0.00 |
| Transposition of the Great Vessels | 10 | 0.21 | 10 | 0.22 | 0 | 0.00 |
| Giant Cell Myocarditis | 1 | 0.02 | 1 | 0.02 | 0 | 0.00 |
| LV non-compaction | 43 | 0.89 | 40 | 0.89 | 3 | 0.90 |
| Tetrology of Fallot | 13 | 0.27 | 12 | 0.27 | 1 | 0.30 |
| Hypertrophic cardiomyopathy | 288 | 5.94 | 273 | 6.05 | 15 | 4.48 |
| ARVD | 31 | 0.64 | 30 | 0.66 | 1 | 0.30 |
| Common Ventricle | 5 | 0.10 | 5 | 0.11 | 0 | 0.00 |
| Syndromes Associated with SCD | ||||||
| Long QT Syndrome | 204 | 4.20 | 189 | 4.18 | 15 | 4.46 |
| Short QT Syndrome | 3 | 0.06 | 3 | 0.07 | 0 | 0.00 |
| Brugada Syndrome | 81 | 1.67 | 79 | 1.75 | 2 | 0.60 |
| Catecholaminergic Polymorphic VT | 8 | 0.16 | 8 | 0.18 | 0 | 0.00 |
| Idiopathic VF | 72 | 1.48 | 65 | 1.44 | 7 | 2.08 |
| Chronic Lung Disease | 740 | 15.23 | 681 | 15.05 | 59 | 17.61 |
| Sleep Apnea | ||||||
| No | 2,854 | 58.74 | 2,668 | 58.99 | 186 | 55.36 |
| Yes | 637 | 13.11 | 574 | 12.69 | 63 | 18.75 |
| Not Assessed | 1,368 | 28.15 | 1,281 | 28.32 | 87 | 25.89 |
| Cerebrovascular Disease | 538 | 11.07 | 502 | 11.09 | 36 | 10.75 |
| Cardiac Arrest | 953 | 19.60 | 890 | 19.66 | 63 | 18.75 |
| Hypertension | 3,380 | 69.52 | 3,135 | 69.25 | 245 | 73.13 |
| Syncope | 792 | 16.28 | 744 | 16.43 | 48 | 14.29 |
| CHF Duration >9 months (among those with HF) | 2,282 | 64.50 | 2,123 | 64.88 | 159 | 59.77 |
| AV Conduction | ||||||
| 2nd degree block | 5 | 0.10 | 5 | 0.11 | 0 | 0.00 |
| 3rd degree block | 7 | 0.14 | 7 | 0.15 | 0 | 0.00 |
| Ventricular Pacing | 28 | 0.58 | 21 | 0.46 | 7 | 2.08 |
| EF % - Mean (SD) | 32.10 | 14.23 | 32.25 | 14.28 | 30.20 | 13.35 |
| GFR, ml/min/1.73 m2 | ||||||
| ≥60 | 3,082 | 64.09 | 2,867 | 64.02 | 215 | 64.95 |
| 30-59 | 723 | 15.03 | 670 | 14.96 | 53 | 16.01 |
| 15-29 | 156 | 3.24 | 147 | 3.28 | 9 | 2.72 |
| <15 including those on dialysis | 848 | 17.63 | 794 | 17.73 | 54 | 16.31 |
| Dialysis | 794 | 16.34 | 744 | 16.45 | 50 | 14.93 |
| BUN – mg/dL Median (25th-75th) | 18.00 | (13.00-28.00) | 18.00 | (13.00-28.00) | 18.00 | (14.00-28.00) |
| Hemoglobin, g/dL - Mean(SD) | 12.81 | 2.12 | 12.81 | 2.10 | 12.83 | 2.31 |
| Potassium, mEq/L - Mean(SD) | 4.24 | 0.48 | 4.23 | 0.47 | 4.25 | 0.50 |
| Sodium, mEq/L - Mean(SD) | 138.53 | 3.16 | 138.53 | 3.17 | 138.52 | 3.03 |
| Systolic BP, mmHg - Mean(SD) | 127.57 | 22.75 | 127.30 | 22.65 | 131.32 | 23.88 |
| Diastolic BP, mmHg - Mean(SD) | 73.80 | 14.09 | 73.68 | 14.06 | 75.36 | 14.35 |
| Reason for Admission | ||||||
| Procedure | 3,725 | 76.65 | 3,464 | 76.57 | 261 | 77.68 |
| Heart Failure | 226 | 4.65 | 212 | 4.69 | 14 | 4.17 |
| Other Cardiac | 790 | 16.26 | 738 | 16.31 | 52 | 15.48 |
| Non-Cardiac | 119 | 2.45 | 110 | 2.43 | 9 | 2.68 |
| EP Operator Training | ||||||
| Board Certified | 3,856 | 79.28 | 3,600 | 79.51 | 256 | 76.19 |
| Surgeon | 23 | 0.47 | 23 | 0.51 | 0 | 0.00 |
| Other | 814 | 16.74 | 748 | 16.52 | 66 | 19.64 |
| None | 137 | 2.82 | 128 | 2.83 | 9 | 2.68 |
| Unknown | 34 | 0.70 | 29 | 0.64 | 5 | 1.49 |
| Implant Year | ||||||
| 2012 | 50 | 1.03 | 45 | 0.99 | 5 | 1.49 |
| 2013 | 209 | 4.30 | 202 | 4.46 | 7 | 2.08 |
| 2014 | 1,630 | 33.51 | 1,520 | 33.57 | 110 | 32.74 |
| 2015 | 2,317 | 47.64 | 2,150 | 47.48 | 167 | 49.70 |
| 2016 | 658 | 13.53 | 611 | 13.49 | 47 | 13.99 |
BMI=body mass index, CABG=coronary artery bypass grafting, BUN=blood urea nitrogen, CHF=congestive heart failure, EP=Electrophysiology, ICD=implantable cardioverter defibrillator, INR=international normalized ratio, NYHA=New York Heart Association, MI=myocardial infarction, PCI=percutaneous coronary intervention, SD=standard deviation, VF=ventricular fibrillation, VT=ventricular tachycardia
ISM was more common among white patients and those with ventricular pacing on the pre-implant ECG, higher pre-implant blood pressure, larger body surface area, higher body mass index, and lower ejection fraction (Table 4). Prior coronary artery bypass grafting was associated with a lower likelihood of ISM. There was no association between ISM and age, sex, NYHA class, history of cardiac arrest, hypertrophic cardiomyopathy, or dialysis status. The area under the curve for the adjusted model was 0.679. A risk score was able to identify patients at low (<5% for scores 0-9), medium (5-10% for scores 10-16), and higher risk (>10% for scores ≥17) for ISM (Figure 2). Supplemental Table 1 details how the risk score was calculated for each patient.
Table 4.
Multivariable model predicting insufficient safety margin (AUC=0.679)
| Estimate | SE | OR (95% CI)* | p-value | overall p-value | |
|---|---|---|---|---|---|
| Intercept | −2.328 | 0.10 | |||
| Race | 0.0150 | ||||
| White non-Hispanic | Ref | 1.0 | |||
| Black non-Hispanic | −0.462 | 0.15 | 0.63(0.47-0.85) | 0.0022 | |
| Hispanic | −0.236 | 0.23 | 0.79(0.50-1.25) | 0.3105 | |
| Other | 0.041 | 0.28 | 1.04(0.60-1.81) | 0.8829 | |
| Body Surface Area, m2 | 0.0064 | ||||
| <2.0 | −0.402 | 0.13 | 0.67(0.52-0.86) | 0.0019 | |
| 2.0 to <2.5 | Ref | 1.0 | |||
| ≥2.5 | 0.239 | 0.20 | 1.27(0.85-1.90) | 0.2432 | |
| Body Mass Index, kg/m2 (OR given for per 10 unit increase) | 0.051 | 0.01 | 1.67(1.40- 1.99) | 0.0000 | |
| Previous CABG | −0.609 | 0.18 | 0.54(0.38-0.78) | 0.0009 | |
| Ventricular Pacing on pre-implantation ECG | 1.679 | 0.44 | 5.36(2.24-12.81) | 0.0002 | |
| EF % (OR given per 10 unit increase) | −0.014 | 0.00 | 0.87(0.79-0.95) | 0.0017 | |
| Systolic BP (OR given per 10 unit increase) | 0.007 | 0.00 | 1.08(1.02-1.13) | 0.0036 |
BP=blood pressure, CABG=coronary artery bypass grafting, EF=ejection fraction, OR = odds ratio
Figure 2.
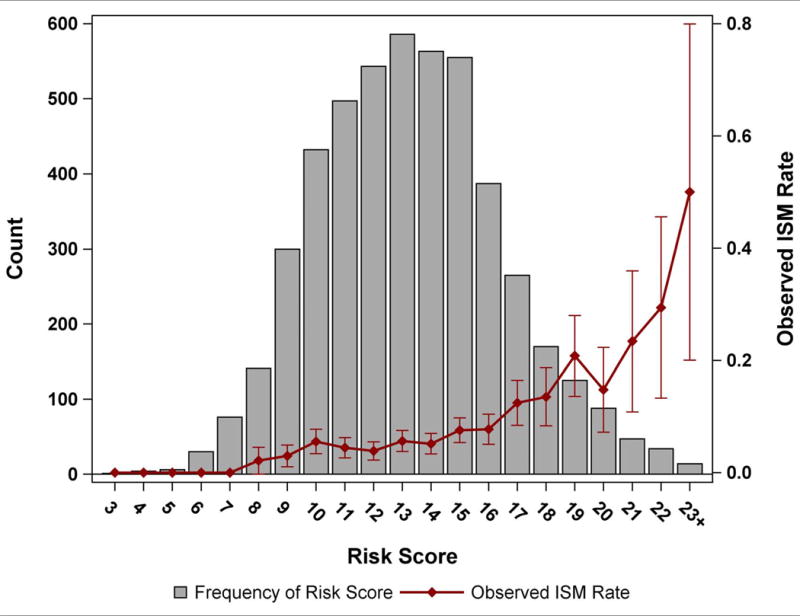
A depiction of the frequency risk scores (Y axis on left) and observed rate of insufficient safety margin (Y axis on right) as a function of the risk score (X axis).
We performed sensitivity analyses to assess the association between discharge amiodarone (n=319) and sotalol (n=31) and an ISM. In a series of adjusted models, we observed no association between either amiodarone (OR 1.36, CI 0.91-2.04, p=0.13) or sotalol (OR 1.57, CI 0.50-4.97, p=0.44) and an ISM.
In-hospital outcomes and use vs. non-use of VF conversion testing
In an inverse probability weighted cohort, the rate of in-hospital complications was overall low, and there was no significant difference among those who did (0.84%) and did not (1.16%) undergo VF conversion testing (OR 0.72, CI 0.47-1.09, p = 0.11; reference group = no VF conversion testing; Table 5). Supplemental Table 2 depicts the study cohort before and after inverse probability weighting. There were no differences in in-hospital death by group. Cardiac arrest was less common among those who underwent VF conversion testing (OR 0.49, CI 0.28-0.87, p=0.02).
Table 5.
Adverse events by VF conversion testing status
| VF Conversion Testing | No VF Converseion Testing | |||
|---|---|---|---|---|
| Outcome | % | % | OR(95%CI) | p-value |
| Any in-hospital complication | 0.84 | 1.16 | 0.72(0.47-1.09) | 0.1124 |
| Death | 0.16 | 0.14 | 1.16(0.40-3.33) | 0.7828 |
| Cardiac Arrest | 0.37 | 0.76 | 0.49(0.28-0.87) | 0.0152 |
| Valve Injury | 0.00 | 0.07 | – | – |
| Hematoma requiring re-operation or transfusion | 0.26 | 0.09 | 3.03(0.96-10.00) | 0.0581 |
| Hemothorax | 0.03 | 0.00 | – | – |
| Infection | 0.05 | 0.00 | – | – |
| Lead Dislodgement | 0.09 | 0.22 | 0.45(0.15-1.33) | 0.1481 |
| Myocardial Infarction | 0.06 | 0.07 | 0.85(0.16-4.54) | 0.8457 |
| TIA or Stroke | 0.02 | 0.07 | 0.37(0.04-3.13) | 0.36 |
| Urgent Cardiac Surgery | 0.02 | 0.00 | – | – |
No instances of cardiac perforation, pericardial tamponade, set screw problem, or pneumotheorax, or occurred in either group. = transient ischemic attack; VF = ventricular fibrillation
DISCUSSION
This study, which represents the largest reported cohort of S-ICD patients, has several notable findings. First, although deferral of VF conversion testing after S-ICD implant is modestly associated with several patient characteristics suggesting the patterns of performing this test are influenced by clinical factors, non-patient factors (e.g. hospital characteristics and preferences) are more strongly associated with performance of VF conversion testing. Second, several patient characteristics, including white race, increased BSA, increased BMI, and depressed EF, were associated with an ISM at the time of VF conversion testing. Age, sex, NYHA class, history of cardiac arrest, hypertrophic cardiomyopathy, and dialysis status were not associated with ISM. Third, VF conversion testing after S-ICD implantation appears safe, as it was not associated with a composite of in-hospital complications including death, but this analysis was limited by the small number of events.
DFT testing was performed routinely after transvenous ICD implant for years in order to ensure an adequate safety margin (usually 10J) between the DFT and the maximum device output. As the maximum device output increased and the defibrillation technology evolved over time, the perceived need to perform DFT testing declined, leading to a pivotal trial that confirmed that routine DFT testing was indeed not necessary for most patients with a primary prevention transvenous ICD.12 On average, the S-ICD has a DFT that is about 3x higher (and somewhat more variable) compared to a transvenous ICD (36.6±19.8J vs. 11.1±8.5J).1 The volume of subcutaneous fat between the defibrillator coil and chest wall,13 as well as position of the coil and pulse generator,1, 13 have been identified as important factors in achieving optimal DFTs. Accordingly, the maximum (and only) programmable output for the S-ICD is 80J, compared to ~35-40J for transvenous ICDs. Although early S-ICD studies suggested very high rates of successful conversion of VF1, 14, 15, there remained a relative paucity of data on rates of successful defibrillation and no data on whether or not it was safe to forgo VF conversion testing after S-ICD implantation, and so the expert consensus statement on ICD programming that was published following the approval of the S-ICD recommended VF conversion testing after S-ICD implantation as a Class I recommendation, based solely on expert consensus.2
Despite a Class I recommendation, the use of VF conversion testing after S-ICD implantation has been declining in the US, from 82.4% to 71.4% between 2012 and 2015.3 The current study sought to determine factors associated with VF conversion testing. We found that non-use of VF conversion testing was more common among patients who may have been at higher perceived risk for VF conversion testing complications (patients with increased BMI/BSA, severely reduced LVEF, dialysis dependence, and oral anticoagulation). The adjusted model that incorporated the site effects was more robust with an area under the curve of 0.877 (vs. 0.619 for the model with patient factors only), demonstrating that site factors appear proportionally more important than patient factors. Given the limits of registry data, we are unable to determine why facility preference is such a strong predictor of use of VF conversion testing, although it is plausible that cumulative experience regarding strategies that address ISM has decreased the perceived need for compulsory testing.
An ISM after S-ICD implantation appears to be uncommon. In our study, 6.9% of patients did not have successful VF conversion at ≤65J although all had successful VF conversion at ≤80J. These results are consistent with those reported from the Evaluation oF FactORs ImpacTing CLinical Outcome and Cost EffectiveneSS of the S-ICD (EFFORTLESS S-ICD) Registry; an early report16 from this registry reported 95% of patients had successful VF conversion at ≤65J and a more contemporary report with approximately twice as many patients reported this rate was 91.6%.17
Although there are several well established predictors of an ISM among transveous ICDs,18 limited data exist for the S-ICD. A recently published report from the S-ICD Post Approval Study (PAS) showed that among the 1,412 patients who underwent conversion testing, 95.6% of first shocks were successful at the final device position.19 Prior transvenous ICD extraction, increased height, and increased BMI were independently associated with first shock failure, while black race was associated with first shock success.19 These findings are concordant with some of our findings that white race and increased BMI were associated with an ISM at the time of VF conversion testing. In contrast to our study, PAS study did not identify a reduced EF (handled as a continuous variable) as a predictor of first shock failure. Based on recent computer modeling emphasizing the impact of subcutaneous fat on DFTs with the S-ICD,13 it is not surprising that increased BMI and BSA were both independent predictors of an ISM in the current analysis. Of note, BSA was not considered in the S-ICD PAS predictive model. In our study, height was collinear with, and less predictive than, BSA and therefore was not in the final model. Notably, BMI and BSA are not usually associated with ISM in transvenous systems.
There are several other notable differences in predictors of ISM among S-ICD vs. transvenous ICD patients. Dialysis dependent chronic kidney disease has been linked to ISM with transvenous ICDs but was not associated with an ISM in our study of S-ICDs; this is clinically relevant because the absence of endovascular leads has been hypothesized to be particularly beneficial among dialysis patients who are at a high risk for intravascular infections and dialysis access complications. Decreased age (<70 years), Hispanic ethnicity, and secondary prevention ICD indication have been associated with ISM among transvenous ICD patients18 but were not associated with ISM after S-ICD implantation. Thus, predictors of ISM vary by device type; these characteristics could be considered when selecting an ICD system or in applying a targeted approach to VF conversion testing.
After inverse probability weighting, VF conversion testing was not associated with a significant increase in the risk of any in-hospital complication reported to the NCDR. These results are consistent with the use of DFT testing in appropriately selected transvenous ICD patients.12 The rate of cardiac arrest was lower among patients who underwent VF conversion testing. Although it is plausible that VF conversion testing resulted in a higher likelihood of successful conversion of spontaneous ventricular tachycardia or fibrillation in the hospital after S-ICD implant, precluding the need for cardiopulmonary resuscitation and external defibrillation, it is more likely that intra-procedural cardiac arrests decreased the likelihood of performing VF conversion testing at the conclusion of the implant. However, these hypotheses are not possible to test as the ICD Registry case report form does not specify whether a peri-procedural cardiac arrest occurred during or after the ICD procedure. These results should be confirmed in an adequately powered prospective randomized trial.
Limitations
This study has several important limitations. This study was observational and retrospective in nature and use of VF conversion testing was not randomized. As with all registry studies, data may be prone to more inaccuracies and underreporting of complications, when compared to randomized trials. However, prior analyses have suggested >90% accuracy for data fields.20 The VF conversion value used for this analysis represents the lowest value during the procedure, which could have been achieved after an ISM led to an in-lab device revision, followed by repeat induction and testing. Thus, the data on rates and predictors of ISM best reflect the final device position. The ICD Registry case report form does not collect data on whether a device revision or reprogramming occurred during the initial procedure, and as such we are unable to report on the use of intraprocedural strategies to mitigate ISM. There were insufficient patients in this study to use separate derivation and validation cohorts when designing a model to predict ISM. The relatively small number of patients on amiodarone or sotalol may have reduced the power to detect an association between use of these drugs and an ISM. We did not have data on several potentially important predictors of an ISM, including electrode and pulse generator location,1, 13 chest wall dimensions, cardiac dimensions,21 and amount of subcutaneous fat below the electrode and pulse generator.13 Although the inverse probability cohort appeared well balanced based on assessment of standardized differences, we cannot rule out the possibility of residual confounding, which would most likely lead to an underestimate of risk associated with VF conversion testing.22 In-hospital complications were relatively infrequent, limiting the statistical power to detect a difference among patients who did and did not undergo VF conversion testing. We did not have longitudinal outcomes which are necessary to determine if VF conversion testing is able improve clinical outcomes by way of improving defibrillation of spontaneous ventricular arrhythmias. Finally, the analysis of in-hospital complications included only patients implanted during an elective hospitalization, potentially limiting generalizability to patients implanted during a hospitalization for another reason (e.g. heart failure exacerbation).
Clinical Implications
This study has several clinically relevant implications. Although facility preference appears to be the dominant factor regarding decision to perform VF conversion testing, several of the patient characteristics associated with non-use of VF conversion testing were also associated with risk for an ISM (e.g., BSA, BMI, and severely reduced LVEF). This suggests that the patients who may be most poised to benefit from VF conversion testing are less likely to undergo the procedure. This could potentially be related to greater perceived risk of performing DFT in these patients. The risk for ISM after S-ICD implant can be predicted with moderate accuracy using several readily available clinical variables. Understanding risk for ISM has the potential to not only lead to a targeted approach to VF conversion testing, but also improve ICD system selection. For example, our study results suggest that, when compared to a transvenous ICD, the S-ICD may be associated with a more favorable safety margin among several patient groups, including dialysis patients, blacks, Hispanics, younger patients, and men. In contrast, the S-ICD, when compared to the transvenous ICD, appears to be associated with a less favorable safety margin among patients with an increased BMI and increased BSA. Although the current study suggests that VF conversion testing may be safe in most patients after S-ICD implant, there are several patient groups that the results should not be generalized to, including patients with a very severely reduced LVEF, unrevascularizated coronary artery disease, or an intra-cardiac thrombus.
CONCLUSION
Although the use of VF conversion testing after S-ICD implantation is associated with several patient characteristics, facility preference appears to have a greater overall influence on use of testing. An ISM is relatively infrequent after S-ICD implantation and is associated with several clinical variables. VF conversion testing was not associated with increased in-hospital complications or death. The results from this study have important implications for ICD system selection (transvenous vs. subcutaneous) and the development of a personalized approach to VF conversion testing.
Supplementary Material
CLINICAL PERSPECTIVE.
What is new?
-
-
This study demonstrated that use versus non-use of VF conversion testing after S-ICD implantation in the US is more related to physician preference than patient characteristics
-
-
This study identified several patient characteristics associated with an insufficient defibrillation safety margin among S-ICD recipients, including increased body mass index, severely decreased ejection fraction, white race, and ventricular pacing on the pre-implantation ECG.
-
-
Use of VF conversion testing after S-ICD implant was not associated with a composite of in-hospital complications or death.
What are the clinical implications?
-
-
An understanding of risk for insufficient defibrillation safety margin after S-ICD implant may be useful for ICD selection (transvenous vs. subcutaneous) and a targeted approach for the use of VF conversion testing.
-
-
VF conversion testing after S-ICD implant does not appear to be associated with excess risk of adverse events in properly selected patients.
Acknowledgments
Partners and Sponsors: ICD Registry™ is an initiative of the American College of Cardiology with partnering support from the Heart Rhythm Society.
Disclaimer: This research was supported by the American College of Cardiology’s NCDR. The views expressed in this manuscript represent those of the author(s), and do not necessarily represent the official views of the NCDR or its associated professional societies identified at CVQuality.ACC.org/NCDR.
Funding Source: This study was funded by the National Cardiovascular Data Registry (NCDR). Dr. Friedman has received funding via the National Institutes of Health T 32 training grant HL069749.
Disclosures: Dr. Curtis owns stock in Medtronic (significant), receives research funding from Boston Scientific (significant), and receives salary support from the American College of Cardiology to provide data analytic services (significant). Dr. Freeman reports serving on an Advisory Board from Janssen Pharmaceuticals (modest). Dr. Friedman has received educational grants from Boston Scientific (modest) and St. Jude (modest), research grants from the National Cardiovascular Data Registry (significant), and is funded by the National Institutes of Health T 32 training grant HL069749 (significant). Dr. Heist is a consultant for Biotronik (modest), Boston Scientific (modest), Pfizer (significant), and Abbott (modest), and has received research grants from Boston Scientific (significant) and Abbott (significant). Dr Russo received research support from Boston Scientific and Medtronic and honoraria or consulting fees from Biotronik, Boston Scientific, Medtronic, and St Jude. Mr. Parzynski receives salary support from the American College of Cardiology to provide data analytic services (moderate).The remaining authors report no disclosures.
References
- 1.Bardy GH, Smith WM, Hood MA, Crozier IG, Melton IC, Jordaens L, Theuns D, Park RE, Wright DJ, Connelly DT, Fynn SP, Murgatroyd FD, Sperzel J, Neuzner J, Spitzer SG, Ardashev AV, Oduro A, Boersma L, Maass AH, Van Gelder IC, Wilde AA, van Dessel PF, Knops RE, Barr CS, Lupo P, Cappato R, Grace AA. An entirely subcutaneous implantable cardioverter-defibrillator. The New England journal of medicine. 2010;363:36–44. doi: 10.1056/NEJMoa0909545. [DOI] [PubMed] [Google Scholar]
- 2.Wilkoff BL, Fauchier L, Stiles MK, Morillo CA, Al-Khatib SM, Almendral J, Aguinaga L, Berger RD, Cuesta A, Daubert JP, Dubner S, Ellenbogen KA, Mark Estes NA, 3rd, Fenelon G, Garcia FC, Gasparini M, Haines DE, Healey JS, Hurtwitz JL, Keegan R, Kolb C, Kuck KH, Marinskis G, Martinelli M, McGuire M, Molina LG, Okumura K, Proclemer A, Russo AM, Singh JP, Swerdlow CD, Teo WS, Uribe W, Viskin S, Wang CC, Zhang S. 2015 HRS/EHRA/APHRS/SOLAECE expert consensus statement on optimal implantable cardioverter-defibrillator programming and testing. Heart rhythm : the official journal of the Heart Rhythm Society. 2016;13:e50–86. doi: 10.1016/j.hrthm.2015.11.018. [DOI] [PubMed] [Google Scholar]
- 3.Friedman DJ, Parzynski CS, Varosy PD, Prutkin JM, Patton KK, Mithani A, Russo AM, Curtis JP, Al-Khatib SM. Trends and In-Hospital Outcomes Associated With Adoption of the Subcutaneous Implantable Cardioverter Defibrillator in the United States. JAMA Cardiol. 2016;1:900–911. doi: 10.1001/jamacardio.2016.2782. [DOI] [PMC free article] [PubMed] [Google Scholar]
- 4.Levey AS, Bosch JP, Lewis JB, Greene T, Rogers N, Roth D. A more accurate method to estimate glomerular filtration rate from serum creatinine: a new prediction equation. Modification of Diet in Renal Disease Study Group. Ann Intern Med. 1999;130:461–470. doi: 10.7326/0003-4819-130-6-199903160-00002. [DOI] [PubMed] [Google Scholar]
- 5.van Buuren S. Multiple imputation of discrete and continuous data by fully conditional specification. Stat Methods Med Res. 2007;16:219–242. doi: 10.1177/0962280206074463. [DOI] [PubMed] [Google Scholar]
- 6.Hosmer DW, Lemeshow S, Sturdivant RX. Applied Logistic Regression. 3rd. John Wiley & Sons; 2013. [Google Scholar]
- 7.Merlo J, Chaix B, Ohlsson H, Beckman A, Johnell K, Hjerpe P, Rastam L, Larsen K. A brief conceptual tutorial of multilevel analysis in social epidemiology: using measures of clustering in multilevel logistic regression to investigate contextual phenomena. J Epidemiol Community Health. 2006;60:290–297. doi: 10.1136/jech.2004.029454. [DOI] [PMC free article] [PubMed] [Google Scholar]
- 8.Lee BK, Lessler J, Stuart EA. Improving propensity score weighting using machine learning. Stat Med. 2010;29:337–346. doi: 10.1002/sim.3782. [DOI] [PMC free article] [PubMed] [Google Scholar]
- 9.McCaffrey DF, Ridgeway G, Morral AR. Propensity score estimation with boosted regression for evaluating causal effects in observational studies. Psychol Methods. 2004;9:403–425. doi: 10.1037/1082-989X.9.4.403. [DOI] [PubMed] [Google Scholar]
- 10.Austin PC. Balance diagnostics for comparing the distribution of baseline covariates between treatment groups in propensity-score matched samples. Stat Med. 2009;28:3083–3107. doi: 10.1002/sim.3697. [DOI] [PMC free article] [PubMed] [Google Scholar]
- 11.Normand ST, Landrum MB, Guadagnoli E, Ayanian JZ, Ryan TJ, Cleary PD, McNeil BJ. Validating recommendations for coronary angiography following acute myocardial infarction in the elderly: a matched analysis using propensity scores. J Clin Epidemiol. 2001;54:387–398. doi: 10.1016/s0895-4356(00)00321-8. [DOI] [PubMed] [Google Scholar]
- 12.Healey JS, Hohnloser SH, Glikson M, Neuzner J, Mabo P, Vinolas X, Kautzner J, O’Hara G, VanErven L, Gadler F, Pogue J, Appl U, Gilkerson J, Pochet T, Stein KM, Merkely B, Chrolavicius S, Meeks B, Foldesi C, Thibault B, Connolly SJ, Shockless IEi Cardioverter defibrillator implantation without induction of ventricular fibrillation: a single-blind, non-inferiority, randomised controlled trial (SIMPLE) Lancet. 2015;385:785–791. doi: 10.1016/S0140-6736(14)61903-6. [DOI] [PubMed] [Google Scholar]
- 13.Heist EK, Belalcazar A, Stahl W, Brouwer TF, Knops RE. Determinants of Subcutaneous Implantable Cardioverter-Defibrillator Efficacy: A Computer Modeling Study. J Am Coll Cardiol EP. 2017;3:405–414. doi: 10.1016/j.jacep.2016.10.016. [DOI] [PubMed] [Google Scholar]
- 14.Weiss R, Knight BP, Gold MR, Leon AR, Herre JM, Hood M, Rashtian M, Kremers M, Crozier I, Lee KL, Smith W, Burke MC. Safety and efficacy of a totally subcutaneous implantable-cardioverter defibrillator. Circulation. 2013;128:944–953. doi: 10.1161/CIRCULATIONAHA.113.003042. [DOI] [PubMed] [Google Scholar]
- 15.Burke MC, Gold MR, Knight BP, Barr CS, Theuns DA, Boersma LV, Knops RE, Weiss R, Leon AR, Herre JM, Husby M, Stein KM, Lambiase PD. Safety and Efficacy of the Totally Subcutaneous Implantable Defibrillator: 2-Year Results From a Pooled Analysis of the IDE Study and EFFORTLESS Registry. Journal of the American College of Cardiology. 2015;65:1605–1615. doi: 10.1016/j.jacc.2015.02.047. [DOI] [PubMed] [Google Scholar]
- 16.Lambiase PD, Barr C, Theuns DA, Knops R, Neuzil P, Johansen JB, Hood M, Pedersen S, Kaab S, Murgatroyd F, Reeve HL, Carter N, Boersma L, Investigators E. Worldwide experience with a totally subcutaneous implantable defibrillator: early results from the EFFORTLESS S-ICD Registry. European heart journal. 2014;35:1657–1665. doi: 10.1093/eurheartj/ehu112. [DOI] [PMC free article] [PubMed] [Google Scholar]
- 17.Boersma L, Barr C, Knops R, Theuns D, Eckardt L, Neuzil P, Scholten M, Hood M, Kuschyk J, Jones P, Duffy E, Husby M, Stein K, Lambiase PD, Group EI Implant and Midterm Outcomes of the Subcutaneous Implantable Cardioverter-Defibrillator Registry: The EFFORTLESS Study. Journal of the American College of Cardiology. 2017;70:830–841. doi: 10.1016/j.jacc.2017.06.040. [DOI] [PubMed] [Google Scholar]
- 18.Hsu JC, Marcus GM, Al-Khatib SM, Wang Y, Curtis JP, Sood N, Parker MW, Kluger J, Lampert R, Russo AM. Predictors of an inadequate defibrillation safety margin at ICD implantation: insights from the National Cardiovascular Data Registry. Journal of the American College of Cardiology. 2014;64:256–264. doi: 10.1016/j.jacc.2014.01.085. [DOI] [PubMed] [Google Scholar]
- 19.Gold MR, Aasbo JD, El-Chami MF, Niebauer M, Herre J, Prutkin JM, Knight BP, Kutalek S, Hsu K, Weiss R, Bass E, Husby M, Stivland TM, Burke MC. Subcutaneous implantable cardioverter-defibrillator Post-Approval Study: Clinical characteristics and perioperative results. Heart rhythm : the official journal of the Heart Rhythm Society. 2017;14:1456–1463. doi: 10.1016/j.hrthm.2017.05.016. [DOI] [PubMed] [Google Scholar]
- 20.Messenger JC, Ho KK, Young CH, Slattery LE, Draoui JC, Curtis JP, Dehmer GJ, Grover FL, Mirro MJ, Reynolds MR, Rokos IC, Spertus JA, Wang TY, Winston SA, Rumsfeld JS, Masoudi FA. The National Cardiovascular Data Registry (NCDR) Data Quality Brief: the NCDR Data Quality Program in 2012. Journal of the American College of Cardiology. 2012;60:1484–1488. doi: 10.1016/j.jacc.2012.07.020. [DOI] [PubMed] [Google Scholar]
- 21.Bonnes JL, Westra SW, Bouwels LH, MJ DEB, Brouwer MA, Smeets JL. Risk Factors for Inadequate Defibrillation Safety Margins Vary With the Underlying Cardiac Disease: Implications for Selective Testing Strategies. J Cardiovasc Electrophysiol. 2016;27:587–593. doi: 10.1111/jce.12940. [DOI] [PubMed] [Google Scholar]
- 22.Russo AM, Wang Y, Al-Khatib SM, Curtis JP, Lampert R. Patient, physician, and procedural factors influencing the use of defibrillation testing during initial implantable cardioverter defibrillator insertion: findings from the NCDR(R) Pacing Clin Electrophysiol. 2013;36:1522–1531. doi: 10.1111/pace.12248. [DOI] [PubMed] [Google Scholar]
Associated Data
This section collects any data citations, data availability statements, or supplementary materials included in this article.