

Abstract
Murine norovirus is genetically similar to human norovirus, and offers both an efficient in vitro cell culture system and animal model by which to investigate the molecular basis of replication. Here, we present a detailed global view of host alterations to cellular pathways that occur during the progression of a norovirus infection. This was accomplished for both mus musculus BALB/C-derived RAW264.7 (RAW) cells, an immortalized cell line widely used in in vitro replication studies, and primary bone marrow-derived macrophages (BMDM), representing a permissive in vivo target cell in the host. Murine norovirus replicated in both cell types, although detected genome copies were approximately one log lower in BMDM compared to RAW cells. RAW and BMDM cells shared an IRF3/7-based IFN response that occurred early in infection. In RAW264.7 cells, transcriptional upregulation and INF-β expression were not coupled, in that a significant delay in the detection of secreted INF-β was observed. In contrast, primary BMDM showed an early upregulation of transcripts and immediate release of INF-β that might account for lower virus yield. Differences in the transcriptional pathway responses included a marked decrease in expression of key genes in the cell cycle and lipid pathways in RAW264.7 cells compared to that of BMDM. Our comparative analysis indicates the existence of varying host responses to virus infection in populations of permissive cells. Awareness of these differences at the gene level will be important in the application of a given permissive culture system to the study of norovirus immunity, pathogenesis, and drug development.
Introduction
Noroviruses (NoV) are a major cause of gastroenteritis and diarrhea(1). Infection occurs following exposure to virus from person-to-person contact or consumption of contaminated food and water(2). After a short incubation period of 12-48 h, there is a rapid onset of vomiting and/or diarrhea, which frequently resolves after 1-3 days. Transmission commonly occurs in communal settings such as daycare centers, nursing homes, cruise ships, schools, and families(3). Foodborne outbreaks have increased with modern globalization and trade(4). The NoV disease burden is distributed similarly among countries, however, mortality is primarily among the young and old and in countries with inadequate healthcare access. The overall impact of NoV in terms of economic costs and disease burden drives the need for an effective vaccine(5).
Although most NoV infections are self-limiting, immunocompromised individuals can develop a chronic infection characterized by persistent diarrhea lasting months to years, complicating their treatment and recovery from an underlying condition(6). Diagnostic techniques such as high throughput multi-pathogen screening arrays have improved the ability to detect NoV in immunocompromised patients(7, 8). Accumulating data support the need for antivirals in this population and a comprehensive vaccine program to limit transmissibility in the general population.
Noroviruses are single-stranded, positive-sense RNA viruses of the family Caliciviridae. The 7.5 kb genome contains 3 open reading frames (ORF) encoding the nonstructural proteins in ORF1, the major capsid protein VP1 in ORF2 and the minor capsid protein VP2 in ORF3. Murine norovirus has an additional ORF4 that encodes the nonstructural protein VF1(9). The six nonstructural proteins (NS1-NS7) of ORF1 are released from a large polyprotein by the virus-encoded protease into functional precursor and mature forms during translation(10). The virion is non-enveloped and the genome is packaged within an icosahedral capsid containing 180 copies of the major structural protein VP1. The functions of certain nonstructural proteins such as the replicative enzymes protease (NS6) and polymerase (NS7) are established, but knowledge of the interactions of these and other viral proteins with the host cell during replication is limited.
The genus Norovirus is divided into six major genogroups, three of which (GI, GII, and GIV) contain human pathogens(11). A robust model for the genus utilizes a member of genogroup GV, murine norovirus (MNV), because it replicates efficiently in mice and in cell culture(12). Viruses can be propagated and quantified by plaque assay for both low and high multiplicity of infection (MOI) experiments(13). The MNV system has yielded important insight into norovirus infection and the host response. The involvement of IFN signaling and response pathways, innate and adaptive immunity, cell death, and autophagy have all been described (reviewed in(14)). Additionally, MNV entry mechanisms and lipid requirements(15-17), host translational modification(18), and cell cycle alterations(19) have been explored. Despite these advancements, the specific host factors exploited during NoV infection and replication are not well defined. Therapeutics and vaccine development for the human pathogens may benefit from a comprehensive understanding of MNV infection.
RNA-sequencing (RNA-seq) is a powerful tool utilizing next-generation sequencing (NGS) to determine and quantify an organism's total functional RNA population, known as the transcriptome. First applied to determine the transcribed genes of a prostate cancer cell-line(20) and Arabidopsis(21), it has since been employed to analyze the host transcriptional response to infectious pathogens including Salmonella typhimurium, Hepatitis E, B, and C, and influenza virus(22-25). Here, we use RNA-seq to define the cellular response to infection by MNV. We employed the continuous RAW264.7 (RAW) cell line, the in vitro model employed by most published studies on MNV, and primary bone-marrow derived macrophages (BMDM), representing target cells in the host. The global and differential change in transcription was defined at the gene and pathway level, and comparative analyses identified both similarities and differences in the transcriptomic response of the two cell types to norovirus infection. An immediate global IFN-based transcriptional response was shared, but IFN expression was delayed in RAW264.7 cells.
Cell cycle and lipid homeostasis pathways, highly altered in RAW264.7 cells, were not identified as significant in the transcriptional response of primary BMDM cells. Our data demonstrate that certain transcriptional responses to norovirus infection can vary between immortalized and primary cells, providing important context to the design and interpretation of mechanistic studies in permissive cells.
Materials and Methods
Cell culture and infection
The RAW264.7 (RAW) cell line was obtained from ATCC (Manassas, VA) and cultured between passage 1 and 6 at 5.5E4 cells/cm2 every other day. Cells were maintained in Dulbecco's modified Eagle's medium (DMEM) supplemented with sodium pyruvate (1 mM), HEPES (10 mM), penicillin (250 units/ml), streptomycin (250 g/ml) (Life Technologies, Waltham, MA) and 10% heat-inactivated fetal bovine serum (HyClone, Logan, UT). Murine norovirus strain MNV-1.CW1P3 (MNV in this manuscript), was propagated as previously described(13). Bone marrow-derived macrophages (BMDM) were acquired as live cells from Cell Biologics (Chicago, IL) and prepared from pathogen free BALB/C tibias and femurs (> 95% CD11b+ by flow cytometry). BMDM were seeded on plates treated with 1% cold fish gelatin and allowed to acclimate overnight before use the next day.
Cells were seeded for infection at 1.5E6 cells per well in a 6 well plate (Corning, Corning, NY) the day before the infection. For infection, viral stock titered by plaque assay(13) at 4.7E7 infectious units/mL, was diluted in cell culture media to provide a multiplicity of infection (MOI) of 10 for 1E6 cells. RAW264.7 cells were infected with either diluted MNV-1 or DMEM (mock infection control) at 3-min intervals to allow time 0 sample processing and maintenance of exact time intervals between infection and sample collection. Samples for RAW cells were collected at time 0, 8, 14, and 20 h post infection (p.i.) and time 0 and 20 h for mock infection. An expanded time course for BMDM cells collected samples at times 0, 4, 8, 14, 20, and 26 h post infection (p.i.) and times 0 and 26 h for mock infection. Three independent wells were collected for each time point for infected cells and two independent wells for mock infection samples. After infection, cells were incubated at 37°C, and collected at each time point at the appropriate time and as described below.
RNA extraction and quality control
RAW cells were harvested in a defined order by aspirating media from the 6-well dish and directly lysing cells by addition of 1 mL Trizol (Life technologies, Calsbad, CA). Lysed cells were immediately frozen at -80 °C. Samples were extracted in the same order as harvest order. Cell lysates were thawed and half the sample was subjected to RNA extraction. Samples were brought up to 1000 μL by addition of Trizol and then combined with 200 μL 1-bromo-3-chloropropane (Sigma-Alrich, St. Louis, MO). Samples were mixed using Genie vortex mixer for 15 s and centrifuged at 16,000 × g for 15 min at 4 °C. Aqueous phase was removed and passed through a Qiagen QiaShredder column to fragment any remaining gDNA in the sample. To each sample, an equal volume of Qiagen RNeasy RLT buffer with 1% β-mercaptoethanol and 70% ethanol was added and RNAs were extracted using the Qiagen AllPrep DNA/RNA mini kit system as described by manufacturer (Qiagen, Valencia, CA) including on-column Dnase I treatment. All sample processing was performed with amplicon free pipets and reagents in an amplicon free area to avoid contamination. RNA purity was determined by spectrophotometry. RNA integrity was analyzed using Agilent 2100 Bioanalyzer and calculated as an RNA integrity number (RIN) (Agilent Technologies, Santa Clara, CA).
Illumina library preparation and RNA-sequencing
RNA-seq library prep was accomplished with 200 ng (RAW) or 100 ng (BMDM) RNA isolated as described above. Total RNA libraries were prepared using the TruSeq Stranded Total RNA kit with Ribo-Zero Gold rRNA depletion (Illumina Inc., San Diego, CA). The final library constructs were validated on Agilent DNA1000 chips. The libraries were quantified by qPCR using the Kapa Quant Kit for Illumina sequencing (Kapa Biosystems, Wilmington, MA) and normalized to 2.0 nM PCR products for sequencing. These samples were pooled and clustered on an Illumina HiSeq 2500 using On-Board Cluster Generation. An 11 pM quantity of template was used as the input for a paired end 2×100 bp (RAW) or 2 × 75 bp (BMDM) Illumina HiSeq 2500 RAPID sequencing run (Illumina Inc., San Diego, CA). RAW cell final cluster density for the two lanes averaged 880 K/mm2 with 92% of clusters passing filter. Final output was ∼300 M reads with a Q score of 30 or higher. BMDM average cluster density was 724 k/mm2 resulting in 126.5 M reads passing filter per lane. The indexing distribution ranged from 3.67 – 5.65 % of the reads. The second round of sequencing was prepared by denaturing and diluting the same 2 nM pool of libraries to a 12 pM stock for clustering to the flow cell. On-board cluster generation and paired-end sequencing was completed on the HiSeq 2500 (Ilumina, Inc, San Diego, CA) using a TruSeq Rapid PE Cluster Kit and TruSeq Rapid SBS Kits (Illumina, Inc, San Diego, CA) for 2 × 75 bp sequencing. The average cluster density was 790 k/mm2 resulting in 137 M reads passing filter per lane.
Transcriptome mapping and bioinformatics
Libraries were run as described above, which produced an average of 18.5 million reads (RAW) or 24 million reads (BMDM) per sample. Reads were trimmed to remove adapter sequence and filtered to remove low quality sequence using the FASTX-Toolkit (Hannon Lab, Cold Spring Harbor Labs). Remaining reads were mapped to the mouse genome assembly mm10 and the mouse norovirus genome (AY228235.2) (https://www.ncbi.nlm.nih.gov/nuccore/AY228235.2) using Tophat2(26) for the RAW cells and Hisat2(27) for the BMDM. Reads mapping to genes were counted using htseq-count(28). Differential expression analysis was performed with the Bioconductor package DESeq2 using the time 0 infection, MNV0 as the comparator for all other samples(29). Pearson dissimilarity with complete linkage gene clustering analysis was performed using the Partek Genomic Suite (Partek Incorporated, St. Louis MO). The data discussed in this publication have been deposited in NCBI's Gene Expression Omnibus and are accessible through GEO SuperSeries GSE111663 (https://www.ncbi.nlm.nih.gov/geo/query/acc.cgi?acc=GSE111663) comprising subseries GSE96586 for the RAW cell dataset and GSE111642 for the BMDM dataset.
RT-q PCR validation of RNA-seq expression data
Briefly, 9 genes were selected for expression validation analysis with their RNA-seq data by RT-q PCR in addition to constitutively-expressed reference genes for normalization. Three constitutively expressed transcripts were selected based on normalized transcript expression level and function from the top 100 lowest coefficient of variation (CV) genes within the RNA-seq data. Amplification efficiency was determined in a dualplex reaction for all gene/reference gene pairs. PCR probe combinations with the highest efficiency were selected for expression validation. The gene trmt6 was chosen as the reference for all genes with the exception of Ifnb1, which was paired with the gene lars. SuperScript® VILO™ cDNA synthesis kit (Invitrogen, Carlsbad, CA) was used to generate cDNA from the test samples according to the manufacturer's protocol. Most of the available RNA (90%) was vacuum-centrifuged to 14 μL. cDNA synthesis reactions of all 16 samples were run for 2 h at 42°C to increase cDNA yields. Resulting cDNAs were purified according to QIAquick 96-well protocol (Qiagen, Valencia, CA) with a modified centrifugation protocol(30). q-PCR reactions were carried out in a 20 μL reaction volume containing 1× Invitrogen Express q-PCR SuperMix with premixed ROX reference dye (Invitrogen, Carlsbad, CA) along with 1× forward, reverse, and fluorescent TaqMan probe from IDT (Coralville, IA). The mix was incubated at 50 °C for 2 min, 95 °C for 2 min, 45 cycles of 95 °C for 15 s and 60 °C for 1 min in Applied Biosystems 7900HT instrument (Invitrogen). Both normalized data sets were then correlated using Prism v6.0 using non-parametric Spearman Rank analysis. Nine validation genes were correlated with Ref-seq data (Table S1). All detectable validation genes showed significant correlation (>0.5, P<0.05) with the RNA-seq data.
MNV quantitative PCR
MNV genome copy was determined using Ag-Path-ID 1 Step RT-QPCR Master Mix (Thermo Fisher Scientific, Waltham, MA) and ORF1 specific forward primer 5′-GGCTACGGCTGGACATGTCT, reverse primer 5′-GCGTCAGGCCTATCCTCCTT, and 6-FAM-BHQ1 labeled probe 5′CTATCTTCCGCCGTTACCCCCATCTG (LGC Biosearch Technologies, Pataluma, CA). The QPCR reaction conditions were prepared following manufacturer's recommendation and run in triplicate on the Applied Biosystems 7900 HT instrument. RTS/Genomics used 100 nucleotide synthetic DNA encompassing ORF1 PCR amplicon (5′-TCTGATCCGTGGCTACGGCTGGACATGTCTGATAAGGCTATCTTCCGCCGTTACCCCCATCTGCGGCCTAAGGAGGATAGGCCTGACGCGCCCTCCCATG) from Biosearch Technologies (Petaluma, CA) was used for the viral copy standard. Viral copy number was calculated using the standard curve method according to the manufacturer's protocol (Life Technologies, Carlsbad, CA).
Microscopy
To visualize the expression of viral antigen, RAW and BMDM cells were seeded at a density of 5E5 cells cm-2 on (poly)-d-lysine treated glass coverslips in a 24-well plate and grown overnight. Cells were then infected at a multiplicity of infection of 5 or mock-infected with media. At 0, 4, 8, 14, 20, or 26 h p.i. infection was stopped by a brief wash with PBS-Tween (0.05% Tween 20, Affymetrix, Cleveland, OH) by aspiration and fixation with 4% paraformaldehyde (Electron Microscopy Sciences, Hatfield, PA) for 15 minutes. Cells were permeablized by treatment with 0.4% Triton X-100 (Sigma, St. Louis, MO) in PBS. Cells were then blocked > 12 hours, 4°C, with 2% BSA (Fraction V, MP Biomedical, Solon, OH). Nuclei were visualized by staining with Hoescht 33342 (Invitrogen, Eugene, OR) at a concentration of 1 μg/ mL with the primary antibody. Primary antibody was a rabbit polyclonal against the MNV nonstructural protein precursor NS6/7(31) (1:150) in PBS-Tween with 2% goat serum. Binding of MNV-specific antibodies was visualized with an Alexa 597-labeled goat anti-rabbit secondary antibody (1:175 1% BSA). Solutions were aspirated and cells were washed with a 0.05% Tween 20 in PBS solution three times between each step. Coverslips were mounted to slides using ProLong Gold (ThermoFisher Scientific, Waltham, MA), allowed to dry, and sealed. Prepared slides were observed by fluorescence microscopy using excitation/ emission channels for Hoescht and Alexa 597. Mock cells were grown for 26 h and processed as described above (not shown).
Image Analysis
Slides prepared as described above were imaged on a Celigo Image Cytometer (Nexcelom Bioscience, Lawrence, MA) using the blue and red channels for nuclei and NS6/7 (ProPol) detection, respectively. Acquisition and gating parameters were adjusted using a 0 h p.i. sample to accurately count cell nuclei and remove background detection of events in the red channel over a determinate surface area. All slides were subsequently scanned and analyzed by these same parameters. Nuclei that colocalized with NS6/7 were counted as infected with remaining cells labeled as not infected.
Gene ontology analysis
Gene ontology analysis was used to determine involvement of cellular systems and processes among genes with an FDR ≤ 0.05 and a ≥ 2-fold change in mapped reads either between the end-point mock and infected samples (Figure 1) or between time points (Figure 2). Each set of genes meeting these criteria data were analyzed through the use of IPA(32) (QIAGEN Inc., https://www.qiagenbioinformatics.com/products/ingenuity-pathway-analysis) with current build (Jan 2018). DAVID was additionally used for analysis of the same gene sets and by functional annotation clustering with the default settings(33, 34)
Figure 1.
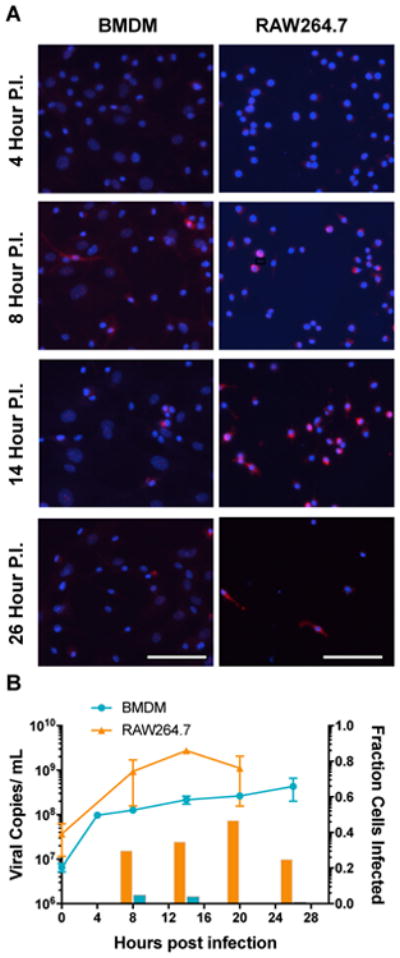
A quantitative analysis of MNV infection kinetics in BMDM and RAW cells. A time course of MNV infection spanning 0 to 26 h was conducted and observed by fluorescence microscopy detection of cell nuclei (Blue) and viral antigen (ProPol, Red) for both BMDM and RAW cells. Antigen expression and cytopathic effect is shown at 4, 8, 14, and 26 hours post-infection). Scale bar (50 μM) (A). The detected viral genomes for BMDM (blue) and RAW (orange) cells at each time point employed for the RNA-Seq analysis are shown with error bars representing the standard deviation of three biological replicates and two PCR technical repeats. The corresponding percentage of cells infected in the monolayer at each time point was calculated by image analysis as described in Materials and Methods (B).
Figure 2.
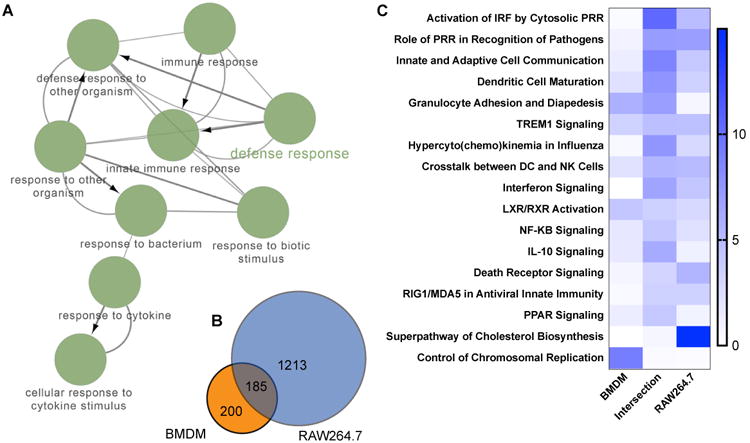
A global view of the cellular response in both primary BMDM and RAW cell infection induced by murine norovirus infection. Genes with a ≥ 2-fold change between mock and MNV infection for RAW cells (20 h p.i), BMDM (26 h p.i.), and the genes shared between them (Intersection) were analyzed for gene enrichment in cellular pathways. Cytoscape and ClueGo were used to make a network map of cellular processes (GO BP and REACTOME) (A) for the 185 genes shared by both cell types (B). A quantitative Venn diagram of the three datasets is shown in B. A comparative gene enrichment analysis for the statistically significant genes, differentially expressed by both RAW264.7 and primary BMDM late in infection by IPA, is shown in C. The IPA analysis is represented by the top 15 shared pathways for shared genes, ranked by reciprocal p-value and the corresponding comparative analysis for the genes not shared. The most significant are at the top.
Functional gene ontology and grouping was performed on the Cytoscape (3.6.0)(35) plugin ClueGo (2.5) and visualized using the linked Cytoscape plugin CluePedia (1.5)(36, 37). A functional analysis was completed using gene ontology Biological Process (BP) (01.24.2018) and REACTOME Pathway (01.24.2018) ontologies using a two-sided hypergeometric test with a Bonferroni step down correction. Genes employed in the ClueGo analysis are those with ≥ 2-fold change between infected and mock infected end points and shared between both BMDM and RAW cells. The functional network displays pathways with p<0.00001 and associated with 30≥ genes.
IFN-associated gene analysis
Analysis of IFN associated genes within the subset of genes increased or decreased in their expression more than 2-fold was accomplished through the resource Interferome (v2.01) www.interferome.org (38). The analysis was completed on genes differential from the previous time point, or the difference between the infected and mock-treated end points, with a fold change of >2-fold and submitted for searches using the following criteria: species Mus musculus, sample type normal, fold-change 2.0, all IFN types, any treatment type. IFNβ expression was determined as soluble expressed protein from the cell culture supernatant by ELISA. BMDM or RAW cells were seeded in 24-well plates at a density of 3E5/well. Wells were either mock infected or infected identical to RNA sample preparations for 3 biological replicates. The cell culture supernatant was removed at 0, 4, 8, 14, 20, or 26 h post infection (p.i.) and immediately stored at -80°C. Soluble IFNβ was assayed by the Verikine Mouse Interferon Beta ELISA Kit (PBL Assay Science, Piscataway, NJ). ELISA was performed according to the manufacturers protocol. The microtiter plate was read on a Synergy Neo (Biotek, Winooski, VT) and data fit to a four point parameter curve using Prism v7 (GraphPad, La Jolla, CA).
Results
Host transcriptome profiling during MNV infection via RNA-sequencing
Design of the RNA-seq experiment incorporated several elements to improve sample quality and limit systematic error in sample collection and processing(39). To achieve the most accurate representation of MNV infection, without the confounding transcription profiles of bystander cells or nonsynchronous infection we infected cells with MNV at an MOI of 5. The recognized in vitro replication model RAW264.7 cells, or the natural replication host BMDM(13) were plated at 1E6 cells per well of a 6-well plate. Samples were grouped on plates by collection time point to minimize handling. To determine the time interval and frequency of sample collection employed in the study, MNV replication kinetics and expression of the viral nonstructural proteins were analyzed. The replication of the viral genome was detected by qRT-PCR for both primary BMDM and RAW264.7 cells over the indicated time course post infection (p.i.) (Figure 1). We analyzed the extent and efficiency of infection within these two cell types by detection of the number of cells positive for NS6/7 viral antigen by immunofluorescence image analysis (Figure 1A). MNV NS6/7 expression was first detected at 8 hours p.i. in both RAW and BMDM cells, however, the percentage of infected cells was significantly different at 30% and 5%, respectively. The percentage of infected BMDM effectively peaked at 8 hr p.i. with 4% infected at 14 hr p.i. and dropping below 1% by 20 hr p.i., although detectable genome copies levels remained high. RAW cells continued to show an increase in the percentage of infected cells with 35% and 47% detected at 14 and 20 hr p.i. Past 20 hr p.i., the total number of cells present and the percentage of infected RAW cells decreased with a visible cytopathic effect. Additionally, the replication kinetics for BMDM cells demonstrated a rapid increase in viral genomes at 4 hours and that consistently remained approximately one log lower than RAW264.7 cells over the time period examined (Figure 1B).
A time course was conducted for transcriptomic profiling in each cell line to monitor the progression of replication reflected in the growth curve (Figure 1B). RAW264.7 cell samples were collected at time points 0, 8, 14, and 20 h p.i. The BMDM time course was expanded to include additional time points at 4 and 26 hr p.i. Each time point for infection was assayed in triplicate and two mock control infections were performed at time 0 and the final time point in duplicate. RNA quality after Trizol extraction was determined by Bioanalyzer (Agilent, Santa Clara, CA) with RIN numbers ≥ 8.9 which are indicative of high quality for statistically significant differential transcript expression analysis(40). Ultraviolet-visible spectroscopy indicated yields and 260/280 nm ratios sufficient for NGS library preparation. RNA was depleted of rRNA for transcript enrichment and the libraries synthesized for a 2×100 bp (RAW) or 2× 75 bp (BMDM) paired-end run. The libraries were quantified by capillary electrophoresis and normalized based on size and quantitative PCR to achieve the working concentration. Libraries were sequenced on an Illumina HiSeq 2500 instrument and yielded 125-150 million reads per lane, for a total of approximately 18.5 (RAW) or 24 (BMDM) million reads per sample with a Q score of 30 or higher. Raw reads were trimmed, filtered, and mapped to the mouse genome (mm10) with the remaining reads aligned to the MNV genome (AY228235.2). The aligned reads were counted and analyzed for differential expression. Figure S1 and S2 demonstrates the high degree of correlation among replicate samples for RAW and BMDM cells, respectively. Further validation of the RNA-seq data for the RAW cells was undertaken by quantitative PCR (q-PCR) of 9 key genes involved in apoptotic, IFN signaling, and cholesterol pathways. The results of this analysis correlated closely with the RNA-seq data (Spearman coefficient > 0.50, p ≤ 0.05) (Table S1).
MNV infection stimulates an immune response in both RAW and BMDM cells
MNV infection initiated a genome-wide alteration of the host transcriptional profile for both cell types. Genes that showed a greater than 2-fold change with an FDR ≥ 0.05 between the mock infected and infected cells at 20 hr p.i. or 26 hr p.i., for RAW and BMDM cells respectively, were selected for analysis by IPA and ClueGo and the results summarized in Figure 2. The genes shared between the two cell types were analyzed by ClueGO and Cluepedia and the functionally grouped annotation network shown in Figure 2A. The node labels represent networks GO biological process or REACTOME pathways with greater than 30 genes and a (p < 1E-5) for network clarity. The degree of connection of the pathways are represented in the edges with thicker edges representing greater connection and arrow heads showing relationships between nodes. The three datasets used in this analysis are represented by the quantitative Venn diagram in Figure 2B. The total number of genes meeting the significance criteria is much greater for RAW cells (1398) than for BMDM (385). Thus, the percentage of genes shared by both cell types was a higher percentage of the total for BMDM (48%) than RAW (13%) cells. Three gene sets were analyzed in total, including both the significant genes from RAW and BMDM cells, in addition to the set of genes common to these two sets (intersection). The enrichment of genes in specific pathways is ranked by p-value. A heatmap of the most significant cell specific and shared pathways are ranked by the significance (-log10 (p value)) of the intersection gene set and shown in Figure 2C. Overall, there is a high degree of similarity among pathways demonstrating gene enrichment in both cell types. The intersection dataset is highly enriched in immune response genes for pathogen control and activation of the IFN pathway. These include cellular pathways controlling the activation of IRF by cytosolic PRR (RIG-I family, p=3.2E-11), the role of PRR in the recognition of pathogens (p=7.2E-8), and innate and adaptive cell communication (p=1.9E-9). Genes unique to the BMDM data were largely depleted of enrichment in the shared pathways, with exceptions to this including granulocyte adhesion and diapedesis (p=2.0E-6) and genes of the LXR/RXR activation pathway (p=5.6E-5). There were also pathways strongly represented by one cell type, but not within the other cell type or the shared genes. These were the superpathway of cholesterol synthesis for RAW cells (p=1.0E-15) and the control of chromosomal replication for BMDM (6.3E-10). The network (Figure 2A), representing the 185 shared genes is symbolic of the shared immune response, clearly evident in the pathway enrichment analysis (Figure 2C).
An analysis of the differential response across the time points assayed was also conducted. Here, genes that showed a ≥ 2-fold change between two sequential times (e.g. 8 and 14 hr p.i.) with an FDR ≤ 0.05 were analyzed for pathway gene enrichment by IPA. Figure 3 shows the pathways in common (A) and dissimilar (B) between BMDM and RAW cells. The heatmap represents the significance (-log10 (p value)), ranked by the 0 to 4 hr p.i. dataset of BMDM, with higher numbers representing more significant gene enrichment. A representative selection of the top pathways shared by both BMDM and RAW cells (Figure 3A) recapitulates the shared immune response of the two cell types. Many of the pathways shared in common are most represented at earlier time points. The Th1 and Th2 activation (p=1.3E-7) and agranulocyte adhesion and diapedesis (p=2.0E-7) pathways are more represented in BMDM whereas TREM1 signaling (2.6E-10) is represented greater in RAW cells. There is also an overall extension of the immune response in RAW cells into the 8 to 14 hr p.i. time interval that is strongly decreased in BMDM by this time.
Figure 3.

A gene enrichment analysis of the differential gene response during the time course of infection with MNV within RAW and BMDM cells. The genes with a ≥2-fold change between time points were analyzed for pathway enrichment by IPA. The 5 (BMDM) or 8 (RAW) most significant pathways for each interval were compared and the matching (A) or dissimilar (B) pathways shown as a heat map. The pathways are ranked by reciprocal p-value in the left-most or earliest data in time course with most significant at top.
Figure 3B illustrates the pathways that were most significantly represented by either BMDM or RAW cell types, but not both, for the genes with ≥ 2-fold change between each time interval and ranked by significance (-log10 p value) for the earliest time point. The most represented for BMDM were granulocyte adhesion and diapedesis (p=4.5E-11), dendritic cell maturation (p=2.3E-7), T helper cell differentiation (p=1.4E-6), and virus entry via endocytic pathways (p=4.6E-6). RAW cells demonstrated more significant enrichment of pathways relating to immune function, particularly IFN and cell death pathways. The top pathways were PRR recognition of pathogens (p=6.5E-14), interferon signaling (p=4.8E-10), IRF activation by cytosolic PRRs (p=5.8E-10), and retinoic acid apoptotic signaling (p=1.1E-6).
The global modification of transcript change was examined for both BMDM and RAW cells and is shown in Figure 4A and 4B, respectively. The fold change between 0 and 14 hr p.i. and the corresponding adjust p-value were calculated and plotted as an xy (volcano) plot for genes with an FDR ≥ 0.05. Globally, RAW cells had a greater fold value increase across all detected genes, whereas BMDM demonstrated a greater decrease in gene expression at 14 hr p.i. Many of the genes with the greatest fold increase in RAW cells were IFN or immunity associated while genes with the greatest decrease were lipid homeostasis associated. BMDM exhibited down regulation of the immune response by 14 hr p.i., also evident from Figure 3A and 3B. Many of the genes markedly increased in BMDM were part of the cellular stress response.
Figure 4.

A representation of the global change in gene expression for BMDM (A) and RAW (B) cells. The fold change (Log2) was plotted against the adjusted p-value (FDR) for all genes with and FDR ≥ 0.5. Some outlier genes of interest are labeled.
MNV is recognized by the cytosolic RNA sensor MDA5, a member of the RIG-I family of pattern recognition receptors(41). The genes of this pathway and down-stream targets are IFN-response genes and increases in transcription were observed, however, the magnitude of increase was significantly different for BMDM and RAW cells. Given the indications from pathway and global gene expression analysis that both cell types shared a strong IFN-associated gene expression profile to viral infection, we directly examined the type I IFN response by the measurement of secreted IFN-β (Figure 5). We observed a classic, bell shaped expression profile for the BMDM, with expression detectable as early as 4 hr p.i. (Figure 5A). This corresponded well with the detected enrichment of genes associated with IFN pathways and early immune response observed in Figures 2 and 3. In contrast, the RAW cells showed an unexpected delay in IFN-β secretion (Figure 5B) that was decoupled from the observed transcriptional response. The significant increase at 20 hr p.i. in RAW cells was past the peak of IFN gene response, viral genome replication, and viral gene expression. We examined whether the transcriptional IFN response was markedly different between the two cell types. Figure 5C summarizes an analysis of IFN-association for genes with a >2-fold increase for each indicated time interval. Early in infection to 8 hr p.i., there appeared to be no difference in the percentage of IFN-associated genes between either cell type. Later in infection, the percentage of IFN-associated genes with a >2-fold change in expression was greater for BMDM, although RAW cells had a greater total gene count by a factor of 3-4 (Figure 2C and 5D). Figure 5D demonstrates an analysis of the percentage of IFN genes represented by the Venn diagram of Figure 2C. The genes shared between both cell types were approximately 90% of IFN-associated genes while the genes unique to each cell type were approximately 65% of the total gene count. BMDM cells clearly share an IFN-mediated immune response to MNV infection, however BMDM respond competently as measured by secreted IFN-β while RAW cells have a significant delay in their functional response. This observation may explain, in part, the overall higher replication levels of MNV in RAW cells.
Figure 5.

An analysis of the IFN response of both primary BMDM and RAW cells during MNV infection. IFN-β secreted into the cell culture supernatant during infection was determined by ELISA and shown for BMDM and RAW cells in A and B respectively. The percentage of differential genes with a ≥ 2-fold change reported as ISGs (Interferome v2.0) for both BMDM and RAW cells is shown in C. The differential genes between mock and infected cells represented by the Venn diagram in Fig. 1 were analyzed for % ISG and plotted for both % ISG and # of genes and shown in D. * p ≤ 0.01 for 0 and 26 h, ** p ≤ 0.001 for all other time points.
Specific genes and gene families of the immune response were examined across the two cell types (Figure 6). Gene fold changes, both differential across the indicated time interval and the global transcriptional differential for RAW (20 hr p.i. vs. 20 hr mock) and BMDM (26hr p.i. vs. 26 hr mock) (mock difference) demonstrate the substantial difference in magnitude between the two cell types. For genes in the relevant cytosolic RIG-I-like receptor family, genes such as RIG-I (18-fold/ 1.8 fold, RAW/BMDM) and Ifih1 (30-fold/ 1.8-fold), responses differed by greater than a factor of 10. The transcription factor IRF3 was not transcriptionally altered for either cell type whereas IRF7 (39-fold/ 2.3-fold) was increased. We also observed increase of the IRF7-induced Sp100 family of transcriptional modifiers including Sp100 (16-fold/ 1.5-fold), Sp110 (11-fold/ 1.5-fold), and Sp140 (11-fold/ 1.8-fold) as well as their downstream target genes Ifnβ (147-fold/ 6-fold), Stat1 (13.5-fold/ 1.6-fold), and the antiviral gene ISG15 (171-fold/ 3.8-fold). Transcriptionally, IFN-associated genes represented the majority of genes with altered expression and of those shared by both RAW and BMDM cells, albeit with notable differences in fold-level responses among certain genes
Figure 6.

The differential gene expression for genes for BMDM and RAW264.7 cells for selected genes involved in immunity. The differential expression (log2) between 0 and 4hr, 4 and 8hr, 8 and 14hr, 14 and 20hr, 20 and 26hr, and the global change between mock and infected cells at 26hr PI for BMDM cells. Also, the differential expression (log2) between 0 and 8hr, 8 and 14hr, 14 and 20hr, and the global change between mock and infected cells at 20hr PI for RAW264.7 cells. Samples represent 3 biological repeats (infected) or 2 biological repeats (mock).
We also detected modest transcriptional up-regulation of genes involved in NF-κB activation and pro-survival, across both cell types such as Traf1 (2.6-fold/ 2.4-fold), Traf2 (1.2-fold/ 1.3-fold), Birc2 (1.5-fold/ 1.2-fold), Birc3 (1.8-fold/ 2.2-fold), and cflar (1.5-fold/ 1.3-fold). Of note, we also observed limited transcriptional increase of apoptotic caspases with initiator casp8 (2.3-fold/ 1.2-fold) and effector casp7 (1.3-fold/ 1.2-fold) up-regulated in both and casp9 1.3-fold for BMDM. More broadly increased were the inflammatory processing cytokines casp1 (2.8-fold/ 1.2-fold) and casp4 (3.2-fold/ 1.9-fold). Also, increased during infection were the TNF receptors tnfrsf1a (3.1-fold/ 1.3-fold) and tnfrsf1b (1.3-fold/ 1.3-fold) in addition to TNF-α (5.9-fold/ 2-fold). A notable differential response was observed for BMDM with a brief increase of CCL5 expression between 8 to 14 hr p.i.(1.7-fold), and an increase of cxcl2 between 0 to 4 hr p.i.(2.4-fold) with a sustained low increase over the infection. Also, only BMDM showed an increase in expression of the inflammasome deactivator NLRP10(42). However, neither cell line showed similar transcriptional changes detected for other genes of the non canonical inflammasome suggested by the increase in transcript of caspase 4. The enrichment of genes described above, associated with TNF-α receptor activation detected by IPA (Figure 2), suggests a relevance for NF-κB activation. However, as observed in the IFN response, RAW cells showed a greater increase of TNF-α pathway effectors, such as cytokines, compared to BMDM.
Cellular pathway analysis demonstrates activation of immunological programs and perturbations of host lipid metabolism and cell cycle
The differential expression of genes in the KEGG pathway for steroid biosynthesis is illustrated in Figure 7. In RAW cells, most genes in this pathway were transcriptionally down-regulated during infection. In contrast, BMDM showed an earlier transcriptional up regulation for most of these genes with a decrease detected in the endpoint between the infected and mock infected samples. The sterol response element transcription factors Srebf1 and Srebf2, and some of their lipid-related target genes such as Dhcr24, Hmgcs1, Lss, Fasn, and Scd2 showed a consistent decrease in expression over time in RAW cells. In contrast, these genes demonstrated an increase in expression early in infection in BMDM, with an eventual decrease over time. There were similarities, however, with effects on the expression of cholesterol transporters Scarb1 and Abca1 in addition to the retinoic acid receptors rara, rarb, and rarg. The antiviral genes soat2 and cyp27b1 both showed similar increases in transcript levels early in infection for both cell types, although Soat2 was the only highly upregulated gene in BMDM in the mock difference column.
Figure 7.

The differential gene expression for genes for BMDM and RAW264.7 cells for selected genes involved in lipid homeostasis. The differential expression (log2) between 0 and 4hr, 4 and 8hr, 8 and 14hr, 14 and 20hr, 20 and 26hr, and the global change between mock and infected cells at 26hr PI for BMDM cells. Samples represent 3 biological repeats (infected) or 2 biological repeats (mock). Also, the differential expression (log2) between 0 and 8hr, 8 and 14hr, 14 and 20hr, and the global change between mock and infected cells at 20hr PI for RAW264.7 cells.
We examined gene enrichment in pathways relating to cell cycle by IPA. The calculated total change between each time point was calculated and used for analysis. The predicated activation of cell cycle pathways found enriched in genes by IPA is shown in Figure 8 with red indicating an increase in activation of that pathway and blue a decrease. A previous report analyzed the alteration of cell cycle during infection with MNV late in infectionin RAW cells (19) and our RAW cell data corroborates well with this established dataset. There is less agreement between the RAW and BMDM datasets. There are some pathways, such as cyclins and cell cycle regulation, cell cycle regulation by BTG proteins, and “Interphase” that appear to have similar transcriptional alteration over the period of infection. BMDM and RAW cells are both predicted to have an activation 8 to 14 hr p.i. for “G1/S Checkpoint Regulation”. They also share a decrease to increase of activation at 8 to 14 hr p.i to 14 to 20 hr p.i respectively for “Cell Cycle Regulation by BTG Proteins”. There were many differences, however, noted at both the gene and pathway level. The pathway “cell cycle checkpoint control” by CHK proteins is predicted to be consistently activated in BMDM but deactivated in RAW cells. An increase was detected for many P53 target genes in RAW cells, including cell cycle arrest inducers 14-3-3σ (Sfn), Gadd45a, Gadd45b, Gadd45g, cdkn1a and the associated transcriptional factor Ep300 that is not evident in BMDM with the exception of a detected increase in cdkn1a. We also did not observe the same increase in P53 apoptotic gene targets including Bbc3, Pmaip1, Fas, and the TNF receptors 1 and 2 (Figure 6). Decrease of the E2F family transcriptional down-regulators E2F7 and E2F8 and the expected increase of E2F7/8 repressed E2F1 was observed in both cell types. RAW cells also showed an increase in the E2F7/8 repressed CDC6 and Ccne1 genes but this was not mirrored in BMDM. Overall our data from RAW cell data are consistent with previous reports suggesting cell cycle arrest(19) but this was not clear-cut for BMDM. Strong indications for P53 signaling in RAW cells was not evident in BMDM.
Figure 8.

The differential gene expression for genes for BMDM and RAW264.7 cells for selected pathways of the cell cycle. The significant genes (FDR ≥ 0.05) with a change greater than 2-fold were analyzed by IPA for well represented pathways in the cell cycle. The heat map represents the Z-score calculated with higher values representing predicted activation and lower values representing predicted suppression. The differential expression (log2) between 0 and 4hr, 4 and 8hr, 8 and 14hr, 14 and 20hr, and 20 and 26hr PI was analyzed for BMDM cells. Also, the differential expression (log2) between 0 and 8hr, 8 and 14hr, and 14 and 20hr was analyzed for RAW264.7 cells.
Discussion
RAW264.7 cells are a widely-used cell culture system in MNV replication studies. They demonstrate a high efficiency of infection, produce high pfu viral stocks, and are easy to manipulate for experiments(13, 43). RNA-seq analysis of the transcribed murine host genome during MNV infection was conducted in RAW cells to produce a reference dataset for comparison and verification of efforts towards norovirus therapeutic design. We have additionally completed a companion RNA-Seq analysis in primary bone marrow-derived macrophages to more closely represent natural target cells in the host. A comparison of infected cell populations in the two types of cultures showed that the proportion of infected cells varied, even when infected with the same high multiplicity of infection of MNV. Unlike certain other caliciviruses(44), it has been difficult to generate stable tagged recombinant noroviruses for enrichment of norovirus positive cells, and uninfected bystander cells may have masked small transcriptional changes. Single cell transcriptomic techniques for norovirus studies will undoubtedly improve the resolution of subtle changes in mixed cell populations and in variably infected cell cultures such as those analyzed here.
RNA-Seq, as applied in this study, accurately measures the abundance of mRNA transcripts in a population of cells, and a recent study verified its correlation with overall protein expression(45). RNA-seq coupled with ribosome profiling during human cytomegalovirus (HMCV) infection found that ribosome footprinting represented changes in transcript abundance, consistent with the importance of transcriptional regulation of cellular processes(46). Additionally, a recent analysis concluded that approximately 84% of cell protein variance could be correlated with mRNA quantity(47) further supporting the use of cellular transcript analysis for estimating change in and differential analysis of cellular proteins. However, there are many additional levels of cellular control including but not limited to physical properties of the transcript, regulatory proteins and small RNAs, ribosomal occupancy and density, protein degradation, and post translational modification(48). There are also direct and indirect effects of viral infection on cellular protein populations such as proteolytic cleavage of cellular proteins by the viral protease(49) or ER stress.
Modification of host translation is common among viruses at the protein or post-translational level. MNV has been shown to modify host translation via phosphorylation of eiF4E by MKNK1 (50) and requires a range of host proteins for translation(18). MNV also employs a cap-independent VPg-associated translational mechanism via direct binding to eIF4G(51). The translation of IFN genes is suppressed in RAW cells in addition to the continuous BV2 cell line(49). This correlates well with our observed delay in IFN-β expression, however, BMDM clearly do not have this same suppression and delay.
Previous RNA-seq analysis of RAW and BV-2 microglial macrophages cells treated with lipopolysaccharide (LPS) provides a comparison to evaluate the transcriptional changes observed in this work(52) LPS is recognized by TLR4 and initiates a signaling cascade through TRIF(53) analogous to that initiated through the receptor MDA5, the pattern recognition receptor for MNV replicative intermediates(41). LPS induced an increase in transcription of genes enriched for GO BP terms “immune system process”, “response to stimulus”, and “death”(52). MNV infection increased gene enrichment in similar pathways, although death receptor signaling was only evident in RAW cells in our study. More relevant to our dataset is a recently published differential analysis of MNV infection in RAW cells(54). This work reported global cellular transcriptional changes during MNV infection that were in agreement with our data, particularly with respect to the significant increase in IFN and immune related genes. We observed striking overall similarities in the pathways predicted as enriched among up- or downregulated genes, although certain individual genes might behave differently in the two analyses. For example, the proteasome subunit gene transcripts psme2 and psmb9 increased over time in our RAW and BMDM datasets, but did not in the previous study. Importantly, two independently-derived RAW cell transcriptomic profiles showed similar major differences from that of the BMDM cells reported here.
MNV was originally described as a virus lethal to STAT1-/- mice deficient in the IFN response(12). The IFN response is critical for resolution of infection for both acute and chronic strains of MNV. Adaptive immunity can help to control viral replication, and in some cases is not absolutely required(55, 56). Our data showed that IFN-stimulated genes are the predominantly up-regulated genes during a norovirus infection. However, MNV competently replicates when a RAW cell monolayer is infected at high MOI, despite the acute cellular response. Here, we quantify the differences in infection efficiency between RAW264.7 cells and BMDM to be greater than 10-fold. Although there is an even greater transcriptional IFN response in RAW cells than BMDM, RAW cells do not express IFN-β until the infection is in the final hours. This late expression agrees with a previous report of RAW cell IFN-β expression during infection(57). This contrasts with BMDM which exhibit a similar, albeit lower in magnitude, transcriptional IFN-response and IFN-β expression within the first few hours of infection. This rapid IFN expression is likely responsible for the restricted detection of the virus proteins in no more than 5% of the cell population and limited spread of infection. Our data suggest that the RAW cell innate immune response may be deficient compared to that of BMDM, although the mechanism is not clear. Further understanding of these pathways may give insight into the optimization of efficient in vitro replication systems for human norovirus.
An interesting finding is the similarity detected in both RAW and BMDM between MNV and influenza virus infection. The shared gene enrichment in the pathway analysis of MNV suggests a pathological cytokine and chemokine response that has been linked with the symptoms and pathology associated with influenza. This response is high at the 4 to 8 hr p.i. time interval for both cell types but peaks in RAW cells significantly later at 8 to 14 hr p.i. RNA viruses, like influenza virus, can induce potent IFN antiviral responses which are strain and host cell specific(58). A highly relevant transcriptomic profiling of influenza infection in PBMC macrophages correlated an acute type I IFN response with an influenza virus strain with higher pathogenicity(59). Recent reports suggest that acute MNV infection is capable of IFN-response evasion(49), and particularly in the persistent murine norovirus strain MNV-S99(60). Although, as discussed above, these findings should be carefully evaluated with respect to the host cell used for analysis. It has also been shown there is a lack of IFN response to in vitro transfected or reverse genetics replicated GII.3 human norovirus in 293FT cells(61), however, this finding will need further validation as the biologically relevant target cells for human norovirus replication are determined. The degree of immune response is associated with exacerbation of disease severity in influenza and norovirus challenge studies(58, 62), and transcriptomic profiling should provide important insight into possible mechanisms.
The immunological activation of RAW cells by MNV infection occurs through the retinoic acid-inducible gene I (RIG-I)-like gene melanoma differentiation-associated protein 5 (MDA5) via double stranded RNA replication intermediates(41). MDA5 signaling induces activation of IRF3 and here we observed transcriptional signs of both IRF3 and IRF7 activation. IRF7, displaying greater transcriptional activation than IRF3, was recently shown to induce the gene Map3k8, part of the TNF-α pathway. Map3κ8 modifies transcriptional programs by promoting IRF3:IRF7 heterodimers, leading to an enhanced antiviral response including increase of the SP100 transcriptional enhancers(63). Our data suggests that signaling with IRF3 involves a transcriptional increase of genes Isg15, Ifit1, Ifit2, and Ifit3 (64) and the IRF7 pathway, particularly evident in the RAW cell data, but also detectable in BMDM and consistent with previous reports(65).
It is clear in our studies and many others that RAW cells are an efficient in vitro host for MNV replication. We observed a transcriptional increase in genes encoding proteins associated with down-regulation of immune response, but a delay in production of type I IFN. ISG15, has previously been shown to be an IFN induced antiviral inhibitor of MNV entry or uncoating using knockout mice for ISG15 or the conjugating enzyme UbE1L(66). ISG15 is conjugated to proteins, much like the ubiquitin modifier, with conjugation accomplished by UbE1L and cleavage by the protease Usp18(67). In RAW cells, ISG15 and Usp18 transcript were significantly increased with little or no increase in BMDM. Usp18 limit IFN response via ISG15 proteolytic activity, but additionally through interaction with the IFN α receptor IFNAR2(68). Usp18 expression in dendritic cells and macrophages is also thought to promote and limit viral replication to these cells types and increase antigen presentation for promotion of adaptive immunity(69). The abundance and potential suppression of IFN response by USP18 in the cells type most frequently used for MNV replication, warrants further investigation.
Examination of genes involved in lipid transport and metabolism showed an overall transcriptional decrease with an increase of ISG lipid-associated proteins in RAW cells. The increase in ISG lipid-associated genes also occurs in BMDM, however the decrease in lipid homeostasis genes is not clear. Decreased Abca1 has been correlated with the reduction of retinoic acid receptors (rar) via Irak1, and we observed transcriptional regulation of these genes, both up and down, that track well with each other in both cell types(70). The IFN inducible transmembrane proteins 1-3 (IFIT1-3) are a family of membrane-modifying enzymes with antiviral properties. We also observed an increase of Ifitm3, a protein demonstrated to inhibit Influenza A, Dengue, and West Nile viruses(71). Of interest, the HCV core protein 3a was shown to increase Soat2 transcript, cell associated cholesterol ester lipid droplets, and ceramide synthesis gene Sptlc2(72). We observed a significant Soat2 transcript increase in both cell types. Cholesterol esters were also recently shown to be significant among mass spectrometry molecular species detected in MNV lipid raft-associated replication complexes(73). Further work will be required to determine how norovirus replication functions within the context of the host response and whether host immune-driven lipid processes hinder or aid viral replication.
Macrophages exposed to high levels of cholesterol and certain oxysterols demonstrate transcriptional downregulation of several genes, including the transcription factors Srebf1 and Srebf2 and their lipid-related target genes such as Dhcr24 and Scd2(74). Cholesterol has previously been reported to have a role in norovirus biology. MNV entry has been shown to be cholesterol-dependent(16, 17). Also using a Norwalk virus (HuNoV) replicon system, transcriptional modification of several cholesterol pathway genes was shown(75). Data from the replicon system and RAW cell data reported here are similar in trend and magnitude. Significant alteration of genes in the “Superpathway of Cholesterol Biosynthesis” was significantly detected in only RAW cells. Given that two immortalized cell lines show these modifications, but not primary BMDM, lipid synthesis regulation is a favorable host response for norovirus replication and suggests another possible approach to the optimization of in vitro cell culture systems.
Cell cycle modification is an adventitious strategy of viruses to promote replication and transmission(76). MNV has also been shown to induce a G0/G1 cell cycle arrest which is at least partially dependent on the viral protein VPg in RAW cells(19, 77). Davies et al. reports Affymetrix data from 18 h p.i. which demonstrates transcriptional up-regulation of G1 phase cyclins and decrease of S and G2 phase cyclins and associated genes(19). We observed decrease of the E2F family of transcriptional regulators E2F7 and E2F8 and the expected concomitant decrease of their associated genes E2F1, CDC6, and Ccne1. These two genes are restricted in expression to late G1/S phase and regulate cell cycle progression and their target S phase genes(78, 79). Overall, at the transcriptional level, the G1 and G1/S phase associated transcripts are increased, and the S and G2 phase cyclins are decreased, consistent with arrest at G1 or the G1/S checkpoint. This data correlates well with previous studies in RAW cells(19). However, we did not detect the same gene level or pathway responses in BMDM and this suggests that cell cycle studies in RAW or BV2 cell lines should be carefully validated in differentiated primary macrophages.
RAW264.7 cells are quantitatively shown here to be an efficient in vitro host for replication while primary bone marrow-derived macrophages demonstrate lower relative numbers of infected cells in a monolayer. There are significant difference between the cellular programming of these two cell types. The host transcriptomes presented here establish a detailed overview of norovirus infection that should provide a foundation for both basic and translational studies of MNV and other noroviruses.
Supplementary Material
Acknowledgments
This work was supported by the Division of Intramural Research of the NIAID, NIH
References
- 1.Lopman BA, Steele D, Kirkwood CD, Parashar UD. The Vast and Varied Global Burden of Norovirus: Prospects for Prevention and Control. PLoS Med. 2016;13:e1001999. doi: 10.1371/journal.pmed.1001999. [DOI] [PMC free article] [PubMed] [Google Scholar]
- 2.Aron JH. Noroviruses: The Perfect Human Pathogens? The Journal of Infectious Diseases. 2012;205:1622–1624. doi: 10.1093/infdis/jis251. [DOI] [PMC free article] [PubMed] [Google Scholar]
- 3.Division of Viral Diseases, N. C. f. I., C. f. D. C. Respiratory Diseases, and Prevention. Updated norovirus outbreak management and disease prevention guidelines. MMWR. Recommendations and reports : Morbidity and mortality weekly report. Recommendations and reports / Centers for Disease Control. 2011;60:1–18. [PubMed] [Google Scholar]
- 4.Miranda de G, Janko van B, Marion PGK. Human norovirus transmission and evolution in a changing world. Nature Reviews Microbiology. 2016;14:421–433. doi: 10.1038/nrmicro.2016.48. [DOI] [PubMed] [Google Scholar]
- 5.Pires SM, Fischer-Walker CL, Lanata CF, Devleesschauwer B, Hall AJ, Kirk MD, Duarte AS, Black RE, Angulo FJ. Aetiology-Specific Estimates of the Global and Regional Incidence and Mortality of Diarrhoeal Diseases Commonly Transmitted through Food. PLoS One. 2015;10:e0142927. doi: 10.1371/journal.pone.0142927. [DOI] [PMC free article] [PubMed] [Google Scholar]
- 6.Karin B, Kim YG. Norovirus Gastroenteritis in Immunocompromised Patients. The New England Journal of Medicine. 2012;367:2126–2132. doi: 10.1056/NEJMra1207742. [DOI] [PMC free article] [PubMed] [Google Scholar]
- 7.Sarah NB, Amy L, Kimberle C, Paul DF, Matthew JB, Matthew KJ, Margarita R, Kristen JK, Kevin MB. Multicenter Evaluation of the BioFire FilmArray Gastrointestinal Panel for Etiologic Diagnosis of Infectious Gastroenteritis. Journal of Clinical Microbiology. 2015;53:915–925. doi: 10.1128/JCM.02674-14. [DOI] [PMC free article] [PubMed] [Google Scholar]
- 8.Nicholson MR, Van Horn GT, Tang YW, Vinje J, Payne DC, Edwards KM, Chappell JD. Using Multiplex Molecular Testing to Determine the Etiology of Acute Gastroenteritis in Children. J Pediatr. 2016;176:50–56 e52. doi: 10.1016/j.jpeds.2016.05.068. [DOI] [PMC free article] [PubMed] [Google Scholar]
- 9.McFadden N, Bailey D, Carrara G, Benson A, Chaudhry Y, Shortland A, Heeney J, Yarovinsky F, Simmonds P, Macdonald A, Goodfellow I. Norovirus regulation of the innate immune response and apoptosis occurs via the product of the alternative open reading frame 4. PLoS Pathog. 2011;7:e1002413. doi: 10.1371/journal.ppat.1002413. [DOI] [PMC free article] [PubMed] [Google Scholar]
- 10.Stanislav VS, Gaël B, Kyeong OKC, Victor GP, Larissa BT, Christiane EW, Stephanie MK, Herbert WV, Kim YG. Cleavage Map and Proteolytic Processing of the Murine Norovirus Nonstructural Polyprotein in Infected Cells. Journal of Virology. 2006;80:7816–7831. doi: 10.1128/JVI.00532-06. [DOI] [PMC free article] [PubMed] [Google Scholar]
- 11.Annelies K, Everardo V, Harry V, Jan V, Peter AW, Grant H, Kim G, Vito M, Kazuhiko K, Marion K. Proposal for a unified norovirus nomenclature and genotyping. Archives of virology. 2013;158:2059–2068. doi: 10.1007/s00705-013-1708-5. [DOI] [PMC free article] [PubMed] [Google Scholar]
- 12.Stephanie MK, Christiane EW, Margarita L, John D, Herbert WV. STAT1-Dependent Innate Immunity to a Norwalk-Like Virus. Science. 2003;299:1575–1578. doi: 10.1126/science.1077905. [DOI] [PubMed] [Google Scholar]
- 13.Wobus CE, Karst SM, Thackray LB, Chang KO, Sosnovtsev SV, Belliot G, Krug A, Mackenzie JM, Green KY, Virgin HW. Replication of Norovirus in cell culture reveals a tropism for dendritic cells and macrophages. PLoS Biol. 2004;2:e432. doi: 10.1371/journal.pbio.0020432. [DOI] [PMC free article] [PubMed] [Google Scholar]
- 14.Sarvestani ST, Cotton B, Fritzlar S, O'Donnell TB, Mackenzie JM. Norovirus Infection: Replication, Manipulation of Host, and Interaction with the Host Immune Response. Journal of interferon & cytokine research : the official journal of the International Society for Interferon and Cytokine Research. 2016;36:215–225. doi: 10.1089/jir.2015.0124. [DOI] [PubMed] [Google Scholar]
- 15.Vinay S, Yunjeong K, Kyeong-Ok C. Ceramide formation mediated by acid sphingomyelinase facilitates endosomal escape of caliciviruses. Virology. 2015;483:218–228. doi: 10.1016/j.virol.2015.04.022. [DOI] [PMC free article] [PubMed] [Google Scholar]
- 16.Jeffrey WP, Christiane EW. Endocytosis of Murine Norovirus 1 into Murine Macrophages Is Dependent on Dynamin II and Cholesterol. Journal of Virology. 2010;84:6163–6176. doi: 10.1128/JVI.00331-10. [DOI] [PMC free article] [PubMed] [Google Scholar]
- 17.Gerondopoulos A, Jackson T, Monaghan P, Doyle N, Roberts LO. Murine norovirus-1 cell entry is mediated through a non-clathrin-, non-caveolae-, dynamin- and cholesterol-dependent pathway. Journal of General Virology. 2010;91:1428–1438. doi: 10.1099/vir.0.016717-0. [DOI] [PubMed] [Google Scholar]
- 18.Elizabeth R, Nicolas L. Translational Control during Calicivirus Infection. Viruses. 2016;8:104. doi: 10.3390/v8040104. [DOI] [PMC free article] [PubMed] [Google Scholar]
- 19.Davies C, Brown CM, Westphal D, Ward JM, Ward VK. Murine norovirus replication induces G0/G1 cell cycle arrest in asynchronously growing cells. Journal of virology. 2015;89:6057–6066. doi: 10.1128/JVI.03673-14. [DOI] [PMC free article] [PubMed] [Google Scholar]
- 20.Matthew NB, René LW, Martin H, Tammy R, Thomas Z, Anne G, Allen D, Malachi G, Matthew H, Vincent M, Elaine RM, Marianne DS, Asim SS, Marco AM, Steven JMJ. Analysis of the prostate cancer cell line LNCaP transcriptome using a sequencing-by-synthesis approach. BMC Genomics. 2006;7:1–11. doi: 10.1186/1471-2164-7-246. [DOI] [PMC free article] [PubMed] [Google Scholar]
- 21.Ryan L, Ronan COM, Julian TF, Brian DG, Charles CB, Millar AH, Joseph RE. Highly Integrated Single-Base Resolution Maps of the Epigenome in Arabidopsis. Cell. 2008;133:523–536. doi: 10.1016/j.cell.2008.03.029. [DOI] [PMC free article] [PubMed] [Google Scholar]
- 22.Jun H, Zwier G, Ludi K, Robert R, Wilfred van I, Kim K, Bi-Sheng L, Harry J, Robert JdK, Andre B. Analysis of the transcriptome and immune function of monocytes during IFNα-based therapy in chronic HCV revealed induction of TLR7 responsiveness. Antiviral Research. 2014;109:116–124. doi: 10.1016/j.antiviral.2014.06.020. [DOI] [PubMed] [Google Scholar]
- 23.Srikumar S, Kroger C, Hebrard M, Colgan A, Owen SV, Sivasankaran SK, Cameron AD, Hokamp K, Hinton JC. RNA-seq Brings New Insights to the Intra-Macrophage Transcriptome of Salmonella Typhimurium. PLoS Pathog. 2015;11:e1005262. doi: 10.1371/journal.ppat.1005262. [DOI] [PMC free article] [PubMed] [Google Scholar]
- 24.Jagya N, Varma SP, Thakral D, Joshi P, Durgapal H, Panda SK. RNA-seq based transcriptome analysis of hepatitis E virus (HEV) and hepatitis B virus (HBV) replicon transfected Huh-7 cells. PLoS One. 2014;9:e87835. doi: 10.1371/journal.pone.0087835. [DOI] [PMC free article] [PubMed] [Google Scholar]
- 25.Vijayakumar P, Mishra A, Ranaware PB, Kolte AP, Kulkarni DD, Burt DW, Raut AA. Analysis of the crow lung transcriptome in response to infection with highly pathogenic H5N1 avian influenza virus. Gene. 2015;559:77–85. doi: 10.1016/j.gene.2015.01.016. [DOI] [PubMed] [Google Scholar]
- 26.Daehwan K, Geo P, Cole T, Harold P, Ryan K, Steven LS. TopHat2: accurate alignment of transcriptomes in the presence of insertions, deletions and gene fusions. Genome Biology. 2013;14:1–13. doi: 10.1186/gb-2013-14-4-r36. [DOI] [PMC free article] [PubMed] [Google Scholar]
- 27.Kim D, Langmead B, Salzberg SL. HISAT: a fast spliced aligner with low memory requirements. Nat Methods. 2015;12:357–360. doi: 10.1038/nmeth.3317. [DOI] [PMC free article] [PubMed] [Google Scholar]
- 28.Simon A, Paul Theodor P, Wolfgang H. HTSeq—a Python framework to work with high-throughput sequencing data. Bioinformatics. 2015;31:166–169. doi: 10.1093/bioinformatics/btu638. [DOI] [PMC free article] [PubMed] [Google Scholar]
- 29.Michael IL, Wolfgang H, Simon A. Moderated estimation of fold change and dispersion for RNA-seq data with DESeq2. Genome Biology. 2014;15:550. doi: 10.1186/s13059-014-0550-8. [DOI] [PMC free article] [PubMed] [Google Scholar]
- 30.Kimmo V, Stephen FP, Morag RG, Robin MI, Claire AJ, Stacy MR, Imran B, Larye DP, Romina AR, Judson GC, Don JG, John RB, Michael JP, James MM. Longitudinal analysis of the group A Streptococcus transcriptome in experimental pharyngitis in cynomolgus macaques. Proceedings of the National Academy of Sciences of the United States of America. 2005;102:9014–9019. doi: 10.1073/pnas.0503671102. [DOI] [PMC free article] [PubMed] [Google Scholar]
- 31.Hwang S, Maloney NS, Bruinsma MW, Goel G, Duan E, Zhang L, Shrestha B, Diamond MS, Dani A, Sosnovtsev SV, Green KY, Lopez-Otin C, Xavier RJ, Thackray LB, Virgin HW. Nondegradative role of Atg5-Atg12/ Atg16L1 autophagy protein complex in antiviral activity of interferon gamma. Cell host & microbe. 2012;11:397–409. doi: 10.1016/j.chom.2012.03.002. [DOI] [PMC free article] [PubMed] [Google Scholar]
- 32.Krämer A, Green J, Pollard J, Tugendreich S. Causal analysis approaches in Ingenuity Pathway Analysis. Bioinformatics (Oxford, England) 2014;30:523–530. doi: 10.1093/bioinformatics/btt703. [DOI] [PMC free article] [PubMed] [Google Scholar]
- 33.Huang da W, Sherman BT, Lempicki RA. Systematic and integrative analysis of large gene lists using DAVID bioinformatics resources. Nat Protoc. 2009;4:44–57. doi: 10.1038/nprot.2008.211. [DOI] [PubMed] [Google Scholar]
- 34.Da Wei H, Brad TS, Richard AL. Bioinformatics enrichment tools: paths toward the comprehensive functional analysis of large gene lists. Nucleic Acids Research. 2009;37:1–13. doi: 10.1093/nar/gkn923. [DOI] [PMC free article] [PubMed] [Google Scholar]
- 35.Paul S, Andrew M, Owen O, Nitin SB, Jonathan TW, Daniel R, Nada A, Benno S, Trey I. Cytoscape: A Software Environment for Integrated Models of Biomolecular Interaction Networks. Genome Research. 2003;13:2498–2504. doi: 10.1101/gr.1239303. [DOI] [PMC free article] [PubMed] [Google Scholar]
- 36.Gabriela B, Bernhard M, Hubert H, Pornpimol C, Marie T, Amos K, Wolf-Herman F, Franck P, Zlatko T, Jérôme G. ClueGO: a Cytoscape plug-in to decipher functionally grouped gene ontology and pathway annotation networks. Bioinformatics. 2009;25:1091–1093. doi: 10.1093/bioinformatics/btp101. [DOI] [PMC free article] [PubMed] [Google Scholar]
- 37.Gabriela B, Jérôme G, Bernhard M. CluePedia Cytoscape plugin: pathway insights using integrated experimental and in silico data. Bioinformatics. 2013;29:661–663. doi: 10.1093/bioinformatics/btt019. [DOI] [PMC free article] [PubMed] [Google Scholar]
- 38.Rusinova I, Forster S, Yu S, Kannan A, Masse M, Cumming H, Chapman R, Hertzog PJ. Interferome v2.0: an updated database of annotated interferon-regulated genes. Nucleic Acids Res. 2013;41:D1040–1046. doi: 10.1093/nar/gks1215. [DOI] [PMC free article] [PubMed] [Google Scholar]
- 39.Ana C, Pedro M, Sonia T, David GC, Alejandra C, Andrew M, Michał S, Wojciech J, Daniel G, Laura LE, Xuegong Z, Ali M. A survey of best practices for RNA-seq data analysis. Genome Biology. 2016;17:13. doi: 10.1186/s13059-016-0881-8. [DOI] [PMC free article] [PubMed] [Google Scholar]
- 40.Gallego Romero I, Pai AA, Tung J, Gilad Y. RNA-seq: impact of RNA degradation on transcript quantification. BMC biology. 2014;12:42. doi: 10.1186/1741-7007-12-42. [DOI] [PMC free article] [PubMed] [Google Scholar]
- 41.McCartney SA, Thackray LB, Gitlin L, Gilfillan S, Virgin HW, Colonna M. MDA-5 recognition of a murine norovirus. PLoS Pathog. 2008;4:e1000108. doi: 10.1371/journal.ppat.1000108. [DOI] [PMC free article] [PubMed] [Google Scholar]
- 42.Damm A, Lautz K, Kufer TA. Roles of NLRP10 in innate and adaptive immunity. Microbes and infection. 2013;15:516–523. doi: 10.1016/j.micinf.2013.03.008. [DOI] [PubMed] [Google Scholar]
- 43.Hwang S, Alhatlani B, Arias A, Caddy SL, Christodoulou C, Cunha JB, Emmott E, Gonzalez-Hernandez M, Kolawole A, Lu J, Rippinger C, Sorgeloos F, Thorne L, Vashist S, Goodfellow I, Wobus CE. Murine norovirus: propagation, quantification, and genetic manipulation. Curr Protoc Microbiol. 2014;33:15K 12 11–61. doi: 10.1002/9780471729259.mc15k02s33. [DOI] [PMC free article] [PubMed] [Google Scholar]
- 44.Abente EJ, Sosnovtsev SV, Bok K, Green KY. Visualization of feline calicivirus replication in real-time with recombinant viruses engineered to express fluorescent reporter proteins. Virology. 2010;400:18–31. doi: 10.1016/j.virol.2009.12.035. [DOI] [PMC free article] [PubMed] [Google Scholar]
- 45.Tong W, Yizhi C, Jingjie J, Jiahui G, Guibin W, Xingfeng Y, Qing-Yu H, Gong Z. Translating mRNAs strongly correlate to proteins in a multivariate manner and their translation ratios are phenotype specific. Nucleic Acids Research. 2013;41:4743–4754. doi: 10.1093/nar/gkt178. [DOI] [PMC free article] [PubMed] [Google Scholar]
- 46.Tirosh O, Cohen Y, Shitrit A, Shani O, Le-Trilling VT, Trilling M, Friedlander G, Tanenbaum M, Stern-Ginossar N. The Transcription and Translation Landscapes during Human Cytomegalovirus Infection Reveal Novel Host-Pathogen Interactions. PLoS Pathog. 2015;11:e1005288. doi: 10.1371/journal.ppat.1005288. [DOI] [PMC free article] [PubMed] [Google Scholar]
- 47.Li JJ, Bickel PJ, Biggin MD. System wide analyses have underestimated protein abundances and the importance of transcription in mammals. PeerJ. 2014;2:e270. doi: 10.7717/peerj.270. [DOI] [PMC free article] [PubMed] [Google Scholar]
- 48.Tobias M, Marc G, Luis S. Correlation of mRNA and protein in complex biological samples. FEBS Letters. 2009;583:3966–3973. doi: 10.1016/j.febslet.2009.10.036. [DOI] [PubMed] [Google Scholar]
- 49.Emmott E, Sorgeloos F, Caddy SL, Vashist S, Sosnovtsev S, Lloyd R, Heesom K, Locker N, Goodfellow I. Norovirus-Mediated Modification of the Translational Landscape via Virus and Host-Induced Cleavage of Translation Initiation Factors. Mol Cell Proteomics. 2017;16:S215–S229. doi: 10.1074/mcp.M116.062448. [DOI] [PMC free article] [PubMed] [Google Scholar]
- 50.Elizabeth R, Nicole D, Azimah AW, Ed E, Simon JM, Ian G, Lisa OR, Nicolas L. Murine Norovirus 1 (MNV1) Replication Induces Translational Control of the Host by Regulating eIF4E Activity during Infection. Journal of Biological Chemistry. 2015;290:4748–4758. doi: 10.1074/jbc.M114.602649. [DOI] [PMC free article] [PubMed] [Google Scholar]
- 51.Liliane C, Dalan B, Eoin NL, Edward PE, Yasmin C, Lisa OR, Stephen C, Nicolas L, Ian GG. Norovirus Translation Requires an Interaction between the C Terminus of the Genome-linked Viral Protein VPg and Eukaryotic Translation Initiation Factor 4G. Journal of Biological Chemistry. 2014;289:21738–21750. doi: 10.1074/jbc.M114.550657. [DOI] [PMC free article] [PubMed] [Google Scholar]
- 52.Das A, Chai JC, Kim SH, Park KS, Lee YS, Jung KH, Chai YG. Dual RNA sequencing reveals the expression of unique transcriptomic signatures in lipopolysaccharide-induced BV-2 microglial cells. PLoS One. 2015;10:e0121117. doi: 10.1371/journal.pone.0121117. [DOI] [PMC free article] [PubMed] [Google Scholar]
- 53.Trinchieri G, Sher A. Cooperation of Toll-like receptor signals in innate immune defence. Nat Rev Immunol. 2007;7:179–190. doi: 10.1038/nri2038. [DOI] [PubMed] [Google Scholar]
- 54.Enosi Tuipulotu D, Netzler NE, Lun JH, Mackenzie JM, White PA. RNA Sequencing of Murine Norovirus-Infected Cells Reveals Transcriptional Alteration of Genes Important to Viral Recognition and Antigen Presentation. Front Immunol. 2017;8:959. doi: 10.3389/fimmu.2017.00959. [DOI] [PMC free article] [PubMed] [Google Scholar]
- 55.Timothy JN, Megan TB, Broc TM, Jason MN, Helen ML, Maxim A, Michael SD, Herbert WV. Interferon-λ cures persistent murine norovirus infection in the absence of adaptive immunity. Science. 2015;347:269–273. doi: 10.1126/science.1258100. [DOI] [PMC free article] [PubMed] [Google Scholar]
- 56.Nice TJ, Osborne LC, Tomov VT, Artis D, Wherry EJ, Virgin HW. Type I Interferon Receptor Deficiency in Dendritic Cells Facilitates Systemic Murine Norovirus Persistence Despite Enhanced Adaptive Immunity. PLoS Pathog. 2016;12:e1005684. doi: 10.1371/journal.ppat.1005684. [DOI] [PMC free article] [PubMed] [Google Scholar]
- 57.Niendorf S, Klemm U, Mas Marques A, Bock CT, Hohne M. Infection with the Persistent Murine Norovirus Strain MNV-S99 Suppresses IFN-Beta Release and Activation of Stat1 In Vitro. PLoS One. 2016;11:e0156898. doi: 10.1371/journal.pone.0156898. [DOI] [PMC free article] [PubMed] [Google Scholar]
- 58.Davidson S, Crotta S, McCabe TM, Wack A. Pathogenic potential of interferon alphabeta in acute influenza infection. Nat Commun. 2014;5:3864. doi: 10.1038/ncomms4864. [DOI] [PMC free article] [PubMed] [Google Scholar]
- 59.Zhang N, Bao YJ, Tong AH, Zuyderduyn S, Bader GD, Malik Peiris JS, Lok S, Lee SM. Whole transcriptome analysis reveals differential gene expression profile reflecting macrophage polarization in response to influenza A H5N1 virus infection. BMC Med Genomics. 2018;11:20. doi: 10.1186/s12920-018-0335-0. [DOI] [PMC free article] [PubMed] [Google Scholar]
- 60.Karst SM. The Role of Type I Interferon in Regulating Norovirus Infections. Journal of Clinical & Cellular Immunology. 2011;S1:001. [Google Scholar]
- 61.Lin Q, Kosuke M, James RB, Margarita KL, Susana G, Victoria RT, Robert LA, Mary KE. Replication of Human Norovirus RNA in Mammalian Cells Reveals Lack of Interferon Response. Journal of Virology. 2016;90:8906–8923. doi: 10.1128/JVI.01425-16. [DOI] [PMC free article] [PubMed] [Google Scholar]
- 62.Newman KL, Moe CL, Kirby AE, Flanders WD, Parkos CA, Leon JS. Norovirus in symptomatic and asymptomatic individuals: cytokines and viral shedding. Clinical & Experimental Immunology. 2016;184:347–357. doi: 10.1111/cei.12772. [DOI] [PMC free article] [PubMed] [Google Scholar]
- 63.Sonja S, David S, Benjamin Rt. Mitogen-activated Protein Kinase-mediated Licensing of Interferon Regulatory Factor 3/7 Reinforces the Cell Response to Virus. Journal of Biological Chemistry. 2014;289:299–311. doi: 10.1074/jbc.M113.519934. [DOI] [PMC free article] [PubMed] [Google Scholar]
- 64.Nathalie G, Marc JS, Benjamin t, Ganes CS, Siddarth B, Glen NB, Rongtuan L, John H. Transcriptional Profiling of Interferon Regulatory Factor 3 Target Genes: Direct Involvement in the Regulation of Interferon-Stimulated Genes. Journal of Virology. 2002;76:5532–5539. doi: 10.1128/JVI.76.11.5532-5539.2002. [DOI] [PMC free article] [PubMed] [Google Scholar]
- 65.Thackray LB, Duan E, Lazear HM, Kambal A, Schreiber RD, Diamond MS, Virgin HW. Critical role for interferon regulatory factor 3 (IRF-3) and IRF-7 in type I interferon-mediated control of murine norovirus replication. Journal of virology. 2012;86:13515–13523. doi: 10.1128/JVI.01824-12. [DOI] [PMC free article] [PubMed] [Google Scholar]
- 66.Marisela RR, Kristen M, Larissa BT, Deborah JL. ISG15 Functions as an Interferon-Mediated Antiviral Effector Early in the Murine Norovirus Life Cycle. Journal of Virology. 2014;88:9277–9286. doi: 10.1128/JVI.01422-14. [DOI] [PMC free article] [PubMed] [Google Scholar]
- 67.Kenneth JR, Chang SH, Keun K, Il, Ming Y, Dabralee R, Li L, Juan Carlos de la T, Dong-Er Z. Role of ISG15 protease UBP43 (USP18) in innate immunity to viral infection. Nature Medicine. 2004;10:1374–1378. doi: 10.1038/nm1133. [DOI] [PubMed] [Google Scholar]
- 68.Oxana AM, Keun K, Jiann-Kae L, Weiguo Z, Kumar KGS, Serge YF, Ke S, Dong-Er Z. UBP43 is a novel regulator of interferon signaling independent of its ISG15 isopeptidase activity. The EMBO Journal. 2006;25:2358–2367. doi: 10.1038/sj.emboj.7601149. [DOI] [PMC free article] [PubMed] [Google Scholar]
- 69.Nadine H, Namir S, Giuseppe C, Ursula RS, Dong-Er Z, Mirko T, Karin K, Martina S, Reinhard K, Nicole G, Nico van R, Christoph B, Stephan EB, Melanie G, Max L, Hartmut H, Klaus P, Masato T, Dieter H, Mike R, Philipp AL, Karl SL. Enforced viral replication activates adaptive immunity and is essential for the control of a cytopathic virus. Nature Immunology. 2011;13:51–57. doi: 10.1038/ni.2169. [DOI] [PubMed] [Google Scholar]
- 70.Urmila M, John SP, Liwu L. An Innate Immunity Signaling Process Suppresses Macrophage ABCA1 Expression through IRAK-1-Mediated Downregulation of Retinoic Acid Receptor α and NFATc2. Molecular and Cellular Biology. 2009;29:5989–5997. doi: 10.1128/MCB.00541-09. [DOI] [PMC free article] [PubMed] [Google Scholar]
- 71.John WS, Glenn R. Lipids in Innate Antiviral Defense. Cell Host & Microbe. 2013;14:379–385. doi: 10.1016/j.chom.2013.09.010. [DOI] [PMC free article] [PubMed] [Google Scholar]
- 72.Loizides-Mangold U, Clement S, Alfonso-Garcia A, Branche E, Conzelmann S, Parisot C, Potma EO, Riezman H, Negro F. HCV 3a core protein increases lipid droplet cholesteryl ester content via a mechanism dependent on sphingolipid biosynthesis. PLoS One. 2014;9:e115309. doi: 10.1371/journal.pone.0115309. [DOI] [PMC free article] [PubMed] [Google Scholar]
- 73.Aybeke EN, Belliot G, Lemaire-Ewing S, Estienney M, Lacroute Y, Pothier P, Bourillot E, Lesniewska E. HS-AFM and SERS Analysis of Murine Norovirus Infection: Involvement of the Lipid Rafts. Small. 2017;13:1600918. doi: 10.1002/smll.201600918. [DOI] [PubMed] [Google Scholar]
- 74.Nathanael JS, Lana XG, Jeffrey GM, David SM, Stephen BM, Norihito S, Donna R, Jesse NF, Iftach S, Daniel H, Christian RHR, Elaine WW, Samuel LK, Sullards MC, Robert CM, Alfred HM, Brown HA, Edward AD, Andrew CL, Klaus L, Sotirios T, Eoin F, Shankar S, Oswald Q, David WR, Christopher KG. Regulated Accumulation of Desmosterol Integrates Macrophage Lipid Metabolism and Inflammatory Responses. Cell. 2012;151:138–152. doi: 10.1016/j.cell.2012.06.054. [DOI] [PMC free article] [PubMed] [Google Scholar]
- 75.Kyeong-Ok C. Role of Cholesterol Pathways in Norovirus Replication. Journal of Virology. 2009;83:8587–8595. doi: 10.1128/JVI.00005-09. [DOI] [PMC free article] [PubMed] [Google Scholar]
- 76.Nascimento R, Costa H, Parkhouse RME. Virus manipulation of cell cycle. Protoplasma. 2012;249:519–528. doi: 10.1007/s00709-011-0327-9. [DOI] [PubMed] [Google Scholar]
- 77.Davies C, Ward VK. Expression of the NS5 (VPg) Protein of Murine Norovirus Induces a G1/S Phase Arrest. PLoS One. 2016;11:e0161582. doi: 10.1371/journal.pone.0161582. [DOI] [PMC free article] [PubMed] [Google Scholar]
- 78.Luisa S, Michael J, Kristian H. E2F7, a novel E2F featuring DP-independent repression of a subset of E2F-regulated genes. The EMBO Journal. 2003;22:6289–6298. doi: 10.1093/emboj/cdg613. [DOI] [PMC free article] [PubMed] [Google Scholar]
- 79.Jesper C, Paul C, Ulla T, David K, Adrian PB, Emmanuelle T, Mel H, Luisa S, Kristian H. Characterization of E2F8, a novel E2F-like cell-cycle regulated repressor of E2F-activated transcription. Nucleic Acids Research. 2005;33:5458–5470. doi: 10.1093/nar/gki855. [DOI] [PMC free article] [PubMed] [Google Scholar]
Associated Data
This section collects any data citations, data availability statements, or supplementary materials included in this article.