

Abstract
The objective of this study was to evaluate the impact of varying degrees of water salinity on the ultrasonographical and histopathological appearance of the liver and kidneys in Barki sheep. Thirty Barki sheep (initial weight, 29.48 ± 0.81 kg) were allocated into three groups (n=10 per group) based on the type of drinking water for 9 months: the tap water (TW) group (350 ppm total dissolved solids [TDS]); the moderate saline water (MSW) group (4,557 ppm TDS); and the high saline water (HSW) group (8,934 ppm TDS). After 9 months, the body weight was significantly decreased in sheep subjected to MSW (P=0.0347) and HSW (P=0.0424). Alanine aminotransferase, aspartate aminotransferase, alkaline phosphatase, urea, and creatinine were significantly increased (P<0.05) in sheep subjected to MSW and HSW. Ultrasonographic examination of the right and left kidneys revealed an increased length of both kidneys with crystal formation, particularly in male sheep. Ultrasonographic examination of the liver showed hyperechogenic dots varying in size and number between males and females. Histopathological examination of kidney revealed significant changes in both MSW and HSW groups such as hyaline matrix formation, atrophied glomerular tufts, and intramedullary congestion. Histopathological examination of the liver revealed slight fatty liver changes, slight fibrosis around the bile duct, massive inflammatory cell infiltration and vacuolar changes of hepatocytes in both MSW and HSW groups. In conclusion, water salinity negatively affects the body weight, liver and kidney appearance of Barki sheep and thus sheep production.
Keywords: histopathology, kidney, liver, sheep, ultrasonography
Sheep play an important role in the agricultural matrix, particularly in desert and marginal areas. Small ruminants are important animals among livestock in Egypt, especially as sources of meat, wool and milk [25]. Sheep can survive in different ecological systems and on differing vegetation [12]. Small ruminant populations represent approximately 50% of the total ruminant population in Egypt. Over 80% of Egypt is desert, and groundwater is the main water resource. Per public health service recommendations, domestic drinking water should contain 400 of TDS; concentrations >1,000 ppm are considered saline [21]. Under the arid conditions of South Sinai in Egypt, fresh water shortage is the main limiting factor of sufficient sheep production [2]. Previous local studies examined the effect of water salinity on performance and physiological responses in desert animals [2]. Limited and controversial information exists on the effect of water salinity on the ultrasonographic and histopathologic appearance of the liver and kidney in sheep.
The principal functions of the kidney are water maintenance, electrolyte homeostasis, selective reabsorption, and sodium chloride conservation [22]. Kidneys are also responsible for excreting toxic metabolic waste products, particularly the nitrogenous compounds urea and creatinine [23]. The liver performs many important functions, including the following: lipid, carbohydrate, and protein metabolism; mineral, glycogen, and triglyceride storage; extramedullary hematopoiesis; and coagulant, anticoagulant, and acute phase protein synthesis [19]. The liver also influences immunologic responses and contributes to digestion by circulating enterohepatic bile acids and detoxifying endogenous and exogenous compounds [5, 19]. Common laboratory tests for determining liver and kidney function often fail to reveal a disorder if part of these organs are still functioning [15]. While ultrasounds can sufficiently determine gestational age in sheep, they also provide important clinical information on other physiological systems [24]. Ultrasonography has gained importance in physiologically and clinically examining the kidneys and liver [11, 24]. Despite considerable advances in non-invasively evaluating liver and kidney dysfunction, histopathological assessments also continue to play an important role in diagnosing and managing patients with liver and kidney disease [1, 13].
The objectives of the study were to evaluate the impact of saline water consumption on the ultrasonographical and histopathological appearance of the liver and kidney in Barki sheep reared in the South Sinai Peninsula of Egypt.
MATERIALS AND METHODS
Animals and experimental design
Thirty Barki sheep aged 1–1.5 years with an initial body weight of 29.48 ± 0.81 kg and owned by the Animal Health Desert Research Center, located at South Sinai Peninsula, Egypt, were used in this study. The sheep were allotted to three equal subgroups (n=10; 5 males and 5 females per group), balanced for age and live body weight. The tap water (TW) group were allowed to drank tap water with 350 ppm TDS and were used as the control. The moderate saline water (MSW) group were allowed to drank moderate saline water with 4,557 ppm TDS, and the high saline water (HSW) group were allowed to drank high saline water with 8,934 ppm TDS. Groups were housed separately in shaded pens. The trial started at the beginning of August 2015 and was terminated at the end of April 2016. All procedures were performed in accordance with the standards required by the Animal Ethics Committee of the Animal Health Desert Research Center.
The sheep were clinically examined to assure their health before study enrollment. The sheep were dewormed in two doses (two weeks apart) by an SC anthelmintic injection [Ivermectin + Clorsulon 0.2 mg/kg Bwt (Ivomec® super in a dose of 1 ml/50 kg SC)]. The sheep were acclimated for two weeks prior to beginning the experiment. The experimental sheep were offered a maintenance ration according to the Agriculture Research Council allowance. The ration consisted of berseem hay and concentrated-mixture cubes made from undecorticated cotton seed (50%), rice polish (11%), wheat bran (18%), yellow maize (15%), molasses (3%), limestone (2%) and salt (1%). Feed was offered once daily at 0800 hr, and water was freely available for 1 hr during feeding. The amount of feed provided was determined per locally calculated maintenance requirements. The sheep were housed in a hygienic, well-ventilated stable under the same environmental, nutritional and hygienic conditions throughout the experimental period. Live body weight was determined at the study onset and 9 months after saline water treatment. Analysis and water sources used in the experiment are depicted in Table 1. The results of the analysis showed that the MSW and HSW groups had higher cation (Ca++, Mg++, Na+, K+) and anion levels (HCO3–, Cl–, SO4–) than those in the TW group (Table 1).
Table 1. Water source and water analysis for ground saline and tap water.
| Level | Water source | TDS (mg/l) | Cations (mEq/l) |
Anions (mEq/l) |
|||||
|---|---|---|---|---|---|---|---|---|---|
| Ca++ | Mg++ | Na+ | K+ | HCO3− | Cl− | SO4− | |||
| TW | Collected in plastic tanks from south Sinai research station | 350 | 37.1 | 15.0 | 28.2 | 7.9 | 170.0 | 26.6 | 55.2 |
| MSW | Collected in plastic tanks from moderate saline water wells that present in south Sinai desert research station | 4,557 | 216.4 | 86.9 | 1,232.0 | 15.6 | 323.4 | 1,386.5 | 1,287.2 |
| HSW | Collected in plastic tanks from high saline water wells that present in south Sinai desert research station | 8,934 | 386.7 | 167.8 | 2,416.0 | 35.0 | 457.6 | 3,301.0 | 1,858.8 |
TDS, Total dissolved solid; TW, Tap water; MSW, Moderate saline water; HSW, High saline water.
Clinical examination
The sheep were clinically examined periodically to ensure their health by measuring body temperature, respiratory and pulse rates, ruminal movement and mucous membrane condition [26].
Blood sampling and serum biochemical analysis
Blood samples were collected from sheep at the study onset and after 9 months of saline water treatment. Blood samples were drawn from all sheep via the jugular vein by collecting approximately 5 ml of blood in a clean, dry vacuum tube (Biomedica Alex Co., Alexandria, Egypt). Blood was clotted at room temperature for 20 min and centrifuged at 3,000 rpm for 10 min, and clear, non-hemolyzed serum samples were stored at −20°C until subsequent analysis. Alanine aminotransferase (ALT, IU/l), aspartate aminotransferase (AST, IU/l), alkaline phosphatase (ALP, IU/l), urea (mg/dl) and creatinine (mg/dl) from the serum samples were assessed using commercial kits provided by Spectrum Diagnostics (Obour City, Cairo, Egypt) and spectrophotometric analysis (Clinical Chemistry Analyzer ERBA CHEM 7, ERBA, Mannheim, Germany).
Ultrasonographic examination
Ultrasonography was performed at the study onset and after 9 months of treatment with saline water using a portable ultrasound machine (SonoVet R3, Daejeon, South Korea) with a 4–6 MHz linear array probe and a 3.5 MHz curved linear probe using a standardized scanning process [6]. To optimize image quality, the regional skin was clipped, washed with alcohol, and covered with ultrasonographic gel. All ultrasonographic evaluations were performed in standing position. For all ultrasonography cases, both kidneys were scanned from the right side of the body, in the flank zone just before the 13th rib and in the ventral section of the transverse process of the lumbar vertebrae. To assess the right kidney longitudinally, the transducer was placed over the sublumbar fossa immediately caudal to the last right rib. To assess the left kidney longitudinally, the transducer was placed parallel to the lumbar vertebrae on the middle of the left flank. To evaluate transverse kidney sections, the transducer was placed directly on the longitudinal axis of each kidney [7]. Ultrasonographic examination of the liver was performed from the right side on the right of the abdomen in the 12th to 7th intercostal spaces [14]. In each intercostal space, the liver dimensions and location and the diameter of the portal and hepatic veins were determined if visible. Ultrasonographic measurements of liver size and location in healthy sheep were used as references for changes in liver size attributable to illness due to water salinity.
Histopathological examination
At the end of the study, four animals from each group (two males and two females) were humanely euthanized [10]. After opening the visceral cavity, the esophagus and rectum were clamped to avoid spilling gastrointestinal digesta and contaminating other intestinal sections. Immediately after removing the gastrointestinal tract from the visceral cavity, standardized liver and kidney locations were exposed with sterile instruments. After collection, 2-cm portions from different areas of the liver and kidney were excised, placed in 10% neutral buffered formalin, washed, dehydrated in ascending grades of ethyl alcohol, cleared in methyl benzoate and embedded in paraffin wax. Several paraffin sections of 3–5 microns thick were cut and stained with hematoxylin and eosin [4] and observed microscopically.
Statistical analysis
Statistical analyses were performed using JMP 13 software (SAS Institute Inc., Cary, NC, U.S.A.) [26, 27]. The data were compared using a one-way analysis of variance (ANOVA) and pooled t-tests fitted in JMP 13 (SAS Institute Inc.). P value was adjusted through comparisons of all pairs using Tukey-Kramer HSD test. Dunnett’s multiple comparisons procedure was used to compare the MSW and HSW data at the end of the experiment (9 month) against day 0 (pretreatment control). The values are presented as the mean ± standard error (SE). All differences were considered significant when P<0.05.
RESULTS
Live body weight and clinical examination
The live body weights of the sheep at the study onset for the TW, MSW and HSW treatment groups were 29.55 ± 1.49, 28.1 ± 2.39 and 30.8 ± 1.77, respectively (Fig. 1). After saline water treatment, the body weight significantly decreased in the sheep subjected to MSW (P=0.0347) and HSW (P=0.0424). No significant change in body weight (P=0.519) occurred in the TW group (Fig. 1). Clinical examination revealed evident dehydration in the HSW group, and three animals died within the first 4 months of the experiment. The TW and MSW groups had no mortality throughout the experiment. Post-mortem examination of the recently dead sheep revealed congested liver and mildly enlarged kidneys. Clinical parameters (rectal temperature, pulse rate, respiratory rate and ruminal movement) observed during the experimental period showed no significant differences among the groups (data not shown).
Fig. 1.

Changes in body weight (kg) in Barki sheep at the experiment onset and after 9 months of saline water treatment in the TW, MSW and HSW groups.
Serum biochemical analysis
At the study onset, no significant differences (P>0.05) were noted in any biochemical parameters (ALT, AST, urea, creatinine) among the TW, MSW and HSW groups (Fig. 2). After 9 months of saline water treatment, AST, ALT, ALP, urea and creatinine values were significantly increased (P<0.05) in the MSW and HSW groups compared with the TW group (Fig. 2).
Fig. 2.

Changes in ALT (IU/l), AST (IU/l), ALP (IU/l), urea (mg/dl) and creatinine (mg/dl), levels in serum samples of Barki sheep at the experiment onset and after 9 months of saline water treatment in the TW, MSW and HSW groups.
Ultrasonographic examination of the kidneys and liver
Ultrasonographic examination of all sheep in the TW, MSW and HSW groups at the experiment onset showed normal echogenicity without hyperechogenic dots in either the right (Fig. 3A–F) or left kidney (Fig. 3G–L). After 9 months of saline water treatment, there was a significant increase (P<0.05) in both right (Table 2) and left kidney length (Table 3) in MSW and HSW group compared to TW group especially in male sheep. No significant differences were observed in width, thickness, renal pelvic length, renal pelvic width, renal cortex thickness, or renal medullary thickness in either the right (Table 2) or left kidney (Table 3). The MSW and HSW groups showed crystal formation and more echogenic dots in both the right (Fig. 4A–F) and left kidneys (Fig. 4G–L), particularly in male sheep, compared with the TW group. Ultrasonographic examination of the urinary bladder at the onset of the experiment showed a normal, non-echogenic appearance in all groups (Fig. 5A–C). After 9 months of saline water treatment, ultrasonography of the urinary bladder revealed stone formation in the MSW and HSW groups compared with the TW group (Fig. 5D–F). At experiment onset, ultrasonographic examination of the liver in the TW, MSW and HSW groups showed normal echogenicity without hyper echogenic dots in all sheep (Fig. 6A–F). After 9 months of saline water treatment, the liver surface showed echogenic dots, varying in size and number between males and females (Fig. 6G–L).
Fig. 3.
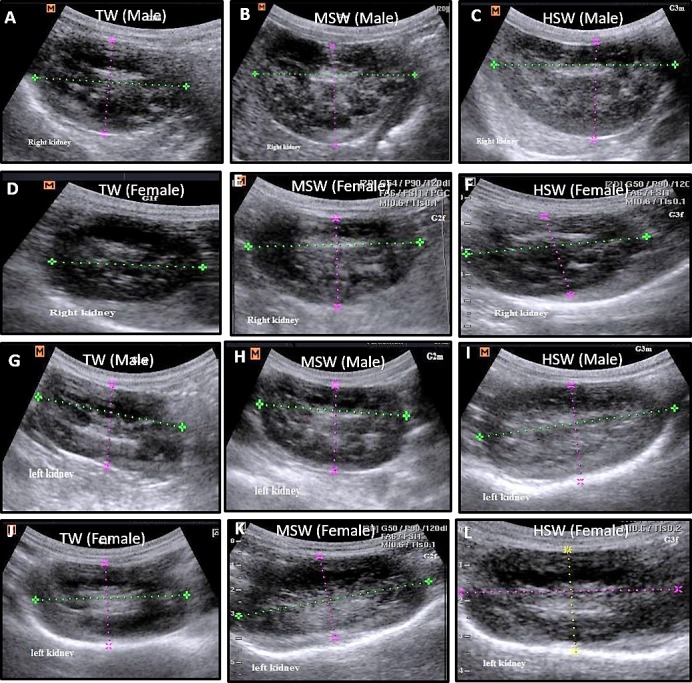
Ultrasonographic examination of right and left kidneys in both male and female Barki sheep at the experiment onset in the TW, MSW and HSW groups. Right kidney in male (A–C) and female (D–F) and left kidney in male (G–I) and female (J–L) Barki sheep at the experiment onset in the TW, MSW and HSW groups showed normal echogenicity without hyperechogenic dots.
Table 2. Changes in right kidney measures at the onset of the experiment and after 9 month of saline water treatment in TW, MSW and HSW groups.
| Right kidney | At the onset of the experiment |
After 9 months of saline water treatment |
||||
|---|---|---|---|---|---|---|
| TW | MSW | HSW | TW | MSW | HSW | |
| Right kidney length | 5.90 ± 0.16 a) | 5.90 ± 0.12 a) | 6.12 ± 0.20 a) | 6.17 ± 0.17 a) | 7.33 ± 0.15 b) | 7.63 ± 0.17 b) |
| Right kidney width | 3.70 ± 0.14 a) | 3.70 ± 0.11 a) | 3.70 ± 0.09 a) | 3.75 ± 0.19 a) | 3.65 ± 0.13 a) | 3.81 ± 0.12 a) |
| Right kidney thickness | 3.20 ± 0.17 a) | 3.20 ± 0.07 a) | 3.10 ± 0.08 a) | 3.50 ± 0.15 a) | 3.55 ± 0.10 a) | 3.63 ± 0.11 a) |
| Right renal pelvis length | 2.50 ± 0.12 a) | 2.40 ± 0.10 a) | 2.60 ± 0.15 a) | 3.22 ± 0.15 a) | 3.54 ± 0.17 a) | 3.31 ± 0.16 a) |
| Right renal pelvis width | 1.50 ± 0.21 a) | 1.40 ± 0.16 a) | 1.20 ± 0.07 a) | 1.31 ± 0.07 a) | 1.44 ± 0.06 a) | 1.36 ± 0.08 a) |
| Renal cortex thickness | 0.60 ± 0.20 a) | 0.60 ± 0.02 a) | 0.70 ± 0.02 a) | 0.68 ± 0.03 a) | 0.65 ± 0.02 a) | 0.60 ± 0.00 a) |
| Renal medullary thickness | 2.00 ± 0.16 a) | 2.10 ± 0.11 a) | 2.01 ± 0.13 a) | 2.51 ± 0.11 a) | 2.43 ± 0.09 a) | 2.41 ± 0.11 a) |
Different superscripts letters means significant difference when (P<0.05) at the same row. TW, Tap water; MSW, Moderate saline water; HSW, High saline water.
Table 3. Changes in left kidney measures at the onset of the experiment and after 9 month of saline water treatment in TW, MSW and HSW groups.
| Left kidney | At the onset of the experiment |
After 9 months of saline water treatment |
||||
|---|---|---|---|---|---|---|
| TW | MSW | HSW | TW | MSW | HSW | |
| Left kidney length | 5.86 ± 0.18 a) | 6.02 ± 0.17 a) | 6.05 ± 0.15 a) | 6.66 ± 0.24 a) | 7.63 ± 0.14 b) | 7.48 ± 0.22 b) |
| Left kidney width | 3.78 ± 0.16 a) | 3.52 ± 0.11 a) | 3.68 ± 0.16 a) | 3.64 ± 0.14 a) | 3.82 ± 0.15 a) | 3.77 ± 0.11 a) |
| Left kidney thickness | 2.92 ± 0.18 a) | 3.05 ± 0.12 a) | 3.06 ± 0.14 a) | 3.15 ± 0.18 a) | 3.26 ± 0.09 a) | 3.27 ± 0.12 a) |
| Left renal pelvis length | 2.57 ± 0.13 a) | 2.67 ± 0.08 a) | 2.64 ± 0.11 a) | 3.22 ± 0.19 a) | 3.42 ± 0.14 a) | 3.56 ± 0.11 a) |
| Left renal pelvis width | 1.45 ± 0.19 a) | 1.21 ± 0.12 a) | 1.39 ± 0.17 a) | 1.32 ± 0.18 a) | 1.29 ± 0.09 a) | 1.51 ± 0.12 a) |
| Renal cortex thickness | 0.87 ± 0.12 a) | 0.81 ± 0.09 a) | 0.76 ± 0.04 a) | 0.78 ± 0.12 a) | 0.71 ± 0.09 a) | 0.81 ± 0.11 a) |
| Renal medullary thickness | 2.04 ± 0.05 a) | 1.87 ± 0.17 a) | 2.11 ± 0.11 a) | 2.23 ± 0.13 a) | 2.32 ± 0.08 a) | 2.41 ± 0.07 a) |
Different superscripts letters means significant difference when (P<0.05) at the same row. TW, Tap water; MSW, Moderate saline water; HSW, High saline water.
Fig. 4.
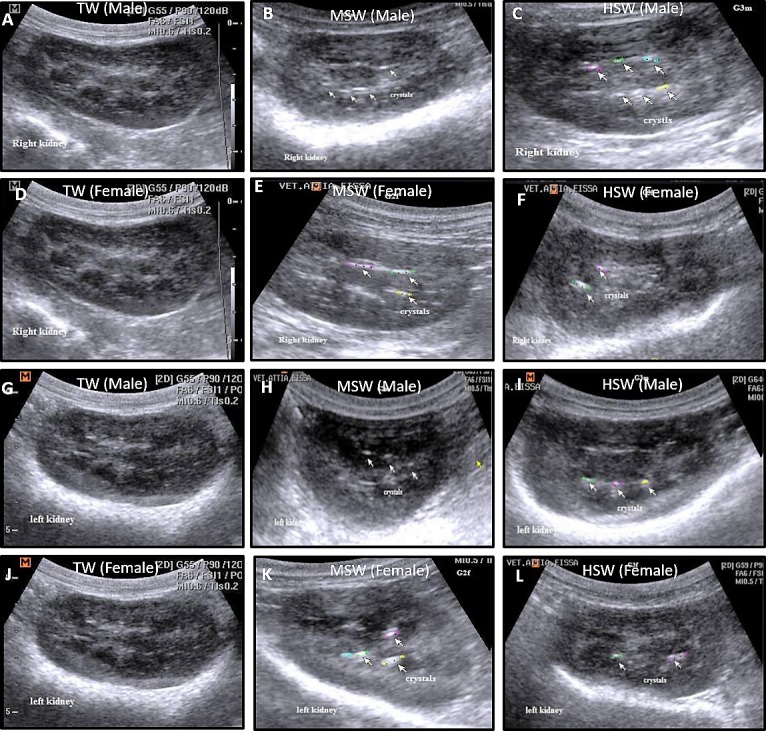
Ultrasonographic examination of right and left kidneys in both male and female Barki sheep after 9 months of saline water treatment in the TW, MSW and HSW groups. Right kidney in male (A–C) and female (D–F) and left kidney in male (G–I) and female (J–L) Barki sheep after 9 months of saline water treatment in the MSW and HSW groups showed crystal formation and increased numbers of echogenic dots, particularly in male sheep compared with the TW group.
Fig. 5.

Ultrasonographic urinary bladder examination in sheep at the experiment onset and after 9 months of saline water treatment in the TW, MSW and HSW groups. At the onset, the urinary bladder in the TW, MSW and HSW groups (A–C) showed a normal, non-echogenic appearance in all groups. After 9 months of saline water treatment, the urinary bladder in the MSW and HSW groups revealed stone formation compared with the TW group (D–F).
Fig. 6.
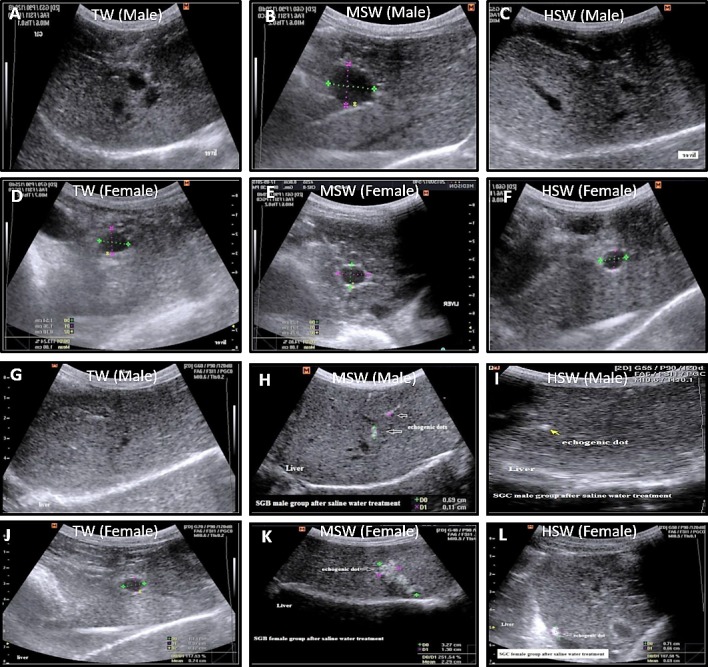
Ultrasonographic liver examination in both male and female Barki sheep at the experiment onset and after 9 months of saline water treatment in the TW, MSW and HSW groups. At the onset, the livers in males (A–C) and females (D–F) in the TW, MSW and HSW groups showed normal echogenicity without hyperechogenic dots. After 9 months of saline water treatment, livers in males (G–I) and females (J–L) in the MSW and HSW groups showed echogenic dots that varied in size and number between males and females.
Histopathological examination of the kidneys and liver
At the end of the study, the TW group showed normal histopathological glomeruli structure, surrounded by the capsule, and normal proximal, distal, and convoluted tubules. After 9 months of saline water treatment, the histopathological appearance of the kidneys in the MSW group revealed hyaline matrix formation within the glomeruli with atrophied glomerular tufts, hemorrhage in the cortex and initial necrosis of the distal convoluted tubules. The histopathological appearance of the HSW group kidneys revealed massive medullary fibrosis and hemorrhage, intramedullary congestion, atrophied glomerular tufts, and hyaline casts in the distal convoluted tubules.
Histopathological examination of the liver in the TW group at the end of the experiment showed normal histopathological structure of the central vein and surrounding hepatocytes. After saline water treatment, significant histopathological changes were observed in both the MSW and HSW groups. In the MSW group, the liver showed clear hepatic sinusoid dilatation, congestion, massive inflammatory cell infiltration (lymphocyte and plasma cell), slight fatty liver changes and slight fibrosis around the bile duct. In the HSW group, histopathological examination of the liver revealed massive inflammatory cell infiltration and vacuolar changes of hepatocytes.
DISCUSSION
Physiological responses in small ruminants to varying degrees of water salinity have been reported in detail previously by other investigators [2, 18]. In this study, we describe the first use of ultrasonography and histopathological changes to compare the impact of consuming saline water on the liver and kidneys in sheep. These findings are important because of the central roles of the liver and kidneys in regulating metabolic processes [5, 23]. In this study, water intake was influenced by the degree of water salinity. At the beginning of the experiment, water intake was significantly decreased in the HSW and MSW groups compared with the TW group (data not shown). This finding supports the observations of other investigators who showed that animals receiving 5.5 and 11 g of TDS/l saline water consumed large amounts of water [17]. Initially, the reduced water intake level in the MSW and HSW groups may have been an adaptive response to reduce the negative effects of the water salinity. The increased plasma colloid osmolality, particularly in desert animals, also helps to protect the sheep from the saline water by decreasing their water intake [2]. After the 1st month, the animals became accommodated to the salty taste and thus increased their water consumption by the end of the experiment (9 months). This finding is consistent with the observations of Kii and Dryden [16] who reported that water consumption increased with increased salt content, and the animals who consumed 8,500 mg of TDS per kg drank significantly more water than those who received 570 mg of TDS per kg. The increased water intake occurs because the salt stimulates specific receptors on the tongue to activate osmoreceptors in the hypothalamus. This effect increases serum osmolality, causing thirst and leading to increased water consumption [2]. The animals’ attempts to maintain the Na content in their body fluid compartments within physiological limits led to increased water consumption by the end of the experiment [16]. In our study, the significant decrease in body weight of the sheep subjected to water salinity could be attributed to decreased feed intake and/or metabolic failure. Saline water also stimulates cerebrospinal fluid in the brain to inhibit parotid salivary flow production, negatively affecting the rumen microflora and reducing digestion and resulting in decreased microbial loads and proteolytic activity [3, 17]. The significantly increased ALT, AST, ALP, urea and creatinine in the MSW and HSW groups revealed impaired liver and kidney functions in sheep consuming varying levels of saline water. In the MSW and HSW groups, the significantly increased AST, ALT and ALP activities could also be attributed to these enzymes leaking from hepatocytes due to pressure damage by crystal formation. In ruminants, liver function tests are non-specific for diagnosing liver diseases [14]. For example, hepatic function tests generally cannot differentiate metabolic disorders that lead to diffuse changes in the liver from other disorders that usually induce focal changes [9]. In contrast to liver and kidney function tests, ultrasonography is an accurate, quick, non-invasive and safe technique used for following kidney and liver abnormalities in small ruminants [8, 20]. Ultrasonography has been used successfully to describe normal hepatic and kidney appearance in sheep [20]. In small ruminants, ultrasonography has efficiently diagnosed fascioliasis, subclinical liver lesions, fatty liver, glomerulonephritis, hydronephrosis and urolithiasis [20]. In the present study, in both healthy and saline water-treated sheep, the kidneys and liver were examined while the animals were standing. Our study revealed a significant increase in right kidney length (P<0.05) in the HSW group. The increased kidney length indicates mild hydronephrosis that may be attributed to crystallization, but we cannot conclude or generalize this metric for diagnosis. However, determining kidney size provides significant information for diagnosing hydronephrosis [3]. Ultrasonographic examination of the right and left kidneys after saline water treatment revealed a significantly increased number of echogenic dots (crystals), especially in male sheep. Microscopic examination of the urine showed that these echogenic dots were uric acid crystals that formed due to the decreased urine pH (data not shown). Crystal formation in males is mainly attributed to the urinary system structure (long and narrow urethra with sigmoid flexure and the urethral process), which predisposes them to crystal deposition compared with females (short urethra, absence of sigmoid flexure and a urethral process). Ultrasonographic examination of the sheep livers after saline water treatment revealed a significantly increased number of echogenic dots in the MSW and HSW groups. The hyperechoic features in the livers with saline water may be attributed to changes in the liver tissues due to fibrosis, abscesses or tumors that cannot be differentiated ultrasonographically. The increased number of echogenic dots and larger size in females could be attributed to differences in sex hormones. A similar increase in echogenicity was reported following a cystic echinococcosis infection in sheep with pathological findings of hemorrhaging and necrosis [14]. In this study, the histopathological findings supported the ultrasonographic results and confirmed the changes in liver and kidney appearance in the sheep treated with varying levels of saline water. Significant histopathological changes were observed in both the right and left kidneys of the MSW and HSW groups after 9 months of saline water treatment. No changes were observed in the TW control group. Changes in the kidneys were characterized by hyaline matrix formation with atrophied glomerular tufts, hemorrhage in the cortex, initial necrosis of the distal convoluted tubules, massive medullary fibrosis and hemorrhage. No histopathological changes were observed in the TW livers (control group) in either males or females. The TW group revealed normal histological structure of the central vein and surrounding hepatocytes, while after saline water treatment, there were significant histopathological changes in the MSW and HSW groups. Liver changes included fibrosis and inflammatory cell infiltration, similar to those reported by other investigators [1]. Additional studies using larger animal cohorts of different species are required to determine the safe upper salinity value in desert-reared sheep. This information is crucial due to the importance of water in sheep health and productivity and may aid in the development of strategies that could reduce saline water usage in livestock reared in arid conditions.
According to our results, we concluded that, saline groundwater harmfully affected the urinary system in sheep, as represented ultrasonographically by echogenic dot (crystal) formation on the kidneys, leading to urolithiasis, mild hydronephrosis and kidney fibrosis. The saline groundwater also resulted in hepatic dysfunction, which was represented ultrasonographically by hyperechoic dots, and histopathologically by inflammatory cell infiltration and massive fibrosis in most cases. We recommend that sheep breeders in Egypt, especially in south Sinai, use saline groundwater mixed with fresh water to avoid the harmful effects of saline water on kidney and liver function.
CONFLICT OF INTEREST
The authors declare that they have no conflicts of interest to disclose.
Acknowledgments
We sincerely thank the staff at South Sinai Research Station (Ras-Sudr) for caring for the sheep during the experiment. The authors acknowledge the funding supported by the Animal Health Desert Research Center and the Department of Animal Medicine at Benha University-Egypt.
REFERENCES
- 1.Afshar S., Farshid A. A., Heidari R., Ilkhanipour M.2008. Histopathological changes in the liver and kidney tissues of Wistar albino rat exposed to fenitrothion. Toxicol. Ind. Health 24: 581–586. doi: 10.1177/0748233708100090 [DOI] [PubMed] [Google Scholar]
- 2.Assad F., El-Sherif M. A.2002. Effect of drinking saline water and feed shortage on adaptive responses of sheep and camels. Small Rumin. Res. 45: 279–290. doi: 10.1016/S0921-4488(02)00083-4 [DOI] [Google Scholar]
- 3.Attia-Ismail S. A., Abdo A. R., Asker A. R. T.2008. Effect of salinity level in drinking water on feed intake, nutrient utilization, water intake and turnover and rumen function in sheep and goats. Egypt. J. Sheep Goats Sci. 3: 77–94. [Google Scholar]
- 4.Bancroft J. D., Gamble M.2008. Theory and practice of histological techniques book. Churchill Livingstone, New York /Elsevier. [Google Scholar]
- 5.Brauer R. W.1963. Liver circulation and function. Physiol. Rev. 43: 115–213. doi: 10.1152/physrev.1963.43.1.115 [DOI] [PubMed] [Google Scholar]
- 6.Buczinski S., Forté G., Francoz D., Bélanger A. M.2014. Comparison of thoracic auscultation, clinical score, and ultrasonography as indicators of bovine respiratory disease in preweaned dairy calves. J. Vet. Intern. Med. 28: 234–242. doi: 10.1111/jvim.12251 [DOI] [PMC free article] [PubMed] [Google Scholar]
- 7.Cepeda-Palacios R., Fuente-Gómez M. G., Ramírez-Orduña J. M., García-Álvarez A., Llinas-Cervantes X., Angulo C.2017. Effects of pregnancy and post-kidding stages on haematochemical parameters in cross-bred goats. J. Appl. Anim. Res. 3: 1–5. [Google Scholar]
- 8.Crilly J. P., Politis A. P., Hamer K.2017. Use of ultrasonographic examination in sheep veterinary practice. Small Rumin. Res. 152: 166–173. doi: 10.1016/j.smallrumres.2016.12.021 [DOI] [Google Scholar]
- 9.Ettinger S. J., Feldman E. C.2009. Textbook of Veterinary Internal Medicine. St. Louis, MO. Elsevier Health Sciences. [Google Scholar]
- 10.Grandin T.1994. Euthanasia and slaughter of livestock. J. Am. Vet. Med. Assoc. 204: 1354–1360. [PubMed] [Google Scholar]
- 11.Hernaez R., Lazo M., Bonekamp S., Kamel I., Brancati F. L., Guallar E., Clark J. M.2011. Diagnostic accuracy and reliability of ultrasonography for the detection of fatty liver: a meta-analysis. Hepatology 54: 1082–1090. doi: 10.1002/hep.24452 [DOI] [PMC free article] [PubMed] [Google Scholar]
- 12.Hiendleder S., Kaupe B., Wassmuth R., Janke A.2002. Molecular analysis of wild and domestic sheep questions current nomenclature and provides evidence for domestication from two different subspecies. Proc. Biol. Sci. 269: 893–904. doi: 10.1098/rspb.2002.1975 [DOI] [PMC free article] [PubMed] [Google Scholar]
- 13.Hubscher S. G.2011. Histological assessment of the liver. Medicine 39: 523–528. doi: 10.1016/j.mpmed.2011.06.006 [DOI] [Google Scholar]
- 14.Hussein H. A., Elrashidy M.2014. Ultrasonographic features of the liver with cystic echinococcosis in sheep. Vet. Rec. Open 1: e000004. doi: 10.1136/vropen-2013-000004 [DOI] [PMC free article] [PubMed] [Google Scholar]
- 15.Imran S., Tyagi S. P., Kumar A., Kumar A., Sharma S.2011. Comparative Ultrasonographic Imaging of Spleen and Liver in Healthy Crossbred Cows. ISRN Vet. Sci. 11: 1–7. doi: 10.5402/2011/419591 [DOI] [PMC free article] [PubMed] [Google Scholar]
- 16.Kii W. Y., Dryden G. M.2005. Effect of drinking saline water on food and water intake, food digestibility, and nitrogen and mineral balances of rusa deer stags (Cervus timorensis russa). Anim. Sci. 81: 99–105. doi: 10.1079/ASC41070099 [DOI] [Google Scholar]
- 17.Mdletshe Z. M., Chimonyo M., Marufu M. C., Nsahlai I. V.2017. Effects of saline water consumption on physiological responses in Nguni goats. Small Rumin. Res. 153: 209–211. doi: 10.1016/j.smallrumres.2017.06.019 [DOI] [Google Scholar]
- 18.Mpendulo C. T., Chimonyo M., Zindove T. J.2017. Influence of water restriction and salinity on feed intake and growth performance of Nguni does. Small Rumin. Res. 149: 112–114. doi: 10.1016/j.smallrumres.2017.02.002 [DOI] [Google Scholar]
- 19.Sallie R., Tredger J. M., Williams R.1991. Drugs and the liver. Part 1: Testing liver function. Biopharm. Drug Dispos. 12: 251–259. doi: 10.1002/bdd.2510120403 [DOI] [PubMed] [Google Scholar]
- 20.Scott P.2017. Abdominal ultrasonography as an adjunct to clinical examination in sheep. Small Rumin. Res. 152: 132–143. doi: 10.1016/j.smallrumres.2016.12.013 [DOI] [Google Scholar]
- 21.Solomon R., Miron J., Ben-Ghedalia D., Zomberg Z.1995. Performance of high producing dairy cows offered drinking water of high and low salinity in the Arava desert. J. Dairy Sci. 78: 620–624. doi: 10.3168/jds.S0022-0302(95)76672-3 [DOI] [PubMed] [Google Scholar]
- 22.Stevens L. A., Coresh J., Greene T., Levey A. S.2006. Assessing kidney function—measured and estimated glomerular filtration rate. N. Engl. J. Med. 354: 2473–2483. doi: 10.1056/NEJMra054415 [DOI] [PubMed] [Google Scholar]
- 23.Stevens L. A., Levey A. S., Spiegelman D.2005. Measurement of kidney function. Med. Clin. North Am. 89: 457–473. doi: 10.1016/j.mcna.2004.11.009 [DOI] [PubMed] [Google Scholar]
- 24.Streeter R. N., Step D. L.2007. Diagnostic ultrasonography in ruminants. Vet. Clin. North Am. Food Anim. Pract. 23: 541–574, vii. doi: 10.1016/j.cvfa.2007.07.008 [DOI] [PubMed] [Google Scholar]
- 25.Zeineldin M., Lowe J., de Godoy M., Maradiaga N., Ramirez C., Ghanem M., Abd El-Raof Y., Aldridge B.2017. Disparity in the nasopharyngeal microbiota between healthy cattle on feed, at entry processing and with respiratory disease. Vet. Microbiol. 208: 30–37. doi: 10.1016/j.vetmic.2017.07.006 [DOI] [PubMed] [Google Scholar]
- 26.Zein-Eldin M. M., Ghanem M. M., Abd El-Raof Y. M., El-Attar H. M., El-Khaiat H. M.2014. Clinical, Hematobiochemical and Ruminal changes during the onset and recovery of induced lactic acidosis in sheep. Biotechnol. Anim. Husb. 30: 647–659. doi: 10.2298/BAH1404647Z [DOI] [Google Scholar]
- 27.Zeineldin M. M., Lowe J. F., Grimmer E. D., de Godoy M. R. C., Ghanem M. M., Abd El-Raof Y. M., Aldridge B. M.2017. Relationship between nasopharyngeal and bronchoalveolar microbial communities in clinically healthy feedlot cattle. BMC Microbiol. 17: 138. doi: 10.1186/s12866-017-1042-2 [DOI] [PMC free article] [PubMed] [Google Scholar]