

Abstract
The mammalian runt-related factor 1 (RUNX1) is a master transcription factor that regulates lineage specification of hematopoietic stem cells. RUNX1 translocations result in the development of myeloid leukemias. Recently, RUNX1 has been implicated as a tumor suppressor in other cancers. We postulated RUNX1 expression may be associated with lung adenocarcinoma etiology and/or progression. We evaluated the association of RUNX1 mRNA expression with overall survival data from The Cancer Genome Atlas (TCGA), a publically available database. Compared to high expression levels, Low RUNX1 levels from lung adenocarcinomas were associated with a worse overall survival (Hazard Ratio = 2.014 (1.042 to 3.730 95% confidence interval), log-rank P=0.035) compared to those that expressed high RUNX1 levels. Further immunohistochemical examination of 85 surgical specimens resected at the University of Vermont Medical Center identified that low RUNX1 protein expression was associated with larger tumors (P=0.038). Gene expression network analysis was performed on the same subset of TCGA cases that demonstrated differential survival by RUNX1 expression. This analysis, which reveals regulatory relationships, showed that reduced RUNX1 levels were closely linked to upregulation of the transcription factor E2F1. To interrogate this relationship, RUNX1 was depleted in a lung cancer cell line that expresses high levels of RUNX1. Loss of RUNX1 resulted in enhanced proliferation, migration, and invasion. RUNX1 depletion also resulted in increased mRNA expression of E2F1 and multiple E2F1 target genes. Our data implicate loss of RUNX1 as driver of lung adenocarcinoma aggression, potentially through deregulation of the E2F1 pathway.
Keywords: RUNX, Runt related transcription factor, Non-small cell lung cancer, Adenocarcinoma
INTRODUCTION
Lung cancer is the leading cause of cancer related death in the United States [1]. Adenocarcinoma of the lung is the most common histology of lung cancer, accounting for approximately 50% of all lung cancers. Targeted therapy has resulted in significant improvement in time to progression for these cancers, but is available for only approximately 10% of patients [2]. Identifying novel, targetable pathways that drive lung adenocarcinoma development and progression is critical for the development of new therapies.
One group of candidate proteins that may potentially drive oncogenesis and progression in lung cancer are the mammalian runt-related transcription (RUNX) factors. This family of proteins have been implicated in the pathogenesis of a number of human cancers. RUNX1 mutations and translocations are well established as causes of myeloid leukemias [3], RUNX2 is most known for promoting breast and prostate cancers metastasis [4–7], while RUNX3 mutations are associated with gastric cancers [8, 9]. The RUNX transcription factors have been implicated in lung biology and pathology [10–14]. These factors bind DNA through the core-binding factor complex to either activate or repress gene transcription. RUNX family transcription factors are integral components of transforming growth factor beta (TGFβ) signaling and are implicated in cell cycle regulation, differentiation, apoptosis, and malignant transformation [15].
RUNX1 is classically associated with formation of a chimeric gene, leading to a fusion oncoprotein, and the development of acute myelogenous leukemia and myelodysplastic syndrome [15]. RUNX1 has been implicated as a tumor suppressor in breast cancer, for which the predominant histology is adenocarcinoma [16, 17]. We hypothesized that RUNX1 may play an important role in lung adenocarcinomas. To address this hypothesis, we evaluated RUNX1 expression in lung adenocarcinomas from two patient level datasets; The Cancer Genome Atlas (TCGA) and a lung cancer cohort at the University of Vermont, and determined the effects of RUNX1 knockdown on proliferation, migration, invasion, and gene expression in adenocarcinoma and normal lung cell models.
MATERIALS AND METHODS
Survival Analysis from The Cancer Genome Atlas (TCGA)
We utilized cBioPortal (cbioportal.org) to provide visualization and analysis of the publically available TCGA data set, established by the TCGA Research Network (http://cancergenome.nih.gov/). The cBioPortal is an open source software established as part of the National Cancer Institute TCGA Data Analysis Center and is a validated tool for analysis of these data [18, 19]. mRNA expression data obtained from lung adenocarcinomas within the TCGA data set was measured using RNA Seq V2 (Illumina, San Diego CA).
Gene Expression Analysis of TCGA datasets
Data was retrieved via download through the NCI Genomic Data Commons Data Portal (https://gdc-portal.nci.nih.gov/). Data retrieval was confined to individual patient gene expression (RNA-seq; fragments per kilobase per million reads – upper quartile normalized) and survival data for those patients in the lung adenocarcinoma (LUAD) cohort (n=492 at time of retrieval; November 16th, 2016). Patients were ranked and sorted based on RUNX1 transcript levels (Ensembl Gene ID: ENSG00000159216). Survival data for patients comprising the lower and upper 10th percentiles were analyzed using Prism 7 software (Graph Pad, La Jolla, CA). Global gene expression profiling was performed by comparing transcript levels between individuals in the upper and lower 10th percentiles. Gene set enrichment analysis was carried out using the GSEA software suite [20, 21] to identify genes whose expression correlates, either positively or negatively, with Runx1 expression in lung adenocarcinoma tumors. Global gene sets were parsed using a p-value cutoff of 0.05. P-values were corrected for multiple comparisons using the Holm-Sidak method implemented in Prizm 7. Parsed gene lists were analyzed using NetWalker software [22, 23] to perform hierarchical clustering and to identify enriched gene networks in identified clusters.
Patient sample collection from the University of Vermont Medical Center (UVMMC) Cohort
Surgically resected cases of lung adenocarcinoma with additional tumor tissue available were identified from a database maintained at UVMMC that is annotated with demographic, clinical, and pathologic data. All available cases from the two year period between 2012 and 2014 were included. However, complete survival data is not available for this cohort. More recent cases were not included due to the need to wait a minimum of two years to insure that additional tissue is not needed for clinical care. This secondary analysis of additional tumor tissue was approved by the University of Vermont Medical Center Office of Human Subjects Research Internal Review Board (IRB).
Immunohistochemistry
Under an IRB approved protocol, tissue microarrays containing paired tumor and adjacent normal tissue were created from surgically resected lung specimens performed for treatment of lung adenocarcinomas. Tissue microarrays (TMA) containing the tumor specimen and corresponding control was used for immunohistochemical study. TMA was embedded in paraffin, cut in 5μm cross sections, and mounted on Superfrost Plus slides. The sections were deparaffinised in xylene, and rehydrated through a graded series of ethanol solutions, and then washed with deionized (DI) water. Heat induced epitope retrieval was performed with Target Retrieval Solution (Dako North America; Cat# S169984-2) using a Decloaking Chamber pressure cooker (Biocare Medical, Concord, California, USA) at 105 °C for 15 minutes. Following the retrieval, the tissue sections were allowed to cool in the buffer for 20 minutes and then rinsed with Tris-buffered saline. Endogenous peroxidase was blocked in 3% hydrogen peroxide in methanol for 15 minutes and then rinsed with Tris-buffered saline. For RUNX1, antibody (1:250 dilution, rabbit monoclonal anti-human AML1 (D33G6), Cell Signaling Technology Cat# 4336P RRID:AB_10859035) was incubated overnight at 4 °C. All slides were stained with DAB chromogen system (Dako North America; Cat# K3468). The sections were then counterstained with haematoxylin and mounted. The stained slides were reviewed by a board certified pathologist and scored [24].
Tissue culture and reagents
Human bronchial epithelial cell line HBE (RRID:CVCL_0287) was a kind gift of Dr. Daniel Weiss (University of Vermont), and was maintained in BEGM media (Lonza,; Allendale, NJ). Human NSCLC lines NCI-H838 (RRID:CVCL_1594) and NCI-H1568 (RRID:CVCL_1476) were purchased from the NCI Division of Cancer Diagnosis and Treatment Tumor Repository (Operated by Charles River Laboratories, Inc.; Wilmington, MA), cell lines A549 (ATCC Cat# CCL-185, RRID:CVCL_0023), NCI-H292 (ATCC Cat# CRL-1848, RRID:CVCL_0455), NCI-H460 (ATCC Cat# HTB-177, RRID:CVCL_0459), and NCI-H1437 (ATCC Cat# CRL-5872, RRID:CVCL_1472) were obtained through the American Type Culture Collection (Manassas, VA), and lines NCI-H720 (RRID:CVCL_1583) and NCI-H1299 (RRID:CVCL_0060) were a kind gift of Dr. Jitesh Pratap (Rush University). All cancer cell lines were cultured in RPMI-1640 media supplemented with 10% fetal bovine serum (Cellgro-Corning Cat. No. 35-010-CV) and 1% penicillin/streptomycin (Hyclone-GE Cat. No. SV30079.01) and incubated in a 37 °C 5% CO2/95% air humidified incubator.
Lentiviral vector production, titer and transduction
Lentivirus-based human RUNX1-specific shRNA clones in the pGIPZ construct backbone were purchased from Open Biosystems/GE Dharmacon. Clones V2LHS_150256, V2LHS_150257, V2LHS_150259, V3LHS_367629, V3LHS_367631, and V3LHS_367633 were all screened for effectiveness in knocking down expression of RUNX1 in HBE and NCI-H292 (data not shown). Ultimately, clone V3LHS_367629 was shown to provide the greatest level and most reproducible knockdown of RUNX1 in both of these cell lines.
To generate lentiviral vectors, HEK293T cells (ATCC Cat# CRL-3216, RRID:CVCL_0063) were seeded at a density of 6.5 × 10⁶ cells per 15 cm dish in DMEM media 24 h prior to transfection. For transfection, 25 μg of pGIPZ:shRNA expression plasmid, 10 μg envelope plasmid pMD2.g (Addgene plasmid 12259, deposited by D. Trono) and 15 μg packaging plasmid psPAX2 (Addgene plasmid 12260, deposited by D. Trono) were transfected via calcium phosphate precipitation as previously described [25]. Media was replaced 4 h post-transfection. Approximately 16 h post-transfection, caffeine was added to the media to a final concentration of 4 mM [26]. Lentiviral particles were harvested 48 h post-transfection, filtered through 0.45 μm pore polyethersulfone filter and centrifuged at 20,000 × g, 15 °C, for 2 h. Pelleted lentiviral particles were resuspended in RPMI 1640 and stored at −80 °C. Titers of lentiviral vectors were determined by transducing 50,000 NCI-H292 in 0.5 mL growth media in 24 well plates with various dilutions of lentiviral supernatant and measuring the percentage of GFP positive cells by flow cytometry (Becton-Coulter Epics XL) 48 h post transduction.
Transduction of either NCI-H292 or HBE for stable Runx1 knockdown was performed by adding concentrated lentivirus to cells at a multiplicity of infection of 10 to 1 and allowing infection to proceed for 24 h under normal incubation conditions. Cells were washed with growth media and re-plated at a density of 1 × 10⁵ cells/mL to expand for 3 days. After 3 days of recuperation, positively transduced cells were selected by treatment with 1 μg/mL puromycin (InvivoGen, Inc., Cat. No. ant-pr-1). This concentration of puromycin showed no adverse effects on viability of transduced cells. Stable polyclonal cell lines were maintained in 0.5 μg/mL puromycin. All subsequent analyses (gene expression analysis, phenotype analysis) were performed within 2 weeks of transduction.
Western blotting
For preparation of protein lysates, cells were harvested, washed once in ice-cold phosphate buffered saline and resuspended in Direct Cell Lysis Buffer [10 mM Tris–HCl pH 6.8, 2% (w/v) sodium dodecyl sulfate, 2 M Urea, 10% (w/v) Glycerol, 0.5 mM EDTA, 1× Pierce Protease Inhibitor Cocktail (EDTA-free; Thermo Scientific, Cat. No. 88266) and 1 μM MG132 (Sigma, Cat. No. C2211). Lysates were incubated on ice for 10 min, sonicated briefly to reduce viscosity and centrifuged at 20,000 × g, 4◦C, 10 min to remove insoluble material. Lysates were assayed for total protein concentration using the Pierce Bicinchoninic Acid Protein Assay (Thermo Scientific, Cat. No. 23227) according to manufacturer’s instruction, with bovine serum albumin (Fisher Scientific, Cat. No. BP1605) dissolved in Direct Cell Lysis Buffer as a standard. After protein quantitation, dithiothreitol was added to a final concentration of 10 mM, and bromophenol blue to a final concentration of 0.025% (w/v). Samples were heated at 90 °C for 10 minutes and placed on ice. Samples were subjected to SDS-PAGE and western transfer using the Bio-Rad Any-kD Stain-free TGX™ system according to the manufacturer’s instructions. Gels and membranes were imaged using a Bio-Rad ChemiDoc XRS gel imaging system controlled by the Bio-Rad ImageLab software package implementing the Stain-free processing algorithms (Bio-Rad, Inc. Hercules, CA). Membranes were blocked in TBST (20 mM Tris-HCl pH 7.5, 150 mM sodium chloride, 0.5% (w/v) Tween-20) containing 5% (w/v) bovine serum albumin for 1 hour at room temperature. For detection of RUNX1, membranes were blocked and incubated with anti-RUNX1 antibody (Cell Signaling Technology Cat# 4336P Lot# RRID:AB_10859035) according to the manufacturers recommendations, and then incubated with goat anti-rabbit IgG-HRP conjugate (Thermo Scientific, Cat. No. 31460) at a concentration of 160 ng/mL in TBST + 1% bovine serum albumin for 1 hour at room temperature. Membranes were developed using Clarity enhanced chemiluminescent substrate (Bio-Rad, Inc., Cat. No. 1705061) and imaged as above.
Quantitative real-time PCR
Total RNA was isolated using RNeasy RNA purification kit (QIAGEN, Valencia, CA) according to the manufacturer’s instruction and quantitated using a NanoDrop 2000 (Thermo Scientific, Waltham, MA). For cDNA synthesis, 0.5 μg total RNA was reverse transcribed with the iScript reverse transcriptase systems system according to the manufacturer’s protocol (BioRad, Inc., Cat. No. 1708891). 1 μL of the reverse transcription reaction was combined with appropriate primers (Supplemental Table I) and qPCR reaction mix (iTaq Universal Sybr Green qPCR reagent, BioRad, Inc., Cat. No. 1725121). The reactions were carried out in a ViiA 7 Real Time PCR instrument (Applied Biosystems, Foster City, CA). Each primer pair was optimized to verify specificity by melting curve analysis and to ensure efficiency was >95%. Accordingly, data were then analyzed by the 2−ΔCt method as described [27].
Proliferation, migration and invasion assays
Cell proliferation was assessed using a tetrazolium reduction assay to monitor relative numbers of viable cells in culture. Freshly transduced cells were plated at a density of 2,500 cells per well of a 96 well tissue culture plate in a volume of 100 uL of growth media. Multiple plates were prepared at the day of plating to allow for data collection every 24 hours for at least 5 days. Immediately after plating, 20 μL of MTS assay reagent (CellTiter 96 Aqueous, Promega, Cat. No. G3581) was added to wells of the t=0h plate allowed to incubate at 37 °C for 2 hours. Colorimetric measurement of MTS reduction was performed using a Victor plate reader (Perkin-Elmer, Waltham, MA) at a wavelength of 490 nm. This procedure was then repeated every 24 hours with the additional plates. Absorbance values were used to determine cell numbers by interpolating from a standard curve prepared in parallel. Once cell growth curves were established, the data were fit to an exponential growth model (N = N0kT, where N equals cell number, N0 is cell number at t=0, k is the rate constant, and T is the independent variable (time)) to determine doubling times (T1/2 = ln(2/k)). For the purposes of modelling, all parameters were unconstrained; however, data sets were trimmed to only include the exponential growth phase of the growth curve. Differences in doubling times were analyzed for statistical significance using a two-tailed, unpaired T-test. Interpolation, non-linear curve fitting, and statistical analysis was performed using Prism 7 software (Graph Pad, La Jolla, CA).
Cell migration was assayed using a traditional wound closure assay. Stably transduced NCI-H292 were seeded at a density of 500,000 cells per well of a six well tissue culture plate in 2 mL of growth media. 24 hours after seeding, each well was scraped with a sterile beveled 200 μL pipette tip, rinsed with warmed DPBS to remove detached cells and debris, and replenished with reduced serum media (RPMI 1640 + 0.5% FBS. Images of scratched monolayers were collected at multiple time points using a Nikon Eclipse TS100 inverted microscope equipped with a Nikon Intensilight C HGFI pre-centered fiber illuminator and a Spot Imaging Solutions RT3 CCD camera. Scratch areas were measured using ImageJ software, computed as the number of pixels corresponding to scratch closure (Scratch closure = Scratch area at 0h – Scratch area at time t). Migration assays were analyzed from four independent experiments performed in technical duplicate. The rate of migration was determined by global fitting of all data sets to a linear model in which the slope is equal to the rate of migration. Differences in migration rates were analyzed for statistical significance using a two-tailed, unpaired T-test. Regression and statistical analysis were performed using Prism 7 software (GraphPad, La Jolla, CA).
Cell invasion was assayed using a trans-well assay incorporating a reconstituted basement membrane. Stably transduced NCI-H292 were suspended in serum-free growth media at a density of 40,000 cells per mL. Fully hydrated invasion chambers (BioCoat Growth Factor Reduced Matrigel, 24 well format; Corning, Cat. No. 354483) were placed in wells containing 750 μL of complete growth medium. Cell suspension (0.5 mL) was added to the upper chamber, and incubated for 24 hours at 37 °C. Media from the upper chamber was removed and the membrane surface was scrubbed extensively with the tip of a cotton swab to remove non-invading cells. Both surfaces of the invasion chamber were washed repeatedly with cold PBS. Invading cells were fixed in ice cold 100% methanol for 20 minutes and air dried. Invading cells were stained with a crystal violet staining solution (0.2 % (w/v) crystal violet in 2 % (v/v) ethanol for 20 minutes, washed three times with distilled water. Crystal violet retained by invading cells was extracted with 10 % (v/v) acetic acid and quantitated spectrophotometrically by measuring the absorbance at 595 nm. Invasion experiments were performed in biological and technical triplicate.
Statistical analysis
All statistical analyses were performed using STATA (Version 12, College Station, TX). P values less than or equal to 0.05 were considered significant and all statistical tests were two-sided. Student’s t-test was used to compare normally distributed data between categories. The Kruskal Wallis test was used to compare non-normally distributed data between categories. ANOVA was used to evaluate differences in continuous variable among more than two categories. Survival differences were estimated using the Kaplan-Meier method [28]. Simple linear regression was used to evaluate the relationship between continuous variables.
RESULTS
Lower RUNX1 mRNA Expression is Associated with Poorer Overall Survival in the TCGA
We first evaluated TCGA data to begin to assess if RUNX1 was associated with important outcomes in lung adenocarcinoma. This data set contains specimens from 520 patients diagnosed with lung adenocarcinoma and annotated with survival data. Although protein data is not available for RUNX1, mRNA expression is present for these tumor specimens. Dichotomizing to compare the lowest and highest ten percent of expression of RUNX1 revealed a significant difference.(Fig 1) Tumors with low RUNX1 expression were associated with a significantly worse overall survival compared to tumors with high RUNX1 expression (HR 2.014 [1.042 to 3.730], P=0.035).
Figure 1.
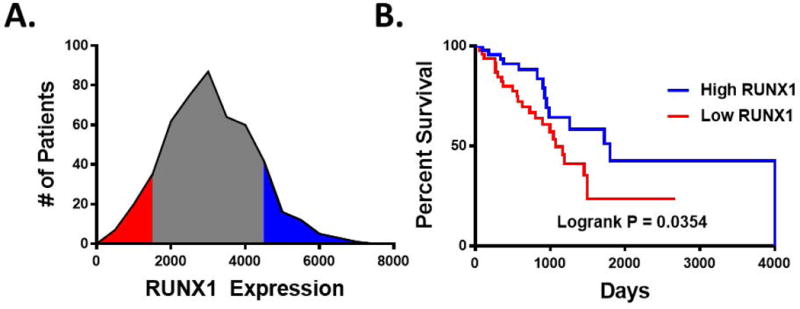
RUNX1 expression correlates with a survival benefit in LUAD patients. A, The TCGA-LUAD cohort was stratified for RUNX1 expression. A, RUNX1 (mRNA-Seq) expression distribution amongst this cohort identifies individuals in the upper (red) and lower (blue) 10th percentiles. B, Kaplan-Meyer analysis was performed comparing overall survival between High RUNX1 expressers (upper 10th percentile) and Low RUNX1 expressers (lower 10th percentile). Log-rank P value was calculated using the Mantel-Cox test. Median survival was determined to be 1,798 days for high expressers compared to 1,073 for low expressers.
Loss of RUNX1 Protein Expression is Associated with Larger Lung Adenocarcinomas in the UVMMC Cohort
To characterize the role of RUNX1, we evaluated 85 surgically resected lung adenocarcinomas from the University of Vermont Medical Center (UVMMC). Tissue microarrays were created and stained for RUNX1 protein expression. We found that RUNX1 protein expression by immunohistochemistry was lost in 59% of cases. Low RUNX1 protein expression was associated with female gender (Table 1) and a larger average tumor size (2.1 vs. 2.9 cm) based on measured pathologic diameter (P= 0.038, Fig 2). Tumor size was not associated with age, gender, or smoking status.
Table 1.
Relationship of Demographic Variables to RUNX1 Expression
| RUNXlow | RUNXhigh | P | |
|---|---|---|---|
| Age: (mean) | 63.9 | 65.6 | 0.49 |
| Gender: (n, %) | |||
| Female | 22 (45.8) | 26 (54.2) | |
| Male | 28 (73.7) | 10 (26.3) | 0.009 |
| Smoking: (n, %) | |||
| Never | 5 (71.4) | 2 (28.5) | |
| Former | 27 (52.9) | 24 (47.1) | |
| Current | 16 (61.5) | 10 (38.4) | 0.56 |
| Pack Years (mean, SD) | 42.8 (3.9) | 39.1 (3.7) | 0.50 |
Figure 2.
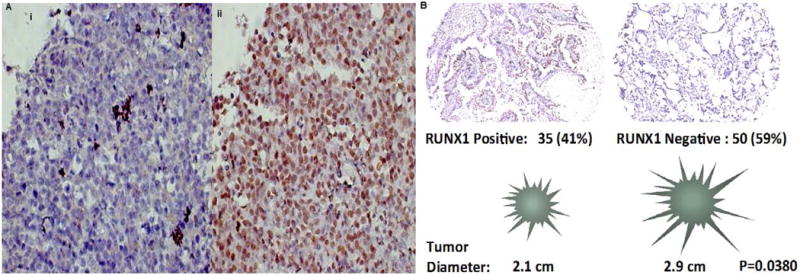
RUNX1 immunohistochemical staining of surgically resected lung adenocarcinomas. Panel A: Image (i) demonstrates immunohistochemial of the negative control. Image (ii) demonstrates significant RUNX 1 staining (brown) throughout the adenocarcinoma specimen. Panel B: The majority of the adenocarcinomas were RUNX1 negative (59%) and were associated with significantly larger pathologic tumor sizes (P=0.0380)
Lentiviral Depletion Results in Increased Proliferation, Migration, and Invasion in H292 Cells
To address the levels of RUNX1 expression among cancer cell lines, we screened a panel of established NSCLC cell lines for RUNX1 mRNA and protein expression. This analysis revealed that the majority of NSCLC cell lines show reduced expression of RUNX1 compared to the human bronchial epithelial cell line, HBE, which are transformed cells derived from normal bronchial epithelium. Although NCI-H1568 express high levels of RUNX1 mRNA, only very low levels of RUNX1 protein was detectable (Fig 3).
Figure 3.
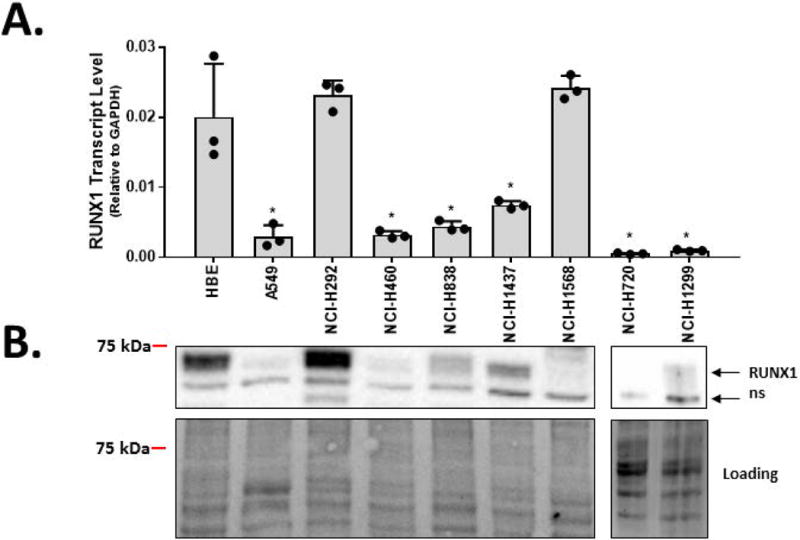
RUNX1 levels are reduced in multiple NSCLC cell lines. A, RUNX1 transcript levels were quantified by qRT-PCR in a normal human bronchial epithelial cell line (HBE) and a panel of NSCLC cell lines. Bars represent the means and standard deviations from three replicate cell preparations. B, RUNX1 protein levels were determined by western blot. Relative gel loading was assessed by using Bio-Rad StainFree™ technology (bottom panels). The band marked “ns” represents a non-specific staining band. In addition to HBE, RUNX1 transcript levels were elevated in cell lines NCI-H292 and NCI-H1568, however only RUNX1 protein levels were observed to be elevated in NCI-H292. Therefore, our subsequent studies focused on the NCI-H292 cancer cell line and the normal epithelial-like HBE cell line. Bars represent mean ± s.d. from triplicate experiments. T-tests were performed to determine statistical significance (*P<0.05).
We next determined the effect of RUNX1 depletion on phenotypic properties in normal bronchial epithelium and transformed cell types. Lentiviral-mediated RNAi knockdown of RUNX1 was performed in both NCI-H292 and HBE since both cell lines display robust expression of RUNX1. This approach produced substantial knockdown of RUNX1 at the protein level in both NCI-H292 and HBE (Figure 4A) and resulted in an increased growth rate (decreased doubling time) compared to controls (Figure 4B, and 4C, respectively). The effects of RUNX1 knockdown on the migratory and invasive properties of NCI-H292 was subsequently evaluated. RUNX1 knockdown in NCI-H292 resulted in a 2-fold increase in the migratory rate (Figure 4D), as determined by quantitative scratch-closure assay. The Matrigel Trans-well invasion assay demonstrated that knockdown of RUNX1 also caused an increase in the invasiveness of NCI-H292 (Figure 4E). Since HBE cells retain features of contact inhibition and differentiation, they could not be subjected to scratch-based migration, or invasion assays. Taken together, these results show that RUNX1 influences the cancer phenotype by restricting proliferation properties of both normal and cancer cell types, and through loss of RUNX1, NSCLC cells gain proliferative, migratory, and invasive properties.
Figure 4.
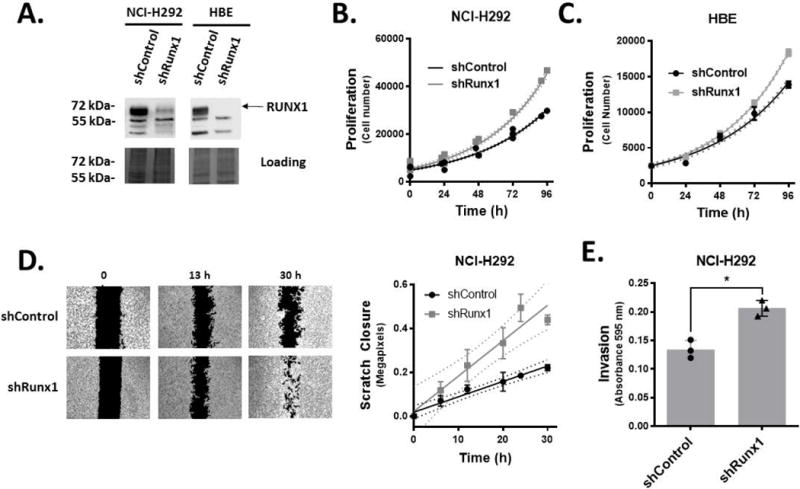
Knockdown of RUNX1 enhances proliferation of NSCLC and normal bronchial epithelial cells, and the migratory and invasive phenotype of NSCLC cell line NCI-H292. A, Lentiviral delivery of control shRNA or shRNA targeting RUNX1 shows stable knockdown of RUNX1 in NCI-H292 and HBE by western blot. Cell proliferation studies by MTS assays show that RUNX1 knockdown in NCI-H292 (B) and HBE (C) increases proliferation rate. Best-fit doubling times for shControl and shRUNX1 were determined to be 36.35 (34.29 to 38.68; 95% CI) and 31.63 (29.44 to 34.18) hours, respectively (P=0.0101). D, Migratory capacity as a consequence of RUNX1 knockdown in NCI-H292 was determined using conventional scratch assays. Scratch closure values were fit to a linear equation to quantitate migration rates, and shows RUNX1 knockdown increases rate of migration in NCI-H292. Best-fit values for closure rates were determined to be 7.004 (5.372 to 8.636; 95% CI) and 16.13 (9.996 to 22.26) pixels per hour for shControl and shRunx1, respectively (P=0.004). E, Matrigel transwell assays show increased invasion capacity when RUNX1 is depleted in NCI-H292. Crystal violet dye was extracted from stained invading cells (through a millipore membrane and quantities determined by spectrophotometry. Symbols and bars represent mean ± s.d. from a minimum of triplicate experiments. In panel E, data points represent values obtained for individual biological replicates. A Student’s t-test was performed to determine statistical significance (*P<0.05).
RUNX1 Depletion Variably Effects Markers of Cell Cycle Progression and Epithelial to Mesenchymal Transition
To provide further evidence of direct effects in lung adenocarcinoma, we evaluated changes in mRNA expression among candidate genes (Fig 5). CDKN2B encodes the cyclin-dependent kinase 4 inhibitor B protein, also known as multiple tumor suppressor 2, which has been implicated in the progression and survival of lung cancer [29–32]. Knockdown of RUNX1 resulted in a significant decrease in CDKN2B mRNA expression in both NCI-H292 and HBE. Given that our clinical data demonstrated a survival difference we also evaluated SCGB1A1, which has been associated with differences in early stage adenocarcinoma survival [33]. RUNX1 knockdown resulted in decreased mRNA expression of SCGB1A1 in both HBE and NCI-H292, a change that correlates with the known effect of low SCGB1A1 and poor overall survival. We also initially evaluated markers of epithelial to mesenchymal transition, e-cadherin (CDH1) and vimentin (VIM). RUNX1 knockdown did not result in clear correlative changes in mRNA expression in these marks.
Figure 5.
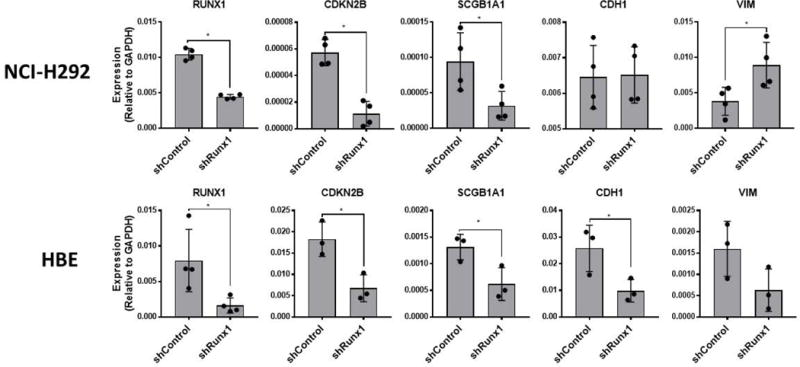
RUNX1 depletion in NCI-H292 and HBE results in alteration of multiple genes implicated in NSCLC. NCI-H292 and HBE transfected with lentivirus expressing control-, or Runx1-specific shRNA were analyzed by qRT-PCR to assess consequential changes in expression levels of genes shown to be important for several aspects of LAc pathogenesis. Data points represent values obtained for individual biological replicates. Bars represent mean ± s.d. from a minimum of triplicate experiments. T-tests were performed to determine statistical significance (*P<0.05).
Low RUNX1 mRNA Expression is Associated with E2F1 in Network Analysis of the TCGA
Given that RUNX1 knockdown did not result in consistent changes in mRNA expression of targets associated with EMT we chose to explore potential RUNX1 targets using an unbiased survey of the publicly available TCGA dataset. To perform this analysis we stratified the LUAD cohort based on RUNX1 expression in the same manner as that performed for survival analysis. Comparison of transcript levels in tumors expressing low and high levels of RUNX1 revealed a cohort of genes displaying differential expression. Unbiased hierarchical clustering analysis of this gene set identified two major groups (denoted Clusters I and II; Figure 6A). Visual examination of these clusters revealed that Cluster II represented genes that are upregulated in patients who exhibit low RUNX1 expression. Knowledge-based gene network analysis using NetWalker software was performed and yielded a regulatory network profile as shown in Figure 6B, where we observed the E2F1 transcription factor as a major node of regulation for other genes in the cluster. An independent gene set enrichment analysis (GSEA) performed without any gene parsing also yielded E2F targets as a highly enriched Hallmark with a low false discovery rate (Figure 6C). Collectively, this approach suggests that a gene expression program governed by the transcription factor E2F1 may arise from pathological loss of RUNX1 expression that occurs in LUAD patients with poor prognosis.
Figure 6.
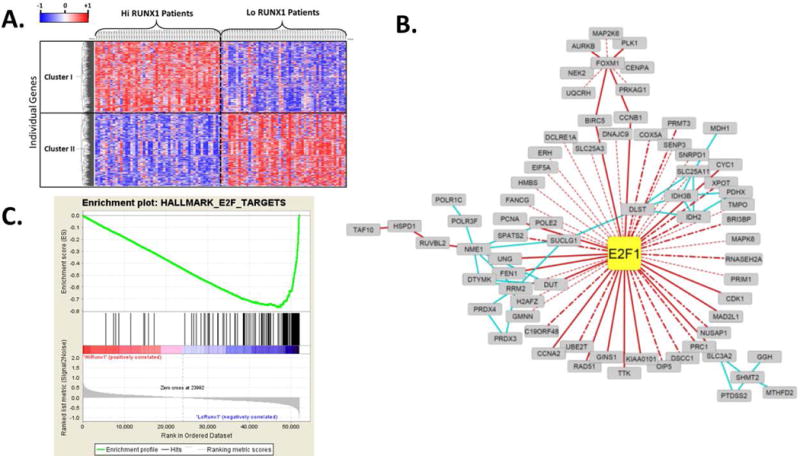
Low RUNX1 expression in lung adenocarcinoma correlates with a phenotype driven by an E2F1-directed gene program. A, Differential gene expression analyses between Low (lower 10th percentile) and High (upper 10th percentile) RUNX1 expressers was performed using unbiased hierarchical clustering. Individual genes displaying significant (adjusted P value < 0.05) were submitted for analysis. Based on this approach, two major clusters, denoted Cluster I and Cluster II, were identified. B, Netwalk analysis reveals E2F1 as a major node of regulation for a large subset of genes that are upregulated in patients with low RUNX1 expression (cluster II). Solid red lines denote gene regulation interactions; dotted red lines denote predicted gene regulation interactions; dot-hashed red lines denote ENCODE identified interactions; blue lines denote metabolic reaction interactions. C, An independent Gene Set Enrichment Analysis that included all genes in the dataset (no filtering based on statistical significance was performed) also identified an E2F1 network as being enriched in patients with low RUNX1 expression (Normalized enrichment score −3.67, family-wise error rate P <0.0001).
RUNX1 Depletion Results in an Increase in mRNA Expression in E2F1 and known E2F1 Target Genes
To further assess E2F1 as a potential RUNX1 target, we evaluated changes in E2F1 and demonstrated E2F1 target genes in the NCI-H292 and HBE cell models (Fig 7). By comparing the RUNX1 knockdown cells to their controls, we demonstrated that RUNX1 depletion leads to increased E2F1 expression in both cell models. Further, known E2F1 target genes that were identified through the TCGA network analysis: CDK1, CDCA3, BIRC5, AURKB, H2AZ1 were also validated by qPCR expression. All these genes demonstrated increased expression following RUNX1 depletion in NCI-H292. In HBE, these gene expression changes resulting from RUNX1 knockdown were confined to E2F1, CDK1 and H2AZ1. Our results show that targeted loss of RUNX1 is sufficient to influence E2F1 and its associated gene targets.
Figure 7.
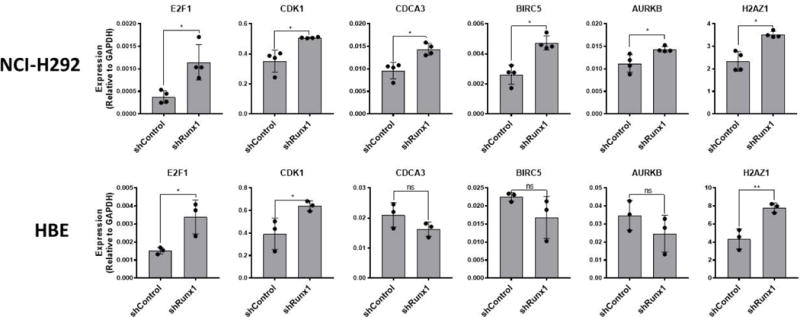
RUNX1 depletion in NCI-H292 and HBE results in an increase in E2F1 and associated target genes. NCI-H292 and HBE transfected with lentivirus expressing control-, or Runx1-specific shRNA were analyzed by qRT-PCR to assess consequential changes in expression levels of E2F1 canonical target genes, and those identified to be negatively correlated with RUNX1 expression in LUAD patients through bioinformatic analysis. Data points represent values obtained for individual biological replicates. Bars represent mean ± s.d. from triplicate experiments. T-tests were performed to determine statistical significance (*P<0.05).
DISCUSSION
In this report, loss of RUNX1 was related to important clinical outcomes and initial mechanistic investigations point toward a critical role in proliferation, migration, and invasion. This finding is consistent with known effects of RUNX1 in other cancers and consistent with the role of a molecule known to be a “master regulator” of transcription [17, 34].
As an initial analysis, we first evaluated the association of RUNX1 mRNA expression and survival from the publicly available TCGA. Adenocarcinomas with the lowest 10% of expression of RUNX1 were associated with a significantly worse survival compared to those with the highest 10% of RUNX1 expression, implying a potentially important role for RUNX1. However, as malignancies become less well-differentiated loss of normal transcriptional regulation may occur [35]. To address this limitation and the fact that comprehensive protein expression data is not available from the TCGA, we evaluated the association of RUNX1 protein expression and tumor size from the UVMMC cohort. Loss of RUNX1 expression was associated with larger tumors. Tumor size is a well-known predictor of survival and one of the key components of lung cancer staging [36]. The difference we found is clinically significant. Making a simple assumption of a tumor as a sphere, loss of RUNX1 expression would be associated with 62% larger lung adenocarcinomas.
In order to more mechanistically evaluate these clinical-epidemiologic associations we used RUNX1 lentiviral knockdown in a clinically relevant cell model of lung cancer. Depletion of RUNX1 resulted in increased proliferation, migration, and invasion; all features of an aggressive cancer phenotype and consistent with the epidemiologic and pathologic associations we previously observed. We initially explored a panel of genes associated with aggressive lung adenocarcinoma phenotypes to attempt to gain insight into a possible mechanistic explanation. RUNX1 expression has been demonstrated to inhibit EMT in breast cancer cells [17]. Assay of vimentin and e-cadherin, markers that are effected by RUNX1 in breast cancer cells, did not result in a clear relationship between RUNX1 and EMT in NCI-H292 lung cancer cells. We subsequently chose to leverage our prior findings of differential survival due to differences in RUNX1 mRNA expression in the TCGA. Using an unbiased approach, we identified E2F1 as a potential RUNX1 target. We subsequently validated that RUNX1 knockdown in a cell model system results in increased expression of E2F1 and multiple E2F1 target genes.
E2F activators are a family of transcription factors involved in cell cycle regulation and DNA synthesis. In fact, increased E2F1 has been associated with poor prognosis in NSCLC [37, 38]. RUNX1 is known to target miR-223, a micro-RNA that can drive E2F1 regulation in acute myelogenous leukemia [39, 40]. It remains unknown if this same pathway is an important regulator of oncogenesis in lung cancer. Our data imply clinical importance given the difference in survival based on RUNX1 mRNA expression in the TCGA lung adenocarcinoma cohort and the finding of larger tumors associated with low RUNX1 protein expression in the UVMMC cohort. A linkage between RUNX1 and E2F1 in promoting cell proliferation through E2F1, was described in leukemia [41]. Further evaluation of the linkage between RUNX1 and E2F1 in lung will require multimodal interrogation of regulatory crosstalk mechanisms that employ these factors. For example, RUNX1 may interact with E2F1 directly or through indirect genetic mechanisms, regulation of miRNA 223, or other epigenetic mechanisms. While these future directions are beyond the scope of the current study, we believe the data presented here provide a strong basis for further investigation of RUNX1 mechanisms in lung cancer.
The goal of our study was to identify if RUNX1 plays a clinically important role in lung adenocarcinoma and lay the foundation for valuable translational investigation. While loss of RUNX1 has been associated with breast [16, 17] and prostate [42][43] cancers, our findings in lung have identified a key role for RUNX1 not previously reported in lung cancer. We show the loss of RUNX1 is a driver of aggressiveness and prognosis in lung adenocarcinoma, phenotypes that may be mediated through E2F1 pathways that support proliferation.
Supplementary Material
Acknowledgments
Grant Support:
Lake Champlain Cancer Research Organization/Vermont Cancer Center Translational Grant Award 2014
Footnotes
The authors have no conflicts of interest to declare.
References
- 1.Siegel RL, Miller KD, Jemal A. Cancer statistics, 2015. CA Cancer J Clin. 2015;65(1):5–29. doi: 10.3322/caac.21254. [DOI] [PubMed] [Google Scholar]
- 2.Herbst RS, Heymach JV, Lippman SM. Lung cancer. N Engl J Med. 2008;359(13):1367–80. doi: 10.1056/NEJMra0802714. [DOI] [PMC free article] [PubMed] [Google Scholar]
- 3.Lam K, Zhang DE. RUNX1 and RUNX1-ETO: roles in hematopoiesis and leukemogenesis. Frontiers in bioscience : a journal and virtual library. 2012;17:1120–1139. doi: 10.2741/3977. [DOI] [PMC free article] [PubMed] [Google Scholar]
- 4.Barnes GL, et al. Osteoblast-related transcription factors Runx2 (Cbfa1/AML3) and MSX2 mediate the expression of bone sialoprotein in human metastatic breast cancer cells. Cancer Res. 2003;63(10):2631–7. [PubMed] [Google Scholar]
- 5.Pratap J, et al. The Runx2 Osteogenic Transcription Factor Regulates Matrix Metalloproteinase 9 in Bone Metastatic Cancer Cells and Controls Cell Invasion. Molecular and Cellular Biology. 2005;25(19):8581–8591. doi: 10.1128/MCB.25.19.8581-8591.2005. [DOI] [PMC free article] [PubMed] [Google Scholar]
- 6.Akech J, et al. Runx2 association with progression of prostate cancer in patients: mechanisms mediating bone osteolysis and osteoblastic metastatic lesions. Oncogene. 2009;29(6):811–821. doi: 10.1038/onc.2009.389. [DOI] [PMC free article] [PubMed] [Google Scholar]
- 7.Wysokinski D, Blasiak J, Pawlowska E. Role of RUNX2 in Breast Carcinogenesis. Int J Mol Sci. 2015;16(9):20969–93. doi: 10.3390/ijms160920969. [DOI] [PMC free article] [PubMed] [Google Scholar]
- 8.Guo WH, et al. Inhibition of growth of mouse gastric cancer cells by Runx3, a novel tumor suppressor. Oncogene. 2002;21(54):8351–5. doi: 10.1038/sj.onc.1206037. [DOI] [PubMed] [Google Scholar]
- 9.Li QL, et al. Causal Relationship between the Loss of RUNX3 Expression and Gastric Cancer. Cell. 2002;109(1):113–124. doi: 10.1016/s0092-8674(02)00690-6. [DOI] [PubMed] [Google Scholar]
- 10.Tandon M, et al. Runx2 mediates epigenetic silencing of the bone morphogenetic protein-3B (BMP-3B/GDF10) in lung cancer cells. Mol Cancer. 2012;11 doi: 10.1186/1476-4598-11-27. [DOI] [PMC free article] [PubMed] [Google Scholar]
- 11.Li H, et al. Clinical significance of RUNX2 expression in patients with nonsmall cell lung cancer: a 5-year follow-up study. Tumour Biol. 2013;34(3):1807–12. doi: 10.1007/s13277-013-0720-4. [DOI] [PubMed] [Google Scholar]
- 12.Hsu YL, et al. Lung Tumor-associated Osteoblast-derived Bone Morphogenetic Protein-2 Increased Epithelial-to-Mesenchymal Transition of Cancer by Runx2/Snail Signaling Pathway. Journal of Biological Chemistry. 2011;286(43):37335–37346. doi: 10.1074/jbc.M111.256156. [DOI] [PMC free article] [PubMed] [Google Scholar]
- 13.Lee KS, et al. Runx3 is required for the differentiation of lung epithelial cells and suppression of lung cancer. Oncogene. 2010;29(23):3349–61. doi: 10.1038/onc.2010.79. [DOI] [PubMed] [Google Scholar]
- 14.Lee YS, et al. Runx3 inactivation is a crucial early event in the development of lung adenocarcinoma. Cancer Cell. 2013;24(5):603–16. doi: 10.1016/j.ccr.2013.10.003. [DOI] [PubMed] [Google Scholar]
- 15.Ito Y. Oncogenic potential of the RUNX gene family: ‘overview’. Oncogene. 2004;23(24):4198–208. doi: 10.1038/sj.onc.1207755. [DOI] [PubMed] [Google Scholar]
- 16.Janes KA. RUNX1 and its understudied role in breast cancer. Cell Cycle. 2011;10(20):3461–5. doi: 10.4161/cc.10.20.18029. [DOI] [PMC free article] [PubMed] [Google Scholar]
- 17.Hong D, et al. Runx1 stabilizes the mammary epithelial cell phenotype and prevents epithelial to mesenchymal transition. Oncotarget. 2017;8(11):17610–17627. doi: 10.18632/oncotarget.15381. [DOI] [PMC free article] [PubMed] [Google Scholar]
- 18.Cerami E, et al. The cBio cancer genomics portal: an open platform for exploring multidimensional cancer genomics data. Cancer Discov. 2012;2(5):401–4. doi: 10.1158/2159-8290.CD-12-0095. [DOI] [PMC free article] [PubMed] [Google Scholar]
- 19.Gao J, et al. Integrative analysis of complex cancer genomics and clinical profiles using the cBioPortal. Sci Signal. 2013;6(269):l1. doi: 10.1126/scisignal.2004088. [DOI] [PMC free article] [PubMed] [Google Scholar]
- 20.Mootha VK, et al. PGC-1alpha-responsive genes involved in oxidative phosphorylation are coordinately downregulated in human diabetes. Nat Genet. 2003;34(3):267–73. doi: 10.1038/ng1180. [DOI] [PubMed] [Google Scholar]
- 21.Subramanian A, et al. Gene set enrichment analysis: a knowledge-based approach for interpreting genome-wide expression profiles. Proc Natl Acad Sci U S A. 2005;102(43):15545–50. doi: 10.1073/pnas.0506580102. [DOI] [PMC free article] [PubMed] [Google Scholar]
- 22.Komurov K, White MA, Ram PT. Use of data-biased random walks on graphs for the retrieval of context-specific networks from genomic data. PLoS Comput Biol. 2010;6(8) doi: 10.1371/journal.pcbi.1000889. [DOI] [PMC free article] [PubMed] [Google Scholar]
- 23.Komurov K, et al. NetWalker: a contextual network analysis tool for functional genomics. BMC Genomics. 2012;13:282. doi: 10.1186/1471-2164-13-282. [DOI] [PMC free article] [PubMed] [Google Scholar]
- 24.Camp RL, Neumeister V, Rimm DL. A decade of tissue microarrays: progress in the discovery and validation of cancer biomarkers. J Clin Oncol. 2008;26(34):5630–7. doi: 10.1200/JCO.2008.17.3567. [DOI] [PubMed] [Google Scholar]
- 25.Marino MP, Luce MJ, Reiser J. Small- to large-scale production of lentivirus vectors. Methods Mol Biol. 2003;229:43–55. doi: 10.1385/1-59259-393-3:43. [DOI] [PubMed] [Google Scholar]
- 26.Ellis BL, Potts PR, Porteus MH. Creating higher titer lentivirus with caffeine. Hum Gene Ther. 2011;22(1):93–100. doi: 10.1089/hum.2010.068. [DOI] [PMC free article] [PubMed] [Google Scholar]
- 27.Livak KJ, Schmittgen TD. Analysis of relative gene expression data using real-time quantitative PCR and the 2(-Delta Delta C(T)) Method. Methods. 2001;25(4):402–8. doi: 10.1006/meth.2001.1262. [DOI] [PubMed] [Google Scholar]
- 28.Mantel N, Haenszel W. Statistical aspects of the analysis of data from retrospective studies of disease. J Natl Cancer Inst. 1959;22(4):719–48. [PubMed] [Google Scholar]
- 29.Kim TM, et al. Genome-wide screening of genomic alterations and their clinicopathologic implications in non-small cell lung cancers. Clin Cancer Res. 2005;11(23):8235–42. doi: 10.1158/1078-0432.CCR-05-1157. [DOI] [PubMed] [Google Scholar]
- 30.Schuster K, et al. Nullifying the CDKN2AB locus promotes mutant K-ras lung tumorigenesis. Mol Cancer Res. 2014;12(6):912–23. doi: 10.1158/1541-7786.MCR-13-0620-T. [DOI] [PMC free article] [PubMed] [Google Scholar]
- 31.Tomizawa Y, et al. Prognostic significance of allelic imbalances on chromosome 9p in stage I non-small cell lung carcinoma. Clin Cancer Res. 1999;5(5):1139–46. [PubMed] [Google Scholar]
- 32.Zhao Y, et al. Association of copy number loss of CDKN2B and PTCH1 with poor overall survival in patients with pulmonary squamous cell carcinoma. Clin Lung Cancer. 2011;12(5):328–34. doi: 10.1016/j.cllc.2011.02.007. [DOI] [PubMed] [Google Scholar]
- 33.Ludovini V, et al. Gene identification for risk of relapse in stage I lung adenocarcinoma patients: a combined methodology of gene expression profiling and computational gene network analysis. Oncotarget. 2016;7(21):30561–74. doi: 10.18632/oncotarget.8723. [DOI] [PMC free article] [PubMed] [Google Scholar]
- 34.Scheitz CJ, Tumbar T. New insights into the role of Runx1 in epithelial stem cell biology and pathology. J Cell Biochem. 2013;114(5):985–93. doi: 10.1002/jcb.24453. [DOI] [PMC free article] [PubMed] [Google Scholar]
- 35.Lee TI, Young RA. Transcriptional regulation and its misregulation in disease. Cell. 2013;152(6):1237–51. doi: 10.1016/j.cell.2013.02.014. [DOI] [PMC free article] [PubMed] [Google Scholar]
- 36.Chansky K, et al. The International Association for the Study of Lung Cancer Staging Project: prognostic factors and pathologic TNM stage in surgically managed non-small cell lung cancer. J Thorac Oncol. 2009;4(7):792–801. doi: 10.1097/JTO.0b013e3181a7716e. [DOI] [PubMed] [Google Scholar]
- 37.Gao Z, et al. Expression and prognostic value of E2F activators in NSCLC and subtypes: a research based on bioinformatics analysis. Tumour Biol. 2016;37(11):14979–14987. doi: 10.1007/s13277-016-5389-z. [DOI] [PubMed] [Google Scholar]
- 38.Huang CL, et al. E2F1 overexpression correlates with thymidylate synthase and survivin gene expressions and tumor proliferation in non small-cell lung cancer. Clin Cancer Res. 2007;13(23):6938–46. doi: 10.1158/1078-0432.CCR-07-1539. [DOI] [PubMed] [Google Scholar]
- 39.Pulikkan JA, et al. Cell-cycle regulator E2F1 and microRNA-223 comprise an autoregulatory negative feedback loop in acute myeloid leukemia. Blood. 2010;115(9):1768–78. doi: 10.1182/blood-2009-08-240101. [DOI] [PMC free article] [PubMed] [Google Scholar]
- 40.Rossetti S, Sacchi N. RUNX1: A microRNA hub in normal and malignant hematopoiesis. Int J Mol Sci. 2013;14(1):1566–88. doi: 10.3390/ijms14011566. [DOI] [PMC free article] [PubMed] [Google Scholar]
- 41.Meyers S, Hiebert SW. Indirect and direct disruption of transcriptional regulation in cancer: E2F and AML-1. Crit Rev Eukaryot Gene Expr. 1995;5(3–4):365–83. doi: 10.1615/critreveukargeneexpr.v5.i3-4.70. [DOI] [PubMed] [Google Scholar]
- 42.Farina NH, et al. A microRNA/Runx1/Runx2 network regulates prostate tumor progression from onset to adenocarcinoma in TRAMP mice. Oncotarget. 2016;7(43):70462–70474. doi: 10.18632/oncotarget.11992. [DOI] [PMC free article] [PubMed] [Google Scholar]
- 43.Takayama K, et al. RUNX1, an androgen- and EZH2-regulated gene, has differential roles in AR-dependent and -independent prostate cancer. Oncotarget. 2015;6(4):2263–76. doi: 10.18632/oncotarget.2949. [DOI] [PMC free article] [PubMed] [Google Scholar]
Associated Data
This section collects any data citations, data availability statements, or supplementary materials included in this article.