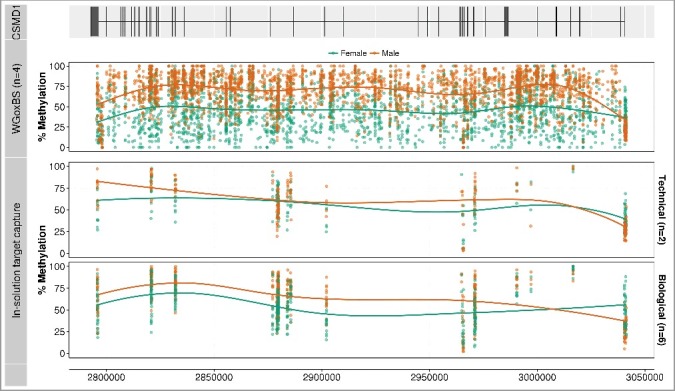
Figure 4.

Methylation profiles of the 3’ region of the CSMD1 locus. The figure focuses on the 3’ end of CSMD1, where the 20 differentially methylated 5 kb regions (8:2,795,000-3,020,000) are located. The first track shows the gene structure of CSMD1—the exons are represented by vertical lines and the introns by a horizontal line. The second panel displays methylation profiles from the WGoxBS samples, where each dot represents one CpG site for each individual (male in orange and female in green). The third panel shows the same samples analyzed by in-solution target capture. The fourth panel shows independent biological replicate samples analyzed using in-solution capture. Placental WGoxBS samples show hypomethylation in females (green), which is technically and biologically validated using an in-solution target capture method. The figure is drawn using ggbio Bioconductor package [17].
