Abstract
The feline model of Niemann-Pick disease, type C1 (NPC1) recapitulates the clinical, neuropathological, and biochemical abnormalities present in children with NPC1. The hallmarks of disease are the lysosomal storage of unesterified cholesterol and multiple sphingolipids in neurons, and the spatial and temporal distribution of Purkinje cell death. In feline NPC1 brain, microtubule-associated protein 1 light chain 3 (LC3) accumulations, indicating autophagosomes, were found within axons and presynaptic terminals. High densities of accumulated LC3 were seen in subdivisions of the inferior olive, which project to cerebellar regions that show the most Purkinje cell loss, suggesting that autophagic abnormalities in specific climbing fibers may contribute to the spatial pattern of Purkinje cell loss seen. Biweekly intrathecal administration of 2-hydroxypropyl-beta cyclodextrin (HPβCD) ameliorated neurological dysfunction, reduced cholesterol and sphingolipid accumulation, and increased lifespan in NPC1 cats. LC3 pathology was reduced in treated animals suggesting that HPβCD administration also ameliorates autophagic abnormalities. This study is the first to (i) identify specific brain regions exhibiting autophagic abnormalities in any species with NPC1, (ii) provide evidence of differential vulnerability among discrete brain nuclei and pathways, and (iii) show the amelioration of these abnormalities in NPC1 cats treated with HPβCD.
Keywords: Autophagy, Axonal degeneration, Cerebellar degeneration, LC3, Lysosomal storage disease, Neurodegeneration, Neuronal pathway
INTRODUCTION
Niemann-Pick disease, type C (NPC) is a progressive, inherited disorder characterized by cerebellar ataxia, cognitive impairment, seizures, supranuclear gaze palsy, dysphagia, hepatic disease, and death typically by 20 years of age (1, 2). Over 350 disease-causing mutations have been identified in either the NPC1 or NPC2 genes (3). NPC1 and NPC2 proteins work in concert to facilitate egress of unesterified cholesterol and glycosphingolipids from the endosomal/lysosomal compartment to the Golgi apparatus, plasma membrane, and endoplasmic reticulum (4, 5). Dysfunction of either protein results in lysosomal storage of unesterified cholesterol and multiple sphingolipids along with impaired export of lipoprotein-derived cholesterol (1).
Brain histology of affected NPC1 patients and animal models demonstrates widespread neuronal cytoplasmic vacuolization, axonal spheroid formation, and Purkinje cell loss (6). Four studies using mouse models have concluded that Purkinje cell death is a “cell autonomous” process (7). The first, using a chimeric model of NPC1 in which subsets of Purkinje and glial cells expressed either wild-type or mutant NPC1, identified that wild-type Purkinje cells survived when surrounded by mutant NPC1 cells, and that the death of mutant NPC1 Purkinje cells was not prevented by neighboring wild-type cells (8). The second study, using a Pcp2-Cre transgene in which Npc1 was deleted only in postdevelopmental Purkinje cells, demonstrated that loss of the protein was sufficient to cause the anterior-to-posterior death of Purkinje cells previously described in Npc1−/− mice (9). The third study, using tamoxifen-regulated Cre recombinase conditional knockouts of Npc1 in either astrocytes (GFAP-CreERT2) or in neurons (Synapsin I-Cre) showed that NPC1 loss in neurons but not in astrocytes resulted in motor impairment and severe brainstem axonal spheroid formation (10). Finally, the fourth study, using Tet-inducible Npc1-YFP transgenic mouse lines in which Npc1 was expressed in specific neuronal populations, in astrocytes, or in visceral tissue, showed that Npc1 overexpressed specifically in Purkinje cells resulted in cell survival (11).
Abnormal autophagy has been implicated as the cause of Purkinje death in NPC1 by electron microscopic evidence of increased numbers of autophagic vacuoles containing cytoplasmic contents, and by immunoblots showing increased autophagosomal membrane protein lipidated microtubule-associated protein 1 light chain 3 (LC3-II) in Npc1−/− mouse cerebellum (8, 12, 13). Macroautophagy is the process by which organelles, protein aggregates, and other cytosolic elements are delivered to lysosomes for degradation. In somatic cells, this process is induced under nutrient poor or otherwise stressed conditions. Initiation of autophagy leads to the generation of a double-membrane hemispheric structure termed a phagophore that engulfs cellular cargo and closes to form a spherical autophagosome. Cytosolic microtubule-associated protein 1 light chain 3 (LC3-I) is conjugated to phosphatidylethanolamine and forms LC3-II that binds to the autophagosomal membrane; LC3-II is therefore a marker of autophagosomes. The autophagosome fuses with late endosomes and/or multivesicular bodies forming an amphisome that, in turn, fuses with a lysosome to become an autolysosome (sometimes called an autophagolysosome) where cargo degradation occurs (14, 15). Constitutive autophagy is part of the normal physiology of neurons. Autophagosomes form in the distal axon and mature into autolysosomes as they are retrogradely transported to the soma (16). In addition to a general housekeeping role, neuronal autophagy has been shown to be crucial for the development, function and maintenance of synapses (17). Defective autophagy results in neuronal degeneration (18, 19).
We investigated the distribution of LC3 accumulation in the brains of cats homozygous for a missense mutation in NPC1. Naturally-occurring feline NPC1 closely resembles the biochemistry, pathology, and clinical presentation of juvenile onset NPC1 in patients (6, 20–25), and is caused by a missense mutation (C955S) in a cysteine-rich region commonly mutated in patients. Untreated affected cats die by 6 months of age. This NPC1 cat model accelerated the translation of the small molecule 2-hydroxypropyl-beta-cyclodextrin (HPβCD) from experiments in the mouse model to therapy in children by providing critical information on route of delivery, scaling of dose, and adverse events (26, 27). NPC1 cats treated with HPβCD develop no signs of cerebellar dysfunction and live to more than 3 years of age (26, 27). LC3 accumulation in untreated NPC1 cat brain was found within specific subdivisions of the inferior olivary nuclei and afferents to the olives. Climbing fibers from the inferior olivary nuclei synapse on the primary dendrites of Purkinje cells and are topographically arranged with specific subregions of the olive projecting to specific regions of the cerebellar cortex. Indeed, much of what is known about olivocerebellar projections was revealed by studies in the cat (28–35). The pattern of LC3 accumulation in the subdivisions of the inferior olives of NPC1 cat brain strongly correlated with the spatial and temporal pattern of Purkinje cell loss. We next evaluated the brains of NPC1 cats treated with HPβCD and we describe the amelioration of LC3 accumulation in the inferior olivary nuclei and the survival of Purkinje cells associated with therapy.
MATERIALS AND METHODS
Animals
All cats were raised in the Referral Center for Animal Models of Human Genetic Disease of the School of Veterinary Medicine of the University of Pennsylvania (NIH OD P40-10939) under National Institutes of Health and USDA guidelines for the care and use of animals in research. The experimental protocol was approved by the University’s Institutional Animal Care and Use Committee. The Referral Center maintains breeding colonies of cats with naturally occurring genetic disorders including NPC1, α-mannosidosis (AMD), mucopilidosis (MLII), and mucopolysaccharidosis type VII (MPSVII). Peripheral blood leukocytes from kittens produced in each breeding colony were tested using a polymerase chain reaction-based DNA test at 1 day of age for homozygosity for the disease-causing mutation (resulting in affected cats) or for absence of the disease-causing mutation (resulting in control cats). Cats homozygous for an NPC1 missense mutation develop NPC1 (20); cats homozygous for the MAN2B1 4 base pair deletion develop AMD (36); cats homozygous for a GNPTAB nonsense mutation develop MLII (37); and cats homozygous for a GUSB missense mutation develop MPS VII (38). Untreated NPC1 cats were euthanized at end-stage (24 ± 4 weeks of age) when they could no longer remain sternally recumbent (27). Additional cats were killed as described in the results below. Euthanasia was performed using an overdose of intravenous barbiturate. Immediately prior to euthanasia, cats were given an intravenous dose of 200 U heparin to prevent clotting during the tissue harvest. After death, animals were perfused through the left ventricle with 750 mL of 0.9% cold saline, which exited through an outlet made in the right atrium. After perfusion, tissue samples were collected, sectioned, and dropped-fixed in 4% paraformaldehyde for 48 hours. All sections were paraffin-embedded.
To treat NPC1 cats, 2-hydroxypropyl-beta-cyclodextrin (HPβCD-C0926; Sigma Aldrich, St. Louis, MO) was administered in a 20% (weight/volume) solution dissolved in 0.9% saline (Hospira, Inc., Lake Forest, IL) at a dose of 120 mg per cat. Treated cats received HPβCD intrathecally at the cerebellomedullary cistern every 14 days beginning at 3 weeks of age. All intracisternal dosing was performed in cats anesthetized with propofol (up to 6 mg/kg intravenously; Abbott Laboratories, Chicago, IL) (27).
For histology, a total of 27 untreated NPC1 cats and 10 normal control cats were evaluated histologically (Table). Twelve untreated NPC1 cats and 10 normal control cats were evaluated at approximately 6 months of age (except where otherwise indicated), which represent end-stage disease (26, 27). Additionally, NPC1 cats were evaluated at 1–7 weeks of age (n = 6), 11–13 weeks of age (n = 4), and 16–19 weeks of age (n = 5). NPC1 cats that received HPβCD intrathecally at the cerebellomedullary cistern every 14 days beginning at 3 weeks of age were evaluated at approximately 6 months old (n = 3) and approximately 30 months old (n = 3). Finally, a small number of cats with MPSVII (n = 2), MLII (n = 1), and AMD (n = 3) were evaluated.
TABLE.
Summary of Age, Treatment Group, and Number of Cats Evaluated Histologically
| Animal | Age (weeks) | Treatment | Number of Cats |
|---|---|---|---|
| Normal control | 22–34 | Untreated | 10 |
| NPC1 | 1–7 | Untreated | 6 |
| NPC1 | 11–13 | Untreated | 4 |
| NPC1 | 16–19 | Untreated | 5 |
| NPC1 | 20–29* | Untreated | 12 |
| NPC1 | 27, 28, 31† | HPβCD 120 mg IT | 3 |
| NPC1 | 70, 121, 138‡ | HPβCD 120 mg IT | 3 |
| MPS VII | 25, 91 | Untreated | 2 |
| ML II | 18 | Untreated | 1 |
| AMD | 20, 21, 27 | Untreated | 3 |
AMD, α-mannosidosis; HPβCD, 2-hydroxypropyl-β cyclodextrin; IT, bi-weekly intrathecal administration; ML II, mucolipidosis II; MPS VII, mucopolysaccharidosis type VII; NPC1, Niemann-Pick disease type C1.
Three 20-week-old cat specimens, serially sectioned through the inferior olive at 120-µm intervals, were used for quantification of LC3-indicated pathology in subregions of the olive at 15 caudal-to-rostral levels.
Grouped as “30-week” in text.
Grouped as “>70-week” in text.
Immunofluorescence and Immunohistochemistry
The following primary antibodies were used for LC3, anti-LC3B (rabbit monoclonal IgG, 1:3000, antibody 3868, Cell Signaling Technologies, Beverly, MA) and anti-MAP LC3B (mouse monoclonal IgG2b, 1:1000, sc-271625, Santa Cruz Biotechnology, Dallas, TX); for neurofilament, antineurofilament light rabbit polyclonal IgG, 1:1500, AB9568, Millipore, Billerica, MA); for neuronal perikarya and dendrites, anti-MAP2 (chicken polyclonal IgY, 1:3000, CH22103, Neuromics, Edina, MN), for microglia, anti-Iba1 (goat polyclonal IgG, 1:300, ab5076, Abcam, Cambridge, MA); for Purkinje cells, anticalbindin D-28k (rabbit polyclonal IgG, 1:3500, Swant, Marly, Switzerland); for myelin, antimyelin basic protein (MBP) (mouse monoclonal IgG1, 1:1000, Abcam ab24567); for α-synuclein, anti-α-synuclein (mouse monoclonal IgG1, 1:1000, MA1-90342, ThermoFisher, Waltham, MA). Sections were deparaffinized through xylenes and graded ethanols and antigen retrieval was performed in a microwave using Antigen Retrieval Citra Solution (BioGenex, Fremont, CA). For immunofluorescence, antibodies were diluted in Antibody Diluent Reagent Solution (Invitrogen, Grand Island, NY) and incubated for 60 minutes at 37°C. Unbound primary antibodies were washed off with PBS and the sections were then incubated for 30 minutes at 37°C with Alexafluor 568- and 488-conjugated secondary antibodies (Invitrogen, Carlsbad, CA). DAPI was applied and the slides were mounted in Mounting Medium for Fluorescent Microscopy (KPL, Gaithersburg, MD). The protocol for immunohistochemistry also included the following steps prior to the primary antibody incubation: Endogenous peroxidases were quenched in 3% hydrogen peroxide and endogenous biotin was blocked using the Avidin-Biotin blocker (Vector Labs, Burlingame, CA). Following primary incubation, species appropriate biotinylated secondary antibodies (Vector Labs) were applied and incubated for 30 minutes at 37°C. Horseradish peroxidase was linked to the secondary antibodies using the Vector Elite ABC kit (Vector Labs); signal detection was done using a DAB kit (Vector Labs). Sections were dehydrated through ethanol and xylene and mounted in Cytoseal XYL (Richard-Allan Scientific, Kalamazoo, MI). All immunofluorescence and immunohistochemical experiments included no primary, secondary-only negative control slides.
Two antibodies, one a rabbit monoclonal and the other a mouse monoclonal, raised against the N-terminal region of LC3B were used in this study. Both antibodies generated identical staining patterns in control and affected tissue and were used interchangeably for dual immunofluorescence (depending upon the host species of the second primary antibody in the experiment). The rabbit antibody was used for immunohistochemistry because of its somewhat greater signal intensity.
Images were obtained using either a Leitz DMRBE microscope configured for brightfield, fluorescence and differential interference contrast via a Retiga-2000DC CCD camera (QImaging, Surrey, BC, Canada) controlled by IVision software (Biovision Technologies, Inc., Exton, PA), or an Olympus IX83 configured for brightfield, fluorescence, differential interference contrast and equipped with a motorized X, Y, Z stage and a spinning disk confocal head (X-Light V2, Crestoptics s.r.l., Rome, Italy) via a Hamamatsu R2 cooled CMOS camera (Hamamatsu City, Japan) controlled by MetaMorph software (Molecular Devices, LLC, Sunnyvale, CA).
Quantification and Statistical Analysis of LC3 Colabeling with Calbindin and with Neurofilament in Cerebellar Axonal Spheroids
Pairs of adjacent sections were taken from the anterior cerebella of 4 approximately 25-week-old NPC1 cats. One of each of the pairs was fluorescently costained for LC3 and calbindin while the other was costained for LC3 and neurofilament. Six identical 20×-fields were imaged for each specimen resulting in 24 LC3/calbindin and 24 matched LC3/neurofilament fields. Signal overlap of LC3 with calbindin or of LC3 with neurofilament in each field was determined using the “Measure Colocalization” function of MetaMorph software (Molecular Devices, LLC), where each of the 2-color channels in an image is individually thresholded (binerized) and then compared with the other to calculate percent signal colocalization. The statistical difference between LC3/calbindin and LC3/neurofilament colocalization was assessed with GraphPad Prism (GraphPad Software, Inc., La Jolla CA) using the Student t-test.
Quantification and Statistical Analysis of LC3 Pathology in the Inferior Olive
Transverse serial sections through the inferior olive of 3 20-week-old NPC1 cats were taken at 120-µm intervals and immunohistochemically stained for LC3. LC3 stained sections from each of the specimens at each identified caudal-to-rostral level of the olive were imaged at 5× under the same conditions. Regions of interest ([ROIs]; i.e. subdivisions within the olive) were identified and analytical software, iVision (Biovision Technologies, Inc.), was used to segment (binerize) the darkly stained pathology within the ROIs. Sections from HPβCD-treated cats (30-week survival group, n = 3 and >70 week-survival group, n = 3), similarly representing various levels of the olive, were also analyzed. Pathology was reported as a percentage ± SE of the total area of the ROI and tabulated. One morphologically defined level (×) was chosen for statistical analysis of the differences between the olivary subdivisions in the untreated group compared with cats treated with HPβCD. Significance was assessed with GraphPad Prism using a 2-way ANOVA with a Bonferroni post-test.
Western Blot
Fresh frozen brains were homogenized using an OMNI TH International tissue homogenizer for 20 seconds in a solution of RIPA (Teknova, ON, Canada) with complete protease inhibitor (ThermoFisher) and 0.625 mg/mL N-ethylmaleimide (Sigma). Protein concentrations were determined by DC-protein assay (Bio-Rad, Hercules, CA) and 50 (p62) or 20 (LC3) µg/well of protein was loaded onto a 4%–12% gradient Bis-Tris gel with MES running buffer (Invitrogen). Protein was transferred to Immobilon-P 0.45 µm PVDF (Merck Millipore) and immunoreactivity detected with ECL (ThermoFisher). The following antibodies were used: LC3 1:1000 (NSJ, San Diego, CA), GAPDH 1:2000 (Novus, Littleton, CO), and p62 1:500 (NSJ). Band intensity was calculated using ImageJ and normalized to GAPDH. Significance was assessed with GraphPad Prism using the Student t-test feature.
RESULTS
Western Blot Analysis of LC3 in Control and NPC1 Cat Brain
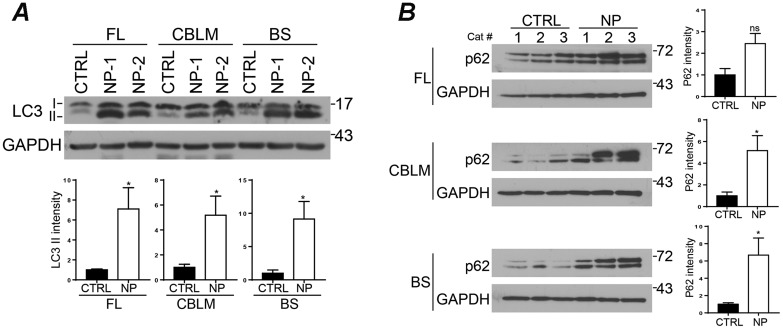
During autophagy, cytosolic LC3-I is activated by conjugation to phosphatidylethanolamine (lipidation) becoming LC3-II and is bound to autophagosomal membranes. LC3 antibodies recognize both isoforms but the relative amounts of the 2 can be determined based on their differential electrophoretic mobility. We examined LC3 expression in brain tissue from 24-week-old control and NPC1 cats. This analysis revealed a significant (p < 0.05) accumulation of LC3-II in frontal lobe, cerebellum and brainstem of NPC1 cats compared with controls (Fig. 1A). Similarly, we detected significantly (p < 0.05) increased levels of p62 in NPC1 cat cerebellum and brainstem; the same trend was observed in the frontal lobe, but failed to achieve statistical significance due to variability between samples (Fig. 1B). The accumulation of both LC3 and p62 in NPC1 cat brain suggests an impairment of autophagic flux, as has been observed in other disease models.
FIGURE 1.
LC3 and p62 protein levels in NPC1 cat brains. (A, B) Total lysates from frontal lobe (FL), cerebellum (CBLM), and brainstem (BS) from normal control (CTRL 1–3) and NPC1 (NP 1–3) cats. In contrast to control cats, NPC1 cats have a significant increase in LC3-II in all brain regions (A) and p62 in the cerebellum and brainstem (B). Quantitative data are ±SE. Student t-test (A) n = 4 (CTRL), 5 (NPC), (B) n = 3. n.s., not significant, *p ≤ 0.05.
Immunohistochemical and Immunofluorescence Analysis of LC3 in Control Cat Brain
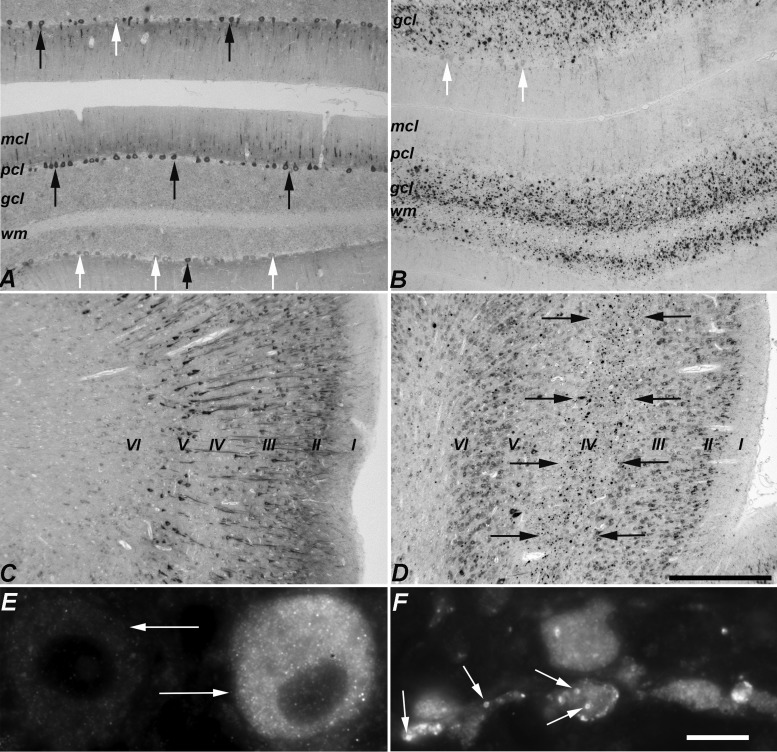
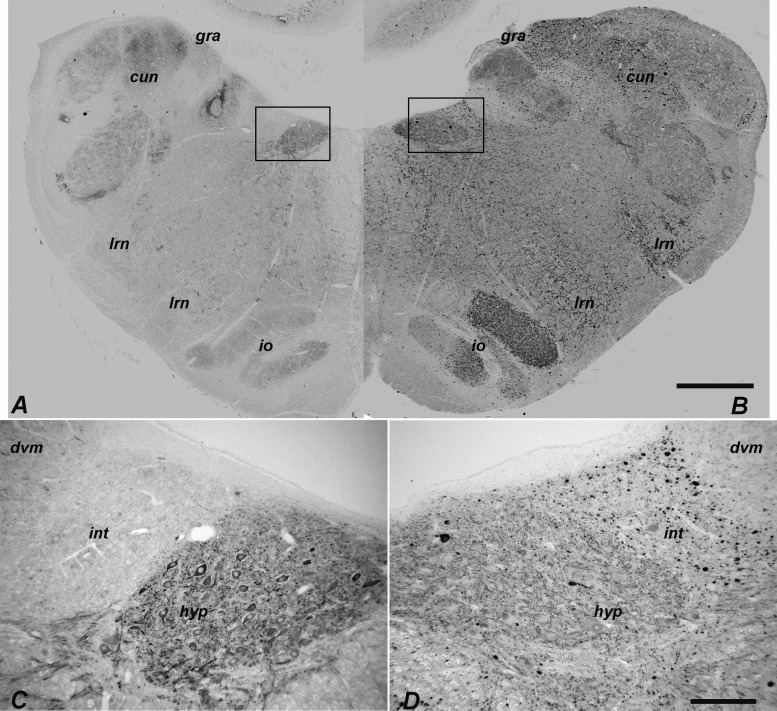
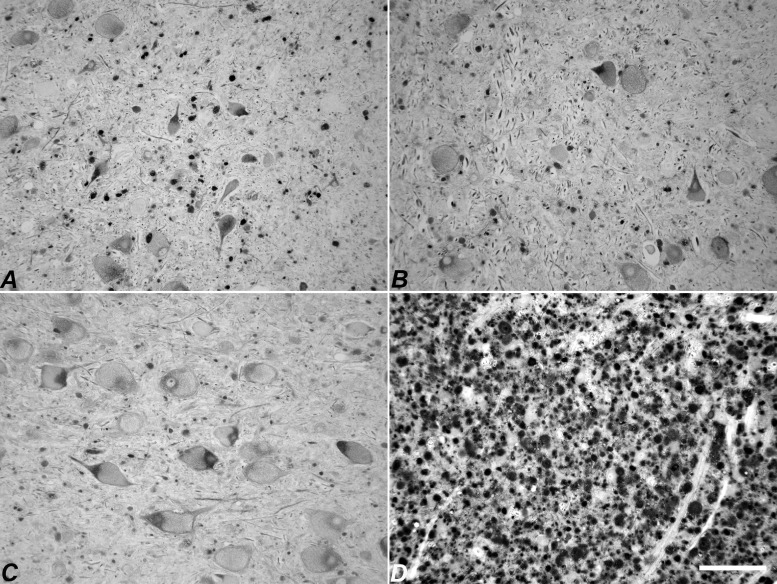
LC3 staining was not seen in the majority of neurons of 6-month-old control cats (comparable in age to end-stage NPC1 cats). The neurons that were labeled tended to be medium or large neurons (e.g. Purkinje cells, pyramidal neurons in the cerebral cortex, brainstem neurons), with expression limited to perikarya and proximal neurites (Figs. 2A, C, 3A, C). In the cerebellar cortex, LC3 staining was present in a subpopulation of Purkinje cells (Fig. 2A). In the cerebral cortex, staining was found principally in the neurons of layers II, III and V (Fig. 2C). In the brainstem, nearly all neuronal perikarya in some nuclei were immunoreactive while adjacent nuclei were negative (Fig. 3A, C). LC3 staining was diffuse in neuronal soma with a fine granular appearance (Fig. 2E). Axonal and synaptic expression of LC3 was not identified in control cats.
FIGURE 2.
Comparison of LC3 immunohistochemistry between normal control and NPC1 cat cerebellar and cerebral cortices. (A) Control cerebellar cortex: diffuse cytoplasmic staining was seen in some Purkinje cell perikarya and proximal dendrites (black arrows) but others were unstained (white arrows). (B) NPC1 cerebellar cortex: aggregates were seen in the granular cell layer and in the white matter. A few surviving Purkinje cells were detected but perikarya did not stain for LC3 (white arrows). Little LC3-indicated pathology was seen in the molecular cell layer. (A) and (B) images were taken of the anterior vermis. (C) Control cerebral cortex: heterogeneity was seen with more heavily-labeled neurons in layers II, III, and V. (D) NPC1 cerebral cortex. In the anterior lateral gyrus, labeled aggregates were found in the internal granular layer (IV) indicated by the black arrows. (E) Two adjacent Purkinje cells (arrows) in control cerebellum showing differential LC3 immunostaining. The diffuse, fine granular staining found in control brain is seen in the cell on the right. (F) In NPC1, small annular structures staining for LC3 are readily found in pathologic accumulations in the cerebellar granular cell layer (arrows). mcl, molecular cell layer; pcl, Purkinje cell layer; gcl, granular cell layer; wm, white matter. Scale bars: (A–D) 500 µm; (E, F) 10 µm.
FIGURE 3.
Comparison of LC3 immunohistochemistry between normal control and NPC1 cat brainstem. (A, B) Low-magnification image of control medulla (A) juxtaposed with that of NPC1 medulla (B) at approximately the same rostro-caudal level. The generally pale, diffuse labeling in control stands in sharp contrast to the darkly labeled puncta and aggregates seen in NPC1 cats. (C, D) Differential labeling of individual neuronal perikarya and distinct neuronal nuclei was seen in control brain (shown in C, a higher magnification image of the boxed area in A). LC3-indicated pathology was also variable among neuronal nuclei; some appeared unaffected while others were mildly to severely impacted. An example of this is demonstrated between the nucleus intercalatus and the hypoglossal or dorsal vagal motor nucleus in NPC1 brain (D, a higher magnification image of the boxed area in B). gra, gracile nucleus; cun, cuneate nucleus; lrn, lateral reticular nucleus; io, inferior olive, dvm, dorsal vagal motor nucleus; int, nucleus intercalatus; hyp, hypoglossal nucleus. Scale bars: (A, B) 1 mm; (C, D) 200 µm.
Immunohistochemical and Immunofluorescence Analysis of LC3 in NPC1 Cat Brain
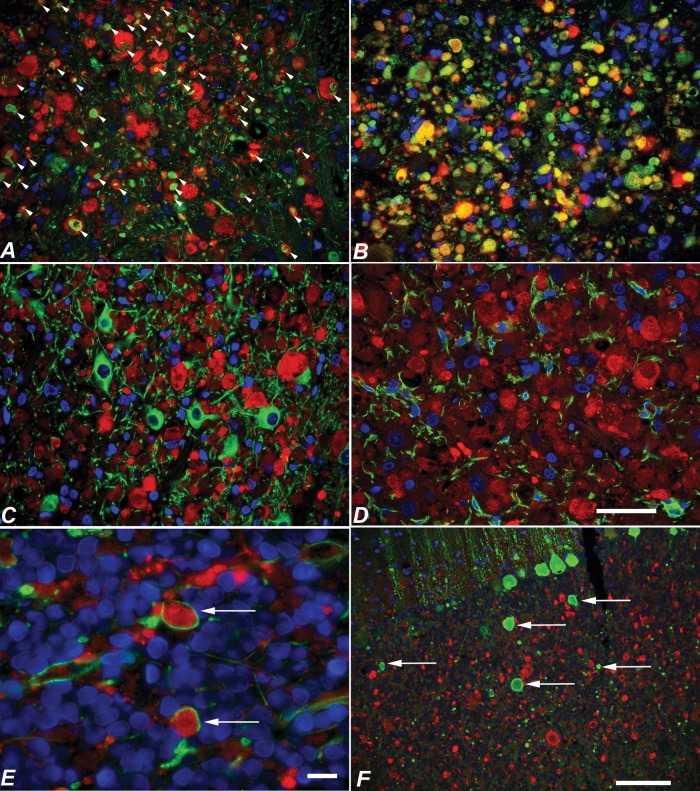
In 6-month-old NPC1 cats (end-stage disease), LC3 labeling appeared as polymorphic accumulations of both diffuse as well as clearly defined annularly shaped puncta (Fig. 2F). Accumulation was seen within distended axons and in presynaptic terminals; in contrast to control cats, accumulations were not seen within neuronal perikarya or dendrites (Figs. 2B, D, 3B, D). LC3 localization within axons was evidenced by its association with the axonal marker neurofilament-light (NFL) (Fig. 4A) and with the presynaptic marker α-synuclein (Fig. 4B). Within axonal spheroids, LC3 puncta were seen surrounded by MBP (Fig. 4E). In contrast, LC3 was not present within neuronal cell bodies or dendrites as evidenced by its lack of association with the neuronal cell body/dendrite marker MAP2 (Fig. 4C), nor was it found within microglia (Fig. 4D). Details on the distribution of LC3 accumulation within specific brain regions are provided below.
FIGURE 4.
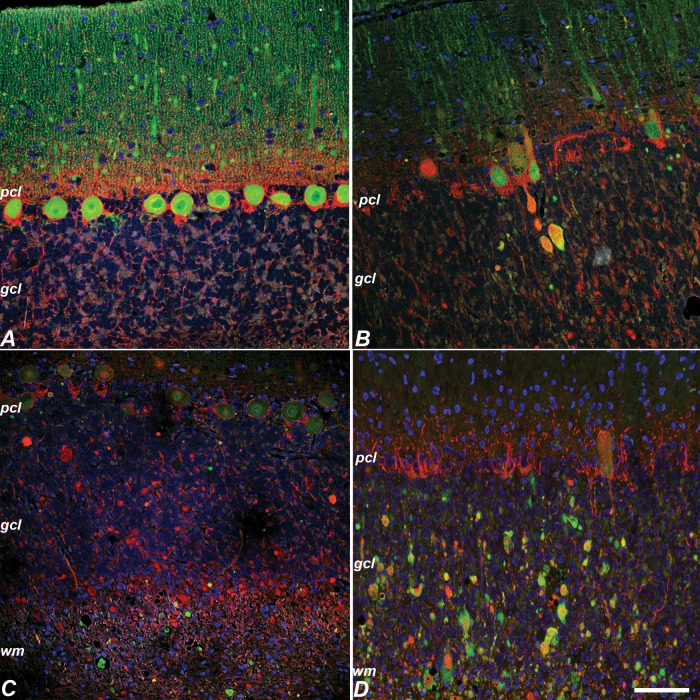
Costaining of LC3 with neurofilament, α-synuclein, MAP2, Iba1, MBP, and calbindin in NPC1 cat brain. (A–F) LC3 (red in all images) colocalized with axonal and presynaptic markers neurofilament (arrowheads in A) and α-synuclein (yellow in B), but did not colocalize with MAP2-positive neuronal perikayra or dendrites (C) or glial marker Iba1 (D). LC3 accumulations were seen bounded by MBP (arrows in E). Calbindin-labeled axonal spheroids in the cerebellum (arrows) did not colabel for LC3 (F). Scale bars: (A–D), 50 µm; (E) 10 µm; (F) 100 µm.
NPC1 Cerebral Cortex
LC3 puncta were consistently detected in axons and presynaptic terminals within the lateral gyrus (located dorsal to the cingulate gyrus), where they were largely confined to lamina IV (Fig. 2D). With this exception, pathologic LC3 immunoreactivity was not seen in the cerebral cortex.
NPC1 Cerebellar Cortex
NPC1 is characterized by severe Purkinje cell loss that is readily visible by decreased numbers of calbindin-positive cells. In the NPC1 cat, as has also been described in the NPC mouse (39), Purkinje cell loss began in the anterior vermis and, over time, spread posteriorly and laterally into the cerebellar hemispheres (Supplementary Data Fig. S1). The nodulus (lobule X) remained unaffected even at end-stage disease. LC3 accumulation was concentrated in axons and presynaptic terminals of the granular cell layer and white matter (Fig. 2B) within the regions of greatest Purkinje cell loss (lobules I–IV; Supplementary Data Fig. S2B, D).
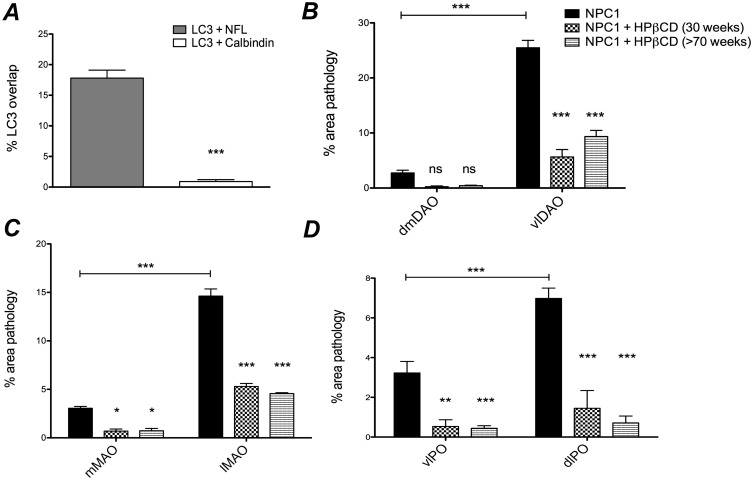
Although degenerating Purkinje cells were associated with axonal spheroid formation, most swollen axons found in the cerebellar cortex and white matter were NFL-positive and calbindin-negative (Figs. 4F, 5C, D), suggesting that most the axonal spheroids did not arise from Purkinje cells and were likely afferent in origin. The percentages of LC3-labeled spheroids that colabeled with either calbindin or neurofilament were quantified (Fig. 6A), and showed that the frequency of LC3-neurofilament colabeling was significantly greater than LC3-calbindin colabeling (p < 0.001). The association of disrupted autophagy and axonal degeneration in NFL-positive, but not in calbindin-positive axonal swellings suggests different degenerative mechanisms may be occurring in different neuronal populations. Only rarely did NFL and calbindin localize to the same axons (Fig. 5B).
FIGURE 5.
Neurofilament labeling in normal control and NPC1 cat cerebellar cortex. (A) Neurofilament (red in all panels) was not detected in control Purkinje cells (calbindin, green). (B) In NPC1, rare neurofilament and calbindin colabeling was seen in Purkinje axon swellings (calbindin, green). (C, D) However, most axonal swellings were neurofilament-positive and calbindin-negative (calbindin, green) (C). The great majority of neurofilament positive swellings colabeled with LC3 (LC3, green) (D). pcl, Purkinje cell layer; gcl, granular cell layer; wm, cerebellar white matter. Scale bar: 100 µm.
FIGURE 6.
Quantification of LC3 colocalization with neurofilament versus calbindin in NPC1 cerebellar axonal spheroids, and quantification of LC3 pathology in the inferior olive at Brodal level X of untreated NPC1 and HPβCD-treated NPC1 cats. (A) The incidence of LC3 colocalization with either calbindin or with neurofilament was measured from pairs of images representing identical microscopic fields from the anterior cerebellum of NPC1 cats (n = 4). Significantly more colocalization with neurofilament was seen (p < 0.001). (B) The area occupied by aberrant LC3 staining in untreated NPC1 (n = 3), HPβCD-treated 30-week-old NPC1 (n = 3) and HPβCD-treated >70-week-old NPC1 (n = 3) cats was measured and then calculated as a percent of the total area within each olivary subdivision. In the dorsal accessory olive, significantly (p < 0.001) more pathology was seen in the ventrolateral region (vlDAO) compared with the dorsomedial region (dmDAO) of untreated NPC1 cats (horizontal bar). Both groups of treated cats showed a significant diminution of pathology compared with untreated NPC1 in the vlDAO (p < 0.001). The percent of pathology in the dmDAO was not significantly different between treated and untreated NPC1 cats. (C) In the medial accessory olive, significantly more pathology was seen in the lateral (lMAO) compared with the medial (mMAO) region of untreated NPC1 cats (horizontal bar) (p < 0.001). There was a significant diminution of pathology in the lMAO (p < 0.001) and the mMAO (p < 0.05) in both treatment groups compared with untreated NPC1 cats. D: In the principal olive, significantly (p < 0.001) more pathology was seen in the dorsal lamina (dlPO) compared with the ventral lamina of the principal olive (vlPO) of untreated NPC1 cats (horizontal bar). Significantly diminished pathology in the dlPO (p < 0.001) and vlPO (p < 0.01) was seen in both treatment groups. Data are (A) SE, Student t-test; (B–D) SE, 2-way ANOVA. *p < 0.05, **p < 0.01, ***p < 0.001, ns, not significant.
NPC1 Olivocerebellar Projections
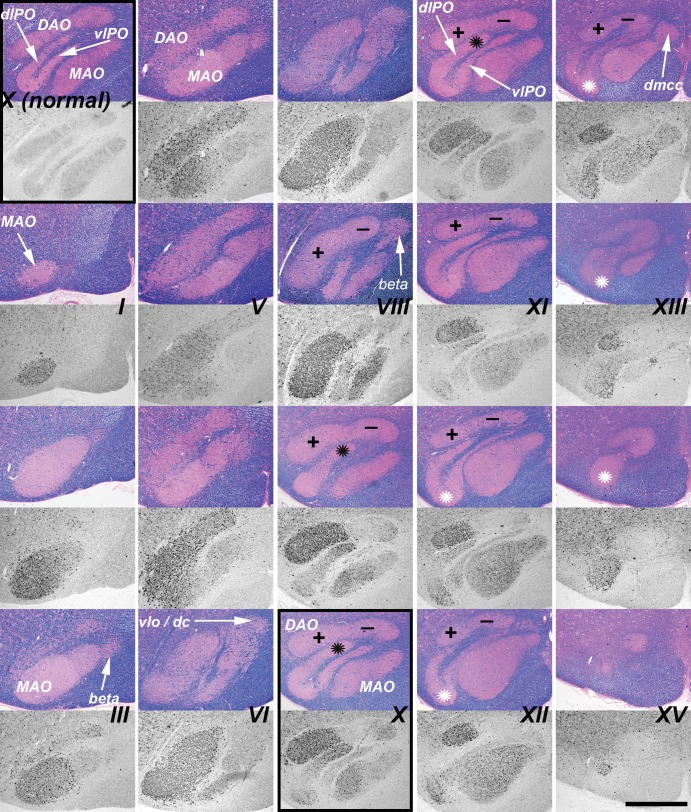
Climbing fibers originate from the 3 divisions of the inferior olivary nucleus (principal, medial accessory, dorsal accessory; Supplementary Data Fig. S3), and project to specific regions of the cerebellum where they synapse on the primary dendrites of Purkinje cells. These divisions of the inferior olivary nucleus were regularly and differentially impacted by disrupted autophagy as evaluated by LC3 staining. Serial sections were taken through the medulla of 3 6-month-old NPC1 cats and were stained for LC3 (Fig. 7). Pathology was seen in axons and presynaptic terminals throughout the caudal-rostral extent of the dorsal accessory olive (DAO). In the rostral two-thirds of the DAO, a sharply defined boundary was evident between the ventrolateral (vlDAO) and dorsomedial (dmDAO) portions with significantly greater (p < 0.001, Fig. 6B) LC3 pathology in the ventrolateral (indicated by “+” and “−” in Fig. 7). LC3 pathology was also seen through much of the caudal-rostral extent of the medial accessory olive (MAO). The concentration of aggregates in the MAO was greater in the more caudal regions and also was predominately laterally located (Figs. 6C, 7) although the lateral-medial boundary was less clearly defined than it was in the DAO. LC3 pathology in the dorsal lamina of the principal olive (dlPO) was seen in its most medial portion around Brodal levels VIII–XI (40) (Fig. 7, black asterisks), and was significantly greater in this region than that seen in the ventral lamina of the principal olive (vlPO) (p < 0.001, Fig. 6D). Pathology at the junction of the dlPO and vlPO was seen in the rostral region (Fig. 7, white asterisks). Moderate pathology was seen in the dorsomedial cell column while pathology in the dorsal cap and nucleus beta was not found. Evaluation of pathology throughout the caudal to rostral extent of the inferior olive was done by quantifying the percent area stained for aberrant LC3 within each region. These tabulated results are shown in Supplementary Data Fig. S4.
FIGURE 7.
LC3 pathology was found in specific subregions of the inferior olive of the NPC1 cat throughout its caudal-to-rostral extent. This figure is composed of a series of paired iron-Eriochrom cyanine R (EcyR)/eosin (reference in which the entire inferior olive is stained pink), and monochomatic LC3 immunohistochemistry (IHC) images of adjacent tissue sections that are arranged in 5 vertical columns. The series begins caudally at Brodal level I (Supplementary Data Fig. S3) in the first column and continues down the column to level III. The series resumes at the top of column 2, continues down the column to level VI, etc. The series ends rostrally at level XV at the bottom of column 5. The midline of the brain is at the right and ventral at the bottom in all images. Aberrant LC3 accumulation is indicated by the dark punctate IHC staining and is seen throughout most of the MAO. Densely concentrated LC3 pathology in the ventrolateral portion of the DAO is distinguished from the largely unaffected dorsomedial portion by plus and minus symbols on the corresponding reference images. LC3 pathology also localized to both the most medial portion of the dlPO and to the junction region between the vlPO and dlPO indicated by black and white asterisks respectively. The top panel in column 1 (boxed) is from a normal control cat for comparison to an equivalent location in the NPC1 cat at the bottom panel of column 3 (boxed). DAO, dorsal accessory olive; MAO, medial accessory olive; vlPO, principal olive, ventral lamina; dlPO, principal olive, dorsal lamina; vlo/dc, ventral lateral outgrowth/dorsal cap; dmcc, dorsal medial cell column. Scale bar: 1 mm.
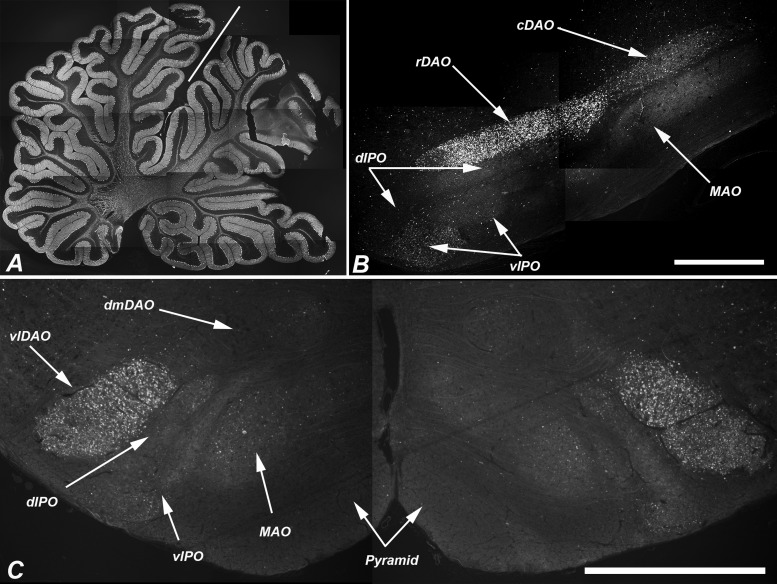
A dense concentration of LC3 accumulations was present in the vlDAO as early as 11 weeks of age, an age that preceded obvious Purkinje cell loss (Fig. 8). It is noteworthy that the climbing fibers that project to the Purkinje cells of the anterior cerebellar vermis originate from the DAO; thus, the areas first affected in the cerebellum and those first affected in the inferior olives are anatomically linked. Similarly, the cerebellar nodulus, which shows no Purkinje cell loss even at end stage disease, is innervated principally by climbing fibers from the dorsal cap and ventrolateral outgrowth of the PO, neither of which show marked LC3 accumulation.
FIGURE 8.
LC3-indicated pathology in the dorsal accessory olive preceded obvious loss of Purkinje cells. (A) Low-power composite image of a parasagittal section of the cerebellum of an 11-week-old NPC1 cat stained for calbindin showing no evidence of Purkinje cell loss. (B) Sagittal section through the inferior olive of the same cat. Pathologic LC3 immunoreactivity is seen in the rDAO. Other regions of the olive show little pathology at this age. (Note the very lightly concentrated pathology in vlPO and cDAO). (C) Transverse section at Brodal level X of a second cat (12-week-old) shows bilateral concentration of LC3 pathology in the vlDAO but little in other olivary subregions. The line in (A) indicates the primary fissure with the anterior vermis (lobules I–V) to the left. rDAO, rostral dorsal accessory olive; cDAO, caudal dorsal accessory olive; vlDAO, ventrolateral DAO; dmDAO, dorsomedial DAO; vlPO, ventral lamina of the principal olive; dlPO, dorsal lamina of the principal olive; MAO, medial accessory olive. Scale bars: (B, C) = 1 mm.
Next, we evaluated LC3 accumulation in the afferents that project to the inferior olivary nucleus. In 6-month-old NPC1 cats, pathologic LC3 staining was strongly present in axons and presynaptic terminals of the gracile, cuneate and red nuclei, while the pretectal nucleus, caudate nucleus, trigeminal sensory nucleus, periaqueductal gray, and globus pallidus were only mildly affected. LC3 accumulation in the gracile and cuneate nuclei was evaluated over time and compared with normal controls (Supplementary Data Fig. S5). LC3 pathology was not seen in NPC1 specimens at 2 or 4 weeks of age and only subtle accumulations were detected at 6 weeks of age. Substantial LC3 pathology appeared by 11 weeks of age and continued to increase until end-stage disease at 6 months of age when enlargement of the gracile nucleus was also seen (Supplementary Data Fig. S5C).
Purkinje cells project uniquely to the dentate, interpositus, fastigial, and vestibular nuclei. Little LC3 staining was observed in these deep cerebellar and vestibular nuclei (Fig. 9).
FIGURE 9.
LC3 pathology in NPC1 cats was minimal in the deep cerebellar nuclei, which are the exclusive Purkinje cell efferent populations. Fastigial nucleus (A), interpositus nucleus (B), and dentate nucleus (C) are shown. For comparison, the severe pathology seen in the ventrolateral part of the dorsal accessory olive is shown in (D). Scale bar: 100 µm.
Mossy Fibers and Other Brainstem Regions
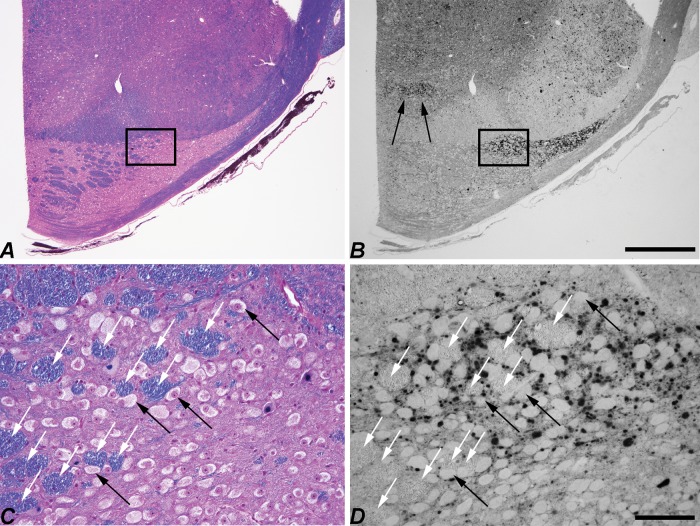
Mossy fibers arise from the spinocerebellar and cuneocerebellar tracts, the vestibular system, trigeminal pathways, reticular formation, and the pontine nuclei and synapse on the dendrites of cerebellar granule cells. Moderate pathology was seen throughout the medullary reticular formation but was very heavy within the lateral reticular nucleus, particularly in the more caudal region. There was very little LC3 pathology seen in the pontine nuclei with the exception of the dorsal lateral pontine nucleus where staining was densely concentrated. This is shown in Fig. 10 at approximately level IV defined by Brodal (41). Heavy LC3 labeling of the tegmental pontine reticular nucleus was also seen (Fig. 10B, arrows).
FIGURE 10.
LC3 pathology is sharply defined in the dorsolateral pontine nucleus of NPC1 cats. Low-magnification images of adjacent transverse sections of the pons stained with EcyR and eosin (A) and anti-LC3 (B). Boxed areas are shown at higher magnification in (C, D). Note that LC3 accumulations lie within the synaptic neuropil and are not seen in neuronal perikarya (black arrows [C, D]). Transversely-sectioned axon bundles are also largely free of pathology (white arrows [C, D]). The tegmental pontine reticular nucleus is another brainstem nucleus where concentrated LC3 pathology was found and is indicated by the arrows in panel (B). Scale bars: (A, B) 1 mm; (C, D) 100 µm.
The brainstem was evaluated for LC3 staining outside of the mossy and climbing fiber projections. The greatest amount of staining was identified in the oculomotor, red, and trochlear nuclei.
Effect of HPβCD Administration on LC3-Indicated Pathology
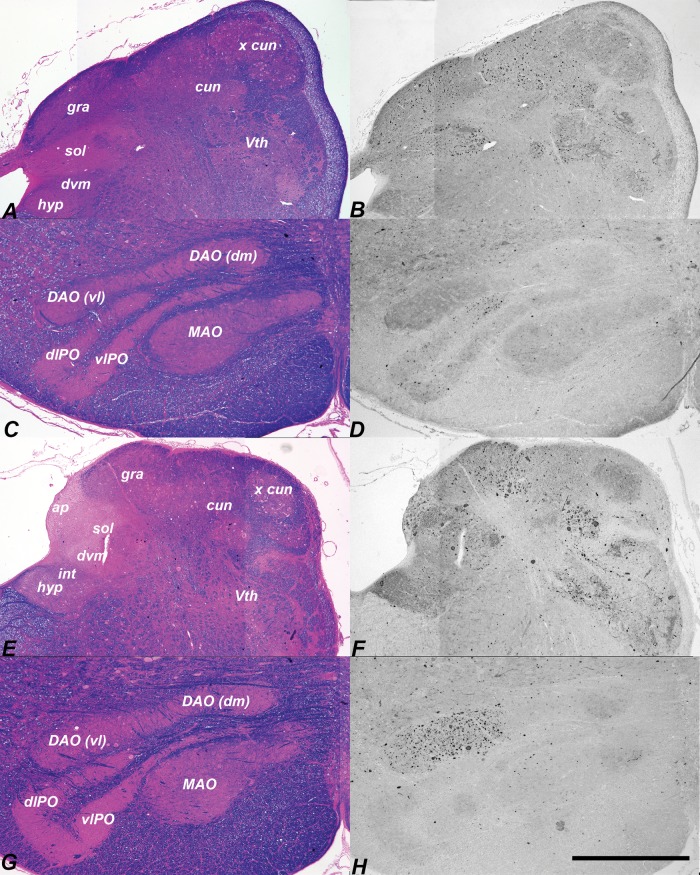
We next examined LC3 immunohistochemistry in the cerebellum and brainstem of NPC1 cats treated with intrathecal HPβCD (27). Many of these cats survived over 3 years of age and developed no signs of cerebellar dysfunction. Brains were evaluated in treated cats at approximately 6 months of age and in cats over 30 months of age. At both ages, Purkinje cell loss was ameliorated as we have previously published (27). We have now identified that pathologic accumulation of LC3 was significantly reduced in the vlDAO (p < 0.001, Fig. 6B), lMAO (p < 0.001, Fig. 6C), mMAO (p < 0.05, Fig. 6C), dlPO (p < 0.001, Fig. 6D), and vlPO (p < 0.01, Fig. 6D) subregions of the inferior olive of treated cats. In treated cats examined at the age which is end stage disease in untreated NPC1 cats, the inferior olive was essentially free of LC3 accumulation (Fig. 11C, D), with small residual accumulation remaining in the gracile and cuneate nuclei (Fig. 11A, B). In cats evaluated at over 30 months of age there was some increase in the amount of LC3 staining seen mainly in the gracile and cuneate (Fig. 11E, F) as well as in the ventrolateral DAO (Fig. 11G, H). Beyond the inferior olivary nuclei, greatly reduced but detectible LC3 accumulation was found in the granule cell layer of the anterior vermis and oculomotor nucleus.
FIGURE 11.
Bi-weekly intracisternal HPβCD injections begun at 3 weeks ameliorates LC3-indictaed pathology in the brainstem. EcyR and eosin reference slides left and adjacent LC3-IHC sections right. Dorsal caudal medulla of an HPβCD-treated NPC1 cat killed at 31 weeks (A, B) showed scattered pathology in the gracile, cuneate, and solitary nuclei. Almost no LC3 aggregates were found in the inferior olive of this specimen (C, D). Moderate pathology was seen in the gracile, cuneate (E, F) and ventrolateral portion of the dorsal accessory olive (G, H) in a 137-week-old treated cat. hyp, hypoglossal; int, nucleus intercalatus; dvm, dorsal vagal motor nucleus; ap, area postrema; sol, solitary nucleus; gra, gracile nucleus; cun, main cuneate nucleus; x cun, external cuneate nucleus; Vth, spinal trigeminal nucleus; DAO(vl), ventrolateral dorsal accessory olive; DAO(dm), dorsomedial dorsal accessory olive; MAO, medial accessory olive; dlPO, principal olive dorsal lamina; vlPO, principal olive ventral lamina. Scale bar: 1 mm.
LC3 Accumulation in the CNS in Other Feline Storage Diseases
We evaluated brains from cats with 3 other lysosomal storage diseases in order to determine whether similarities in LC3 pathology exist between them and feline NPC1. No accumulation of LC3 was noted in the brainstem or cerebellum in MPS VII cats and staining appeared identical to that of control brain (compare Supplementary Data Fig. S6A with control Supplementary Data Fig. S5A). In MLII cats, the cerebellum appeared as seen in control brain (MLII data not shown). In AMD cats, a disease that manifests with similar signs of cerebellar dysfunction, moderate LC3 accumulations were found in the caudal-lateral portions of the medial and DAO nuclei and in the gracile nucleus (Supplementary Data Fig. S6B). Smaller accumulations were seen in the cerebellar white matter and granule cell layers but the amount was far less than that found in NPC1 brain. It is interesting to note that Purkinje cell loss is much milder in feline AMD and no particular pattern of loss has been identified (42).
DISCUSSION
The hodology of the inferior olive has developed over 70 years and much of the data were acquired in the cat (43, 44), in which the DAO, MAO, and PO are readily distinguished. Climbing fibers originate from the inferior olive and form excitatory glutaminergic synapses on the primary dendrites of cerebellar Purkinje cells. Each Purkinje cell is innervated by a single olivary neuron and each olivary neuron innervates approximately 10 Purkinje cells (45). Specific subnuclei of the inferior olive project topographically to specific regions of the cerebellar cortex (30, 31, 46). We hypothesized an association between patterned Purkinje cell loss and LC3 accumulation in regions of the olive projecting to specific cerebellar regions via climbing fibers.
In general, the central vermis receives its climbing fibers from the caudal MAO, the lateral vermis of anterior lobules I–V receive projections from the lateral DAO, and the intermediate part of lobules IV and V receives projections from the medial DAO (35). The preponderance of Purkinje cell loss occurring in the anterior cerebellum of NPC1 cats correlates with the extensive LC3 pathology seen in the ventrolateral DAO and the caudal MAO. We were not able to resolve specific longitudinal zones (47, 48) of Purkinje cell loss, however; therefore, we cannot specifically state whether Purkinje cells innervated by olivary neurons in the dorsomedial DAO were differentially spared. Also, lack of pathology of the dorsal cap and ventrolateral outgrowth of the PO correlates well with survival of target Purkinje cells within the nodulus. These findings suggest either that autophagic abnormalities in specific inferior olivary subnuclei pathways may contribute to the spatial pattern of Purkinje cell loss seen in NPC1, or that Purkinje cell loss in specific cerebellar regions results in targeted LC3 accumulation in the inferior olives that project to them.
Because LC3 accumulation in feline NPC1 was found principally in axons and presynaptic terminals, we next evaluated the afferents to the inferior olives. The most clearly defined boundary of LC3 accumulation was seen in the DAO where intense pathology of the ventrolateral region contrasted with an essential lack of pathology in the dorsomedial region. The afferents to the ventrolateral DAO are somatosensory and are largely from the gracile (49–51), but also from the cuneate (52), areas that showed correspondingly high levels of LC3 pathology. The primary afferent to the dorsomedial DAO is the spinal trigeminal nucleus (53, 54), which showed little pathology. Thus, LC3 accumulation in specific inferior olive regions was associated with the degree of LC3-indicated pathology in afferents to these regions.
Mossy fibers project to granule cells of the cerebellar cortex. The sources of mossy fibers are widely dispersed compared with the climbing fiber system which is exclusively from the inferior olivary nuclei (55). Two sources of mossy fibers showed distinct accumulations of LC3 in the feline NPC1 brain: the lateral reticular nucleus and the dorsolateral basilar pontine nucleus. The lateral reticular nucleus receives massive spinal input (56) and its predominate projection is to the anterior lobe, mostly lobules IV and V (57). The dorsolateral basilar pontine nucleus projects mossy fibers principally to cerebellar lobule VII but also to lobules VI, VIII, IX and the paraflocculus (58). Interestingly, the dorsolateral pontine nucleus is the only part of the basilar pontine complex shown also to receive spinal projections (59). Cortical input to the cerebellum is principally via the corticopontocerebellar pathway (60). Except for labeling in lamina IV of the lateral gyrus, little LC3-indicated pathology was found in the cerebral cortex and there was a corresponding lack of pathology in the remainder of the basilar pontine nuclei.
Since the finding that loss of normal autophagy can result in neurodegeneration (61, 62), the impact that lysosomal storage of substrates, and specifically cholesterol storage, has on aberrant autophagy has become the focus of intensive research (63–69). Although fibroblasts are an imperfect model for neurons, their use in the elucidation of the role that excess cholesterol plays in impaired autophagic flux is of importance. Abnormal cholesterol accumulation has been shown to impair endolysosome/autophagic vesicle fusion in mouse embryonic fibroblasts of the lysosomal storage diseases mucopolysaccharidosis type IIIA and multiple sulfatase deficiency (70). In NPC1 patient fibroblasts, Npc1−/− mouse embryonic fibroblasts, and Chinese hamster ovary-K1 NPC1 null cells a significant reduction in amphisome formation was seen due to the failure of the fusion of late endosomes and autophagosomes (71). Mechanistically, these studies concluded that excess membrane cholesterol disrupted the recruitment and correct localization of the N-ethylmaleimide-sensitive factor attachment protein receptor proteins in the membrane that are required for autophagosome fusion and maturation. NPC1 deficiency also impairs the degradation of cargo in autolysosomes (72, 73), supporting the notion that multiple steps critical for autophagic flux are disrupted in this disease.
Mutated NPC1 protein has been generally linked with disrupted autophagy (12, 71–74), and specifically with autophagy-related neurodegeneration (8, 75–80). In neurons, autophagosomes form primarily in distal axons, fuse with late endosomes to form amphisomes, and are retrogradely transported to the soma for fusion with lysosomes and subsequent digestion (81, 82). In our report, the accumulation of LC3-positive puncta and aggregates in axons and presynaptic terminals but not in neuronal perikarya or dendrites may be due, in part, to the failure of amphisome formation resulting in impaired retrograde axonal transport of autophagic cargo (83, 84). However, despite the findings of abnormal autophagy in NPC disease, the distribution of abnormal autophagy throughout the CNS of patients or animal models has not previously been described. The distribution of LC3 accumulation found in the feline model of NPC1 were specific to this disease and were not seen in feline models of MPS VII or MLII, which are also lysosomal storage diseases with neurologic manifestations; LC3 accumulation was mild in AMD which present with similar clinical signs of NPC1, however, with less Purkinje cell loss.
Methods to limit autophagic abnormalities have been proposed to treat NPC disease (71–73, 78, 80, 85). The finding that HPβCD resolves regional autophagic abnormalities evidenced by LC3 accumulation has not been previously described in any in vivo model of NPC1. However, the mechanism of action of HPβCD in ameliorating cholesterol storage, Purkinje cell death, and LC3 accumulation is not known. We have previously shown that HPβCD can resolve cholesterol storage and ameliorate Purkinje cell death in feline NPC1 (27). It is not known whether the effect on cholesterol is sufficient to resolve the autophagy abnormalities. There is conflicting published in vitro data that cyclodextrins can directly both stimulate autophagic flux through activation of AMP-activated protein kinase (86), and impede autophagic flux (71). Clearly, determining the mechanism of action of HPβCD will help us to better understand the role of cholesterol in neurodegenerative disease, the function of NPC1 in the normal neuron, and the role of normal lysosomal function in autophagy.
We are not aware of any antibody that can differentiate between cytosolic LC3-I and lipidated, autophagosomal membrane-bound LC3-II in situ. Due to the differential electrophoretic migration of the 2 isoforms in Western blots both forms can be resolved and a significant increase in the amount of cellular LC3-II in all NPC1 brain regions tested was confirmed. Increased LC3-II and p62 in the NPC1 cat brain could reflect an increased induction of autophagy or a blockage of autophagic flux (i.e. a failure of final autolysosomal degradation due to disrupted autophagosome/endosome fusion, to disrupted retrograde axonal transport, to impaired autolysosomal proteolysis or to a combination of all 3). The findings on Western blot are consistent with our immunohistochemical staining showing diffuse and clearly defined annular puncta that stain for LC3 and are localized to axonal swellings and presynaptic terminals in affected brain. Staining in affected brain is morphologically consistent with a transition from LC3-I (inert, cytosolic) to LC3-II (functional, autophagosomal) forms (87).
The NPC1 cat model accelerated the translation of promising data on HPβCD in the NPC1 mouse model to children by providing critical information on route of delivery, scaling of dose, and adverse events that would not have been feasible using the mouse model. Notably, this preclinical work led to the development of clinical trials of HPβCD for NPC1 that have been approved by both the FDA and EMA. Direct injection of cerebrospinal fluid with HPβCD ameliorated neuronal storage of cholesterol and gangliosides and improved Purkinje cell survival in NPC cats (27), and the results presented in this manuscript also support the positive effect of HPβCD on autophagic abnormalities.
In summary, many of the nuclei with LC3 accumulation were in afferent pathways to the cerebellum, suggesting a pathway-specific aspect of NPC1 that may contribute to the patterned Purkinje cell death. We interpret these results as indicative of a disruption of neuronal autophagy that begins at or near synapses during the early stages of autophagosome generation.
Supplementary Material
ACKNOWLEDGMENT
The authors wish to thank Patricia O’Donnell for her care of the animals used in this study. The authors have no duality or conflicts of interest to declare.
FUNDING
This work was supported by the grants NIH-R01-NS-096087, R01-NS-063967, P40-OD-010939, T32-NS-007222, Ara Parseghian Medical Research Foundation, Dana’s Angels Research Trust, Race for Adam, National Niemann Pick Disease Foundation, and Support of Accelerated Research for Niemann Pick Type C disease (SOAR-NPC).
REFERENCES
- 1. Pentchev PG, Comly ME, Kruth HS, et al. A defect in cholesterol esterification in Niemann–Pick disease (type C) patients. Proc Natl Acad Sci USA 1985;82:8247–51http://dx.doi.org/10.1073/pnas.82.23.8247 [DOI] [PMC free article] [PubMed] [Google Scholar]
- 2. Vanier MT, Millat G.. Niemann–Pick disease type C. Clin Genet 2003;64:269–81http://dx.doi.org/10.1034/j.1399-0004.2003.00147.x [DOI] [PubMed] [Google Scholar]
- 3. Runz H, Dolle D, Schlitter AM, et al. NPC-db, a Niemann–Pick type C disease gene variation database. Hum Mutat 2008;29:345–50http://dx.doi.org/10.1002/humu.20636 [DOI] [PubMed] [Google Scholar]
- 4. Li H, Repa JJ, Valasek MA, et al. Molecular, anatomical, and biochemical events associated with neurodegeneration in mice with Niemann–Pick type C disease. J Neuropathol Exp Neurol 2005;64:323–33http://dx.doi.org/10.1093/jnen/64.4.323 [DOI] [PubMed] [Google Scholar]
- 5. Infante RE, Wang ML, Radhakrishnan A, et al. NPC2 facilitates bidirectional transfer of cholesterol between NPC1 and lipid bilayers, a step in cholesterol egress from lysosomes. Proc Natl Acad Sci Usa U S A 2008;105:15287–92 [DOI] [PMC free article] [PubMed] [Google Scholar]
- 6. Walkley SU, Suzuki K.. Consequences of NPC1 and NPC2 loss of function in mammalian neurons. Biochim Biophys Acta 2004;1685:48–62http://dx.doi.org/10.1016/j.bbalip.2004.08.011 [DOI] [PubMed] [Google Scholar]
- 7. Lopez ME, Scott MP.. Genetic dissection of a cell-autonomous neurodegenerative disorder: Lessons learned from mouse models of Niemann–Pick disease type C. Dis Model Mech 2013;6:1089–100http://dx.doi.org/10.1242/dmm.012385 [DOI] [PMC free article] [PubMed] [Google Scholar]
- 8. Ko DC, Milenkovic L, Beier SM, et al. Cell-autonomous death of cerebellar Purkinje neurons with autophagy in Niemann–Pick type C disease. PLoS Genet 2005;1:81–95 [DOI] [PMC free article] [PubMed] [Google Scholar]
- 9. Elrick MJ, Pacheco CD, Yu T, et al. Conditional Niemann–Pick C mice demonstrate cell autonomous Purkinje cell neurodegeneration. Hum Mol Genet 2010;19:837–47http://dx.doi.org/10.1093/hmg/ddp552 [DOI] [PMC free article] [PubMed] [Google Scholar]
- 10. Yu T, Shakkottai VG, Chung C, et al. Temporal and cell-specific deletion establishes that neuronal Npc1 deficiency is sufficient to mediate neurodegeneration. Hum Mol Genet 2011;20:4440–51http://dx.doi.org/10.1093/hmg/ddr372 [DOI] [PMC free article] [PubMed] [Google Scholar]
- 11. Lopez ME, Klein AD, Dimbil UJ, et al. Anatomically defined neuron-based rescue of neurodegenerative Niemann–Pick type C disorder. J Neurosci 2011;31:4367–78http://dx.doi.org/10.1523/JNEUROSCI.5981-10.2011 [DOI] [PMC free article] [PubMed] [Google Scholar]
- 12. Pacheco CD, Kunkel R, Lieberman AP.. Autophagy in Niemann–Pick C disease is dependent upon Beclin-1 and responsive to lipid trafficking defects. Hum Mol Genet 2007;16:1495–503http://dx.doi.org/10.1093/hmg/ddm100 [DOI] [PubMed] [Google Scholar]
- 13. Liao G, Yao Y, Liu J, et al. Cholesterol accumulation is associated with lysosomal dysfunction and autophagic stress in Npc1−/− mouse brain. Am J Pathol 2007;171:962–75. [DOI] [PMC free article] [PubMed] [Google Scholar]
- 14. Bento CF, Renna M, Ghislat G, et al. Mammalian autophagy: How does it work? Annu Rev Biochem 2016;85:685–713 [DOI] [PubMed] [Google Scholar]
- 15. Reggiori F, Ungermann C.. Autophagosome Maturation and Fusion. J Mol Biol 2017;429:486–96http://dx.doi.org/10.1016/j.jmb.2017.01.002 [DOI] [PubMed] [Google Scholar]
- 16. Maday S, Wallace KE, Holzbaur EL.. Autophagosomes initiate distally and mature during transport toward the cell soma in primary neurons. J Cell Biol 2012;196:407–17http://dx.doi.org/10.1083/jcb.201106120 [DOI] [PMC free article] [PubMed] [Google Scholar]
- 17. Shen DN, Zhang LH, Wei EQ, et al. Autophagy in synaptic development, function, and pathology. Neurosci Bull 2015;31:416–26http://dx.doi.org/10.1007/s12264-015-1536-6 [DOI] [PMC free article] [PubMed] [Google Scholar]
- 18. Damme M, Suntio T, Saftig P, et al. Autophagy in neuronal cells: General principles and physiological and pathological functions. Acta Neuropathol 2015;129:337–62http://dx.doi.org/10.1007/s00401-014-1361-4 [DOI] [PubMed] [Google Scholar]
- 19. Nikoletopoulou V, Papandreou ME, Tavernarakis N.. Autophagy in the physiology and pathology of the central nervous system. Cell Death Differ 2015;22:398–407 [DOI] [PMC free article] [PubMed] [Google Scholar]
- 20. Somers KL, Royals MA, Carstea ED, et al. Mutation analysis of feline Niemann–Pick C1 disease. Mol Genet Metab 2003;79:99–103http://dx.doi.org/10.1016/S1096-7192(03)00074-X [DOI] [PubMed] [Google Scholar]
- 21. Vite CH, Ding W, Bryan C, et al. Clinical, electrophysiological, and serum biochemical measures of progressive neurological and hepatic dysfunction in feline Niemann–Pick type C disease. Pediatr Res 2008;64:544–9http://dx.doi.org/10.1203/PDR.0b013e318184d2ce [DOI] [PMC free article] [PubMed] [Google Scholar]
- 22. Lowenthal AC, Cummings JF, Wenger DA, et al. Feline sphingolipidosis resembling Niemann–Pick disease type C. Acta Neuropathol 1990;81:189–97http://dx.doi.org/10.1007/BF00334507 [DOI] [PubMed] [Google Scholar]
- 23. Brown DE, Thrall MA, Walkley SU, et al. Feline Niemann–Pick disease type C. Am J Pathol 1994;144:1412–5 [PMC free article] [PubMed] [Google Scholar]
- 24. Munana KR, Luttgen PJ, Thrall MA, et al. Neurological manifestations of Niemann–Pick disease type C in cats. J Vet Intern Med 1994;8:117–21http://dx.doi.org/10.1111/j.1939-1676.1994.tb03208.x [DOI] [PubMed] [Google Scholar]
- 25. March PA, Thrall MA, Brown DE, et al. GABAergic neuroaxonal dystrophy and other cytopathological alterations in feline Niemann–Pick disease type C. Acta Neuropathol 1997;94:164–72http://dx.doi.org/10.1007/s004010050689 [DOI] [PubMed] [Google Scholar]
- 26. Ory DS, Ottinger EA, Farhat NY, et al. Intrathecal 2-hydroxypropyl-beta-cyclodextrin decreases neurological disease progression in Niemann–Pick disease, type C1: A non-randomised, open-label, phase 1–2 trial. Lancet 2017;390:1758–68http://dx.doi.org/10.1016/S0140-6736(17)31465-4 [DOI] [PMC free article] [PubMed] [Google Scholar]
- 27. Vite CH, Bagel JH, Swain GP, et al. Intracisternal cyclodextrin prevents cerebellar dysfunction and Purkinje cell death in feline Niemann–Pick type C1 disease. Sci Transl Med 2015;7:276ra26. [DOI] [PMC free article] [PubMed] [Google Scholar]
- 28. Trott JR, Apps R.. Lateral and medial sub-divisions within the olivocerebellar zones of the paravermal cortex in lobule Vb/c of the cat anterior lobe. Exp Brain Res 1991;87:126–40 [DOI] [PubMed] [Google Scholar]
- 29. Courville J, Augustine JR, Martel P.. Projections from the inferior olive to the cerebellar nuclei in the cat demonstrated by retrograde transport of horseradish peroxidase. Brain Res 1977;130:405–19http://dx.doi.org/10.1016/0006-8993(77)90105-6 [DOI] [PubMed] [Google Scholar]
- 30. Groenewegen HJ, Voogd J.. The parasagittal zonation within the olivocerebellar projection. I. Climbing fiber distribution in the vermis of cat cerebellum. J Comp Neurol 1977;174:417–88 [DOI] [PubMed] [Google Scholar]
- 31. Groenewegen HJ, Voogd J, Freedman SL.. The parasagittal zonation within the olivocerebellar projection. II. Climbing fiber distribution in the intermediate and hemispheric parts of cat cerebellum. J Comp Neurol 1979;183:551–601 [DOI] [PubMed] [Google Scholar]
- 32. Gerrits NM, Voogd J, Magras IN.. Vestibular afferents of the inferior olive and the vestibulo-olivo-cerebellar climbing fiber pathway to the flocculus in the cat. Brain Res 1985;332:325–36http://dx.doi.org/10.1016/0006-8993(85)90601-8 [DOI] [PubMed] [Google Scholar]
- 33. Brodal A. The olivocerebellar projection in the cat as studied with the method of retrograde axonal transport of horseradish peroxidase. II. The projection to the uvula. J Comp Neurol 1976;166:417–26 [DOI] [PubMed] [Google Scholar]
- 34. Brodal A, Walberg F.. The olivocerebellar projection in the cat studied with the method of retrograde axonal transport of horseradish peroxidase. VI. The projection onto longitudinal zones of the paramedian lobule. J Comp Neurol 1977;176:281–94 [DOI] [PubMed] [Google Scholar]
- 35. Brodal A, Walberg F.. The olivocerebellar projection in the cat studied with the method of retrograde axonal transport of horseradish peroxidase. IV. The projection to the anterior lobe. J Comp Neurol 1977;172:85–108 [DOI] [PubMed] [Google Scholar]
- 36. Berg T, Riise HM, Hansen GM, et al. Spectrum of mutations in α-mannosidosis. Am J Hum Genet 1999;64:77–88 [DOI] [PMC free article] [PubMed] [Google Scholar]
- 37. Mazrier H, Van Hoeven M, Wang P, et al. Inheritance, biochemical abnormalities, and clinical features of feline mucolipidosis II: The first animal model of human I-cell disease. J Hered 2003;94:363–73http://dx.doi.org/10.1093/jhered/esg080 [DOI] [PubMed] [Google Scholar]
- 38. Fyfe JC, Kurzhals RL, Lassaline ME, et al. Molecular basis of feline beta-glucuronidase deficiency: An animal model of mucopolysaccharidosis VII. Genomics 1999;58:121–8http://dx.doi.org/10.1006/geno.1999.5825 [DOI] [PubMed] [Google Scholar]
- 39. Sarna JR, Larouche M, Marzban H, et al. Patterned Purkinje cell degeneration in mouse models of Niemann–Pick type C disease. J Comp Neurol 2003;456:279–91http://dx.doi.org/10.1002/cne.10522 [DOI] [PubMed] [Google Scholar]
- 40. Brodal A. Untersuchungen uber die Olivocerebellaren Lokalisation. Z Neurol 1940;169:1053 [Google Scholar]
- 41. Brodal A, Jansen J.. The Ponto-Cerebellar Projection in the Rabbit and Cat - Experimental Investigations. J Comp Neurol 1946;84:31–118http://dx.doi.org/10.1002/cne.900840105 [DOI] [PubMed] [Google Scholar]
- 42. Vite CH, McGowan JC, Braund KG, et al. Histopathology, electrodiagnostic testing, and magnetic resonance imaging show significant peripheral and central nervous system myelin abnormalities in the cat model of α-mannosidosis. J Neuropathol Exp Neurol 2001;60:817–28 [DOI] [PubMed] [Google Scholar]
- 43. Voogd J. Cerebellar zones: A personal history. Cerebellum 2011;10:334–50http://dx.doi.org/10.1007/s12311-010-0221-6 [DOI] [PMC free article] [PubMed] [Google Scholar]
- 44. Voogd J, Shinoda Y, Ruigrok TJH, et al. Cerebellar nuclei and the inferior olivary nuclei: Organization and connections In: Manto M, Gruol DL, Schmahmann J, Koibuchi N, Rossi F, eds. Handbook of the Cerebellum and Cerebellar Disorders, 1 edn Dordrecht (Netherlands): Springer; 2013: 377–436 [Google Scholar]
- 45. Mlonyeni M. The number of Purkinje cells and inferior olivary neurones in the cat. J Comp Neurol 1973;147:1–10http://dx.doi.org/10.1002/cne.901470102 [DOI] [PubMed] [Google Scholar]
- 46. Ruigrok TJ. Ins and outs of cerebellar modules. Cerebellum 2011;10:464–74http://dx.doi.org/10.1007/s12311-010-0164-y [DOI] [PMC free article] [PubMed] [Google Scholar]
- 47. Buisseret-Delmas C, Angaut P.. The cerebellar olivo-corticonuclear connections in the rat. Prog Neurobiol 1993;40:63–87http://dx.doi.org/10.1016/0301-0082(93)90048-W [DOI] [PubMed] [Google Scholar]
- 48. Apps R, Hawkes R.. Cerebellar cortical organization: A one-map hypothesis. Nat Rev Neurosci 2009;10:670–81http://dx.doi.org/10.1038/nrn2698 [DOI] [PubMed] [Google Scholar]
- 49. Boesten AJ, Voogd J.. Projections of the dorsal column nuclei and the spinal cord on the inferior olive in the cat. J Comp Neurol 1975;161:215–37http://dx.doi.org/10.1002/cne.901610206 [DOI] [PubMed] [Google Scholar]
- 50. Berkley KJ, Hand PJ.. Efferent projections of the gracile nucleus in the cat. Brain Res 1978;153:263–83http://dx.doi.org/10.1016/0006-8993(78)90406-7 [DOI] [PubMed] [Google Scholar]
- 51. Bull MS, Mitchell SK, Berkley KJ.. Convergent inputs to the inferior olive from the dorsal column nuclei and pretectum in the cat. Brain Res 1990;525:1–10http://dx.doi.org/10.1016/0006-8993(90)91314-7 [DOI] [PubMed] [Google Scholar]
- 52. Molinari HH. Ascending somatosensory projections to the dorsal accessory olive: An anatomical study in cats. J Comp Neurol 1984;223:110–23http://dx.doi.org/10.1002/cne.902230109 [DOI] [PubMed] [Google Scholar]
- 53. Berkley KJ, Hand PJ.. Projections to the inferior olive of the cat. II. Comparisons of input from the gracile, cuneate and the spinal trigeminal nuclei. J Comp Neurol 1978;180:253–64 [DOI] [PubMed] [Google Scholar]
- 54. Huerta MF, Hashikawa T, Gayoso MJ, et al. The trigemino-olivary projection in the cat: Contributions of individual subnuclei. J Comp Neurol 1985;241:180–90http://dx.doi.org/10.1002/cne.902410206 [DOI] [PubMed] [Google Scholar]
- 55. Voogd J, Ruigrok TJH.. Cerebellum and precerebellar nuclei In: Mai J, Paxinos G, eds. The Human Nervous System, 3 edn.Cambridge, Massachusetts (USA): Academic Press; 2012: 471–545 [Google Scholar]
- 56. Kunzle H. The topographic organization of spinal afferents to the lateral reticular nucleus of the cat. J Comp Neurol 1973;149:103–15http://dx.doi.org/10.1002/cne.901490107 [DOI] [PubMed] [Google Scholar]
- 57. Clendenin M, Ekerot CF, Oscarsson O, et al. The lateral reticular nucleus in the cat. I. Mossy fibre distribution in cerebellar cortex. Exp Brain Res 1974;21:473–86 [DOI] [PubMed] [Google Scholar]
- 58. Kawamura K, Hashikawa T.. Projections from the pontine nuclei proper and reticular tegmental nucleus onto the cerebellar cortex in the cat. An autoradiographic study. J Comp Neurol 1981;201:395–413 [DOI] [PubMed] [Google Scholar]
- 59. Ruegg DG, Eldred E, Wiesendanger M.. Spinal projection to the dorsolateral nucleus of the caudal basilar pons in the cat. J Comp Neurol 1978;179:383–91http://dx.doi.org/10.1002/cne.901790208 [DOI] [PubMed] [Google Scholar]
- 60. Apps RW, Watson T.C.. Cerebro-Cerebellar Connections In: Manto M, Gruol D.L., Schmahmann J., Koibuchi N., Rossi F., ed. Handbook of the Cerebellum and Cerebellar Disorders, 1 edn. Dordrecht (Netherlands): Springer; 2013: 1131–53 [Google Scholar]
- 61. Hara T, Nakamura K, Matsui M, et al. Suppression of basal autophagy in neural cells causes neurodegenerative disease in mice. Nature 2006;441:885–9http://dx.doi.org/10.1038/nature04724 [DOI] [PubMed] [Google Scholar]
- 62. Komatsu M, Waguri S, Chiba T, et al. Loss of autophagy in the central nervous system causes neurodegeneration in mice. Nature 2006;441:880–4http://dx.doi.org/10.1038/nature04723 [DOI] [PubMed] [Google Scholar]
- 63. Ballabio A, Gieselmann V.. Lysosomal disorders: From storage to cellular damage. Biochim Biophys Acta 2009;1793:684–96http://dx.doi.org/10.1016/j.bbamcr.2008.12.001 [DOI] [PubMed] [Google Scholar]
- 64. Jaeger PA, Wyss-Coray T.. All-you-can-eat: Autophagy in neurodegeneration and neuroprotection. Mol Neurodegener 2009;4:16.http://dx.doi.org/10.1186/1750-1326-4-16 [DOI] [PMC free article] [PubMed] [Google Scholar]
- 65. Yue Z, Friedman L, Komatsu M, et al. The cellular pathways of neuronal autophagy and their implication in neurodegenerative diseases. Biochim Biophys Acta 2009;1793:1496–507http://dx.doi.org/10.1016/j.bbamcr.2009.01.016 [DOI] [PMC free article] [PubMed] [Google Scholar]
- 66. Nixon RA. The role of autophagy in neurodegenerative disease. Nat Med 2013;19:983–97http://dx.doi.org/10.1038/nm.3232 [DOI] [PubMed] [Google Scholar]
- 67. Menzies FM, Fleming A, Rubinsztein DC.. Compromised autophagy and neurodegenerative diseases. Nat Rev Neurosci 2015;16:345–57http://dx.doi.org/10.1038/nrn3961 [DOI] [PubMed] [Google Scholar]
- 68. Fraldi A, Klein AD, Medina DL, et al. Brain disorders due to lysosomal dysfunction. Annu Rev Neurosci 2016;39:277–95http://dx.doi.org/10.1146/annurev-neuro-070815-014031 [DOI] [PubMed] [Google Scholar]
- 69. Ward C, Martinez-Lopez N, Otten EG, et al. Autophagy, lipophagy and lysosomal lipid storage disorders. Biochim Biophys Acta 2016;1861:269–84http://dx.doi.org/10.1016/j.bbalip.2016.01.006 [DOI] [PubMed] [Google Scholar]
- 70. Fraldi A, Annunziata F, Lombardi A, et al. Lysosomal fusion and SNARE function are impaired by cholesterol accumulation in lysosomal storage disorders. EMBO J 2010;29:3607–20http://dx.doi.org/10.1038/emboj.2010.237 [DOI] [PMC free article] [PubMed] [Google Scholar] [Retracted]
- 71. Sarkar S, Carroll B, Buganim Y, et al. Impaired autophagy in the lipid-storage disorder Niemann–Pick type C1 disease. Cell Rep 2013;5:1302–15http://dx.doi.org/10.1016/j.celrep.2013.10.042 [DOI] [PMC free article] [PubMed] [Google Scholar]
- 72. Elrick MJ, Lieberman AP.. Autophagic dysfunction in a lysosomal storage disorder due to impaired proteolysis. Autophagy 2013;9:234–5http://dx.doi.org/10.4161/auto.22501 [DOI] [PMC free article] [PubMed] [Google Scholar]
- 73. Elrick MJ, Yu T, Chung C, et al. Impaired proteolysis underlies autophagic dysfunction in Niemann–Pick type C disease. Hum Mol Genet 2012;21:4876–87http://dx.doi.org/10.1093/hmg/dds324 [DOI] [PMC free article] [PubMed] [Google Scholar]
- 74. Ishibashi S, Yamazaki T, Okamoto K.. Association of autophagy with cholesterol-accumulated compartments in Niemann–Pick disease type C cells. J Clin Neurosci 2009;16:954–9http://dx.doi.org/10.1016/j.jocn.2008.09.020 [DOI] [PubMed] [Google Scholar]
- 75. Bi X, Liao G.. Autophagic-lysosomal dysfunction and neurodegeneration in Niemann–Pick Type C mice: Lipid starvation or indigestion? Autophagy 2007;3:646–8 [DOI] [PubMed] [Google Scholar]
- 76. Ordonez MP. Defective mitophagy in human Niemann–Pick Type C1 neurons is due to abnormal autophagy activation. Autophagy 2012;8:1157–8http://dx.doi.org/10.4161/auto.20668 [DOI] [PMC free article] [PubMed] [Google Scholar]
- 77. Ordonez MP, Roberts EA, Kidwell CU, et al. Disruption and therapeutic rescue of autophagy in a human neuronal model of Niemann Pick type C1. Hum Mol Genet 2012;21:2651–62http://dx.doi.org/10.1093/hmg/dds090 [DOI] [PMC free article] [PubMed] [Google Scholar]
- 78. Maetzel D, Sarkar S, Wang H, et al. Genetic and chemical correction of cholesterol accumulation and impaired autophagy in hepatic and neural cells derived from Niemann–Pick Type C patient-specific iPS cells. Stem Cell Rep 2014;2:866–80http://dx.doi.org/10.1016/j.stemcr.2014.03.014 [DOI] [PMC free article] [PubMed] [Google Scholar]
- 79. Meske V, Erz J, Priesnitz T, et al. The autophagic defect in Niemann–Pick disease type C neurons differs from somatic cells and reduces neuronal viability. Neurobiol Dis 2014;64:88–97http://dx.doi.org/10.1016/j.nbd.2013.12.018 [DOI] [PubMed] [Google Scholar]
- 80. Meske V, Priesnitz T, Albert F, et al. How to reduce the accumulation of autophagic vacuoles in NPC1-deficient neurons: A comparison of two pharmacological strategies. Neuropharmacology 2015;89:282–9http://dx.doi.org/10.1016/j.neuropharm.2014.10.006 [DOI] [PubMed] [Google Scholar]
- 81. Maday S, Holzbaur EL.. Autophagosome assembly and cargo capture in the distal axon. Autophagy 2012;8:858–60http://dx.doi.org/10.4161/auto.20055 [DOI] [PMC free article] [PubMed] [Google Scholar]
- 82. Maday S, Holzbaur EL.. Autophagosome biogenesis in primary neurons follows an ordered and spatially regulated pathway. Dev Cell 2014;30:71–85http://dx.doi.org/10.1016/j.devcel.2014.06.001 [DOI] [PMC free article] [PubMed] [Google Scholar]
- 83. Cheng XT, Zhou B, Lin MY, et al. Axonal autophagosomes recruit dynein for retrograde transport through fusion with late endosomes. J Cell Biol 2015;209:377–86http://dx.doi.org/10.1083/jcb.201412046 [DOI] [PMC free article] [PubMed] [Google Scholar]
- 84. Cheng XT, Zhou B, Lin MY, et al. Axonal autophagosomes use the ride-on service for retrograde transport toward the soma. Autophagy 2015;11:1434–6http://dx.doi.org/10.1080/15548627.2015.1062203 [DOI] [PMC free article] [PubMed] [Google Scholar]
- 85. Pacheco CD, Elrick MJ, Lieberman AP.. Tau normal function influences Niemann–Pick type C disease pathogenesis in mice and modulates autophagy in NPC1-deficient cells. Autophagy 2009;5:548–50http://dx.doi.org/10.4161/auto.5.4.8364 [DOI] [PMC free article] [PubMed] [Google Scholar]
- 86. Dai S, Dulcey AE, Hu X, et al. Methyl-beta-cyclodextrin restores impaired autophagy flux in Niemann–Pick C1-deficient cells through activation of AMPK. Autophagy 2017;13:1435–51http://dx.doi.org/10.1080/15548627.2017.1329081 [DOI] [PMC free article] [PubMed] [Google Scholar]
- 87. Kabeya Y, Mizushima N, Ueno T, et al. LC3, a mammalian homologue of yeast Apg8p, is localized in autophagosome membranes after processing. EMBO J 2000;19:5720–8http://dx.doi.org/10.1093/emboj/19.21.5720 [DOI] [PMC free article] [PubMed] [Google Scholar]
Associated Data
This section collects any data citations, data availability statements, or supplementary materials included in this article.


