

Summary
Acquired resistance to Docetaxel precedes fatality in hormone-refractory prostate cancer (HRPC). However, strategies that target Docetaxel resistant cells remain elusive. Using in vitro and in vivo models, we identified a subpopulation of cells that survive Docetaxel exposure. This subpopulation lacks differentiation markers and HLA class I (HLAI) antigens, while overexpressing the Notch and Hedgehog signaling pathways. These cells were found in prostate cancer tissues and were related to tumor aggressiveness and poor patient prognosis. Notably, targeting Notch and Hedgehog signaling depleted this population through inhibition of the survival molecules AKT and Bcl-2, suggesting a therapeutic strategy for abrogating Docetaxel resistance in HRPC. Finally, these cells exhibited potent tumor-initiating capacity, establishing a link between chemotherapy resistance and tumor progression.
Introduction
Prostate cancer is the most common cancer diagnosis and second leading cause of cancer-related death in men (Jemal et al., 2011). Despite the availability of local treatment, many patients relapse after primary therapy. Initially, relapsed prostate cancer patients have a hormone-dependent disease that responds to androgen withdrawal. However, despite hormonal manipulations prostate cancer progresses to a hormone refractory state (Pound et al., 1999). Docetaxel is a taxane antimitotic agent currently used as the standard therapy for patients with hormone-refractory prostate cancer (HRPC) (Petrylak et al., 2004; Tannock et al., 2004). However, patients treated with this agent inexorably experience disease progression, and because limited effective therapies exist in this context, acquired resistance to Docetaxel is commonly fatal. Presently, the main identified mechanisms of acquired resistance relate to the expression of β-tubulin isoforms/mutations and the activation of drug efflux pumps, among others (Mahon et al., 2011; Seruga et al., 2011). Unfortunately, in spite of these advances, treatment of Docetaxel-resistant patients remains a critical clinical challenge. In this study, we sought to identify a therapeutic strategy to abrogate acquired resistance to Docetaxel in HRPC.
Results
Docetaxel-Resistant Prostate Cancer Cells Lack Differentiation Markers and Show Upregulation of the Notch and Hedgehog Signaling Pathways
To study the phenomenon of relapse following Docetaxel therapy, we generated in vitro chemoresistance models using the well-established HRPC cell lines DU145 and 22Rv1. Drug-resistant cells were established by exposure to increasing concentrations of Docetaxel, and resistance was validated by cell viability, colony formation, annexin V, and poly-(ADP-ribose) polymerase (PARP) cleavage assays (Figures S1A–S1D available online). Gene expression profiling using oligonucleotide microarrays was performed to compare the sensitive parental cells (DU145/22Rv1) with the Docetaxel-resistant cells (DU145-DR/22Rv1-DR). This analysis revealed 1,245 deregulated genes in DU145-DR and 990 deregulated genes in 22Rv1-DR, of which 247 overlapped (Figure 1A). Of these overlapping genes, 29.5% were consistently upregulated and 70.5% were consistently downregulated. Gene Ontology (GO) analysis of these 247 genes revealed that, besides expected changes in biological processes, such as cell proliferation, cell death, and drug response, other categories, including cell differentiation, antigen presentation, and developmental/stemness pathways were significantly represented (Figure 1B).
Figure 1. Phenotypical Characterization of Docetaxel-Resistant Cells.

(A) Genes with at least 1.8-fold increase ↑ or decrease ↓ in transcript expression comparing parental and Docetaxel-resistant cells.
(B) Gene ontology categories of overlapping genes. Categories with statistical significance (p ≤ 0.01) are represented. *GO categories related to cell proliferation, cell death, and response to drugs. **GO categories related to developmental processes. ***GO category related to antigen presentation.
(C) Heatmap illustrates epithelial differentiation, prostate specific, HLAI, and developmental (Notch and Hedgehog) gene expression of parental and Docetaxel-resistant cells.
(D) Immunoblotting and quantification of parental and Docetaxel-resistant cells for indicated proteins. SCaBER was used as a positive control for high molecular weight cytokeratins and p63.
(E) Immunofluorescent staining of parental and Docetaxel-resistant cells for indicated proteins.
See also Figure S1.
Regarding differentiation, we focused on the expression of the low molecular weight cytokeratins (CKs) 18 and 19, because these epithelial markers are specifically expressed in normal luminal human prostate cells and prostate cancer (Ali and Epstein, 2008). We also analyzed prostate-related biomarkers, including the androgen receptor (AR), prostate-specific antigen (PSA), and prostate-specific membrane antigen (PSMA). We observed that DU145-DR and 22Rv1-DR showed a dramatic decrease in mRNA (Figure 1C) and protein levels of CK18 and CK19 (Figures 1D and 1E). 22Rv1, which expresses prostate-related differentiation markers, showed a decrease in mRNA and protein levels of PSMA and PSA, as well as a decrease in AR protein expression in Docetaxel-resistant cells (Figure 1D). Because loss of luminal markers could indicate a possible shift to a basal phenotype, we analyzed the expression of high molecular weight CKs and the prostate basal markers CD44 and p63. High molecular weight CKs (CK5 and CK14) and p63 remained undetectable in the drug-resistant cells as well as in their respective parental cells (Figures 1C and 1D). CD44 mRNA and protein levels were increased in DU145-DR and decreased in 22RV1-DR relative to their parental lines, indicating a cell line-dependent effect (Figures 1C and 1D). Therefore, the decrease in luminal differentiation and prostate-specific markers was not associated with a consistent shift to a basal phenotype. Further, Docetaxel-resistant cells did not express other lineage markers (Figure S1E). Finally, Docetaxel-resistant cells showed a strong downregulation of the mRNA level of HLAI antigens A, B, C, E, F, and G (Figure 1C), which was confirmed with a pan-HLAI antibody by immunoblotting (Figure 1D) and immunofluorescence (Figure 1E).
Regarding the developmental/stemness category, we observed that Docetaxel-resistant cells showed a marked upregulation of the Notch and Hedgehog signaling pathways. There was increased NOTCH2 and HES1 mRNA levels (Figure 1C), which was associated with increased cleaved Notch2 and Hes1 protein expression (Figure 1D) and cleaved Notch2 localization within the nucleus, where it exerts its activity (Figure 1E). Moreover, resistant cells showed reduced expression of the Hedgehog receptor Patched, which normally inhibits the activity of Smo, a positive regulator of the Hedgehog pathway (Figures 1C and 1D). This was associated with increased protein levels and nuclear localization of the transcription factors Gli1 and Gli2 (Figures 1D and 1E), consistent with Hedgehog pathway activation. In summary, Docetaxel-resistant HRPC cells displayed a phenotype characterized by loss of epithelial differentiation markers, prostate-specific antigens, and antigen presentation molecules, as well as an increase in the Notch and Hedgehog developmental signaling pathways.
Primary and Metastatic Prostate Cancer Tissues Contain Cells that Display the Docetaxel Resistance Phenotype and Associate with Tumor Aggressiveness
We next investigated whether cells with the identified Docetaxel-resistant phenotype were detectable in human prostate cancer tissue samples. We analyzed paraffin embedded tissues from 31 untreated primary prostate tumors from patients who had undergone radical prostatectomy and 36 metastatic prostate cancer tissue samples from untreated or Docetaxel-treated patients. Immunofluorescence-based double staining revealed that all prostate cancer tumors had a small subpopulation of CK-negative (CK−) tumor cells that displayed the Docetaxelresistant phenotype observed in our in vitro models. CK18−/CK19− cells were mainly HLAI-negative (HLA−) (98.5% ± 1.1%) and displayed nuclear expression of cleaved Notch2 (72.8% ± 15.1%), Gli1 (67.5% ± 17.3%) and Gli2 (67% ± 17.3%), whereas CK-positive (CK+) cells were HLAI-positive (HLAI+, 99.6% ± 0.3%) and showed significantly lower nuclear expression of developmental transcription factors (p < 0.0001, Figure 2A). Moreover, CK− tumor cells lacked expression of nuclear AR, whereas CK+ cells displayed nuclear AR in 71.8% ± 14.3% of the cells (p < 0.0001; Figure 2B). Further, CK− cells did not express high molecular weight CK5 and CK14, or p63 (Figure S2A). Finally, CK− cells did not exhibit morphological criteria of necrosis (Figure S2B), and a subset expressed the proliferative marker Ki67 (Figure S2C).
Figure 2. Docetaxel-Resistant Cells Are Present in Prostate Cancer Tissue Samples and Associate with Tumor Aggressiveness.
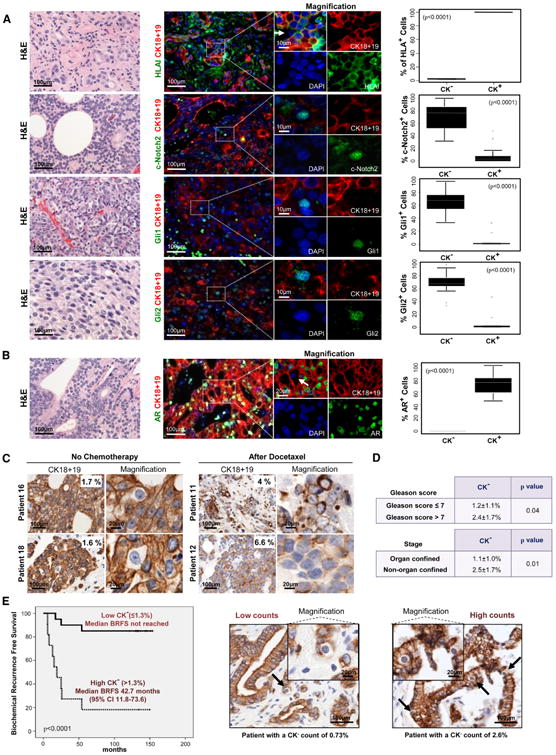
(A and B) Hematoxylin and eosin (H&E) and immunofluorescent staining analyses of prostate cancer metastases for indicated proteins. White arrows point to CK− cells. Corresponding box plots show protein expression in CK− and CK+ cells, including (from top) upper outliers, maximum (excluding outliers), upper quartile, median, lower quartile, minimum (excluding outliers), and lower outliers.
(C) CK18 and CK19 immunohistochemistry of clinical metastatic prostate cancer tissues nontreated and treated with Docetaxel.
(D) Association between the percentage of CK− cells with Gleason Score and pathological stage in primary prostate cancer tissues.
(E) Kaplan-Meier analysis of biochemical recurrence free survival of primary prostate cancer patients (n = 31) with low CK− content (≤1.3%) compared to high CK− content (>1.3%). Representative samples with low and high percentage of CK− cells. Black arrows point to CK− cells. Data is represented as means ± SD. See also Figure S2 and Table S1.
Quantitative analysis revealed that in 31 primary tumors CK− cells accounted for a mean of 1.3% ± 0.94% of the total tumor cell population, whereas in the 36 metastatic prostate tissues this cell population accounted for 3.2% ± 2.2% (Table S1). Therefore, specimens from advanced disease exhibited a higher percentage of CK− cells (p < 0.0001). Notably, 14 out of the 36 metastatic prostate cancer samples analyzed belonged to patients who had been previously treated with Docetaxel and had the highest percentage of CK− cells (5.2% ±2.1%), whereas tumors of the other 22 untreated patients had a lower percentage of CK− cells (1.8% ± 1.4%; p < 0.0001; Figure 2C). Thus, cells with the Docetaxel-resistant phenotype were more abundant in metastatic tumors and after chemotherapy treatment.
Next, we investigated if this subpopulation had prognostic significance in primary prostate cancer. Quantitative analysis performed in the 31 primary prostate tumor samples showed that the percentage of the CK− cells was significantly related to established clinicopathologic prognostic factors like tumor grade (Gleason score) and pathological disease stage (Figure 2D). Further, patients with a high percentage of CK− cells had a shorter time to biochemical (PSA) relapse than did patients with a low percentage of CK−cells (p < 0.0001; Figure 2E). In summary, cells displaying the Docetaxel-resistance phenotype were detectable in primary and metastatic prostate cancer tissue samples, increased in number after chemotherapy, and their abundance was associated with tumor aggressiveness and clinical prognosis.
A Subpopulation of Prostate Cancer Cells Exhibits the Docetaxel Resistance Phenotype and Survives Docetaxel Exposure
We next investigated whether the changes observed during the acquisition of Docetaxel resistance were the result of transition of sensitive cells toward a resistant phenotype or if chemotherapy had selected for a subpopulation of intrinsically Docetaxel-resistant cells (Figure 3A). Because both DU145-DR and 22Rv1-DR cells displayed downregulation of CK19 and CK18, we chose these markers to determine if CK− cells were present in the parental cell lines before any treatment. Immunofluorescence and flow cytometry revealed a small CK− subpopulation in both DU145 and 22Rv1 parental cells (Figure 3B).
Figure 3. Docetaxel Exposure Selects for Pre-Existing Resistant Prostate Cancer Cells.
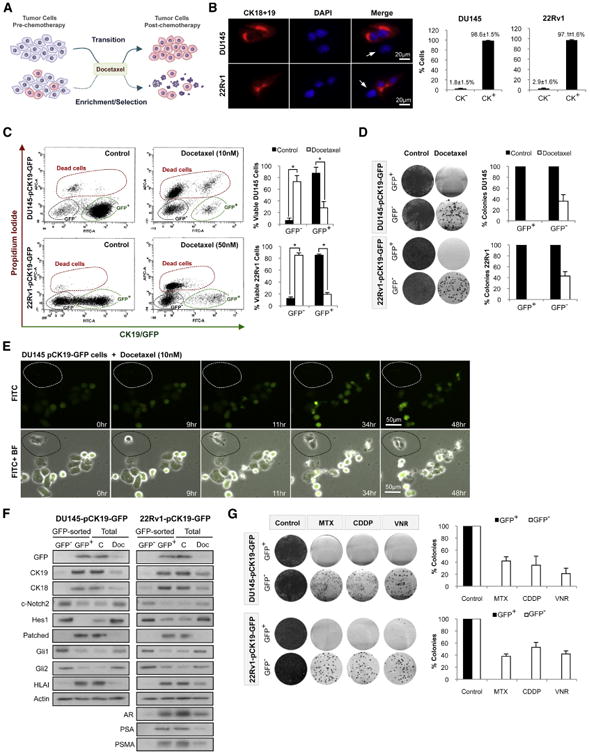
(A) Working hypotheses; transition versus enrichment-selection induced by Docetaxel.
(B) Immunofluorescence and flow cytometry quantification of CK18 and CK19 expression in DU145 and 22Rv1. White arrows point to cells with a CK− phenotype.
(C) Flow cytometry analysis of DU145-pCK19-GFP and 22Rv1-pCK19-GFP treated with Docetaxel (72 hr).
(D) Colony formation assay and quantification of sorted DU145-pCK19-GFP and 22Rv1-pCK19-GFP cells cultured with Docetaxel, 10 and 50 nM respectively, for 72 hr, or DMSO.
(E) Time-lapse microscopy of DU145-pCK19-GFP treated with Docetaxel. Dotted area shows a CK19/GFP− cell.
(F) Immunoblots of GFP and Docetaxel-resistance markers in DU145-pCK19-GFP and 22Rv1-pCK19-GFP sorted cells, as well as in unsorted DU145-pCK19-GFP and 22Rv1-pCK19-GFP cells exposed to Docetaxel (72 hr) at the same concentrations as in (D).
(G) Colony formation assays and quantification of DU145-pCK19-GFP and 22Rv1-pCK19-GFP sorted cells cultured with or without Mitoxantrone 125 and 500 nM, Cisplatin 5 and 2.5 μM, and Vinorelbine 500 and 750 nM, respectively (all 72 hr). Data is represented as means ± SD of triplicate experiments. *p < 0.0001.
We next investigated if this subpopulation could contribute to the acquisition of Docetaxel resistance. To test this hypothesis we designed a strategy to track the behavior of CK− cells under chemotherapy. We cloned a region of the CK19 promoter into a GFP vector, creating a reporter system for the expression of CK19 under different experimental conditions (Tripathi et al., 2005). DU145 and 22Rv1 parental cells were transfected with the pCK19-GFP construct and selected to establish stable cell lines named DU145-pCK19-GFP and 22Rv1-pCK19-GFP. Co-expression of CK19 and GFP was validated by immunofluorescence (Figure S3A), and PCR confirmed stable integration of the construct (data not shown).
We then tested whether CK19/GFP− cells survived Docetaxel exposure and were responsible for acquired chemoresistance (Figure 3C). Analysis of DU145-pCK19-GFP cells by flow cytometry showed that CK19/GFP+ cells were a majority (87.5% ± 10.4%) of the total population before any treatment. However, the viable CK19/GFP+ population was reduced to 28.3% ± 10.6% after exposure to 10 nM Docetaxel for 72 hr. In contrast, the viable CK19/GFP− population increased from 4.4% ± 4.3% to 73.1% ± 10.2%. Similar results were observed in 22Rv1-pCK19-GFP cells after exposure to 50 nM Docetaxel, with viable CK19/GFP− cells increasing from 8.5% ± 3.5% to 78.6% ± 4.1%, whereas viable CK19/GFP+ cells decreased from 85.0% ± 2.0% to 19.3% ± 3.4%. Further, colony formation assays showed that only CK19/GFP− cells formed colonies after exposure to Docetaxel (Figure 3D). Next, we analyzed the behavior of DU145-pCK19-GFP and 22Rv1-pCK19-GFP in the presence of Docetaxel by live imaging. We observed that CK19/GFP− cells were able to divide and exit mitosis under therapy, whereas CK19/GFP+ cells died after mitotic arrest (Figure 3E; Figure S3B; Movies S1 and S2). Finally, we characterized the CK19/GFP− and CK19/GFP+ populations of DU145-pCK19-GFP and 22Rv1-pCK19-GFP, both under control and Docetaxel-treated conditions (Figure 3F). Immunoblots confirmed that CK19/GFP− cells exhibited the Docetaxel-resistance markers, namely, reduced CK18, CK19, HLAI, Patched, AR, PSMA, and PSA expression, as well as upregulation of cleaved Notch2, Hes1, Gli1, and Gli2. Moreover, unsorted cells treated with Docetaxel underwent the expected reduction in differentiation markers and an increase in developmental signaling pathways.
We also observed that CK19/GFP− cells exhibited a multidrug resistance phenotype. Indeed, CK19/GFP− cells from DU145-pCK19-GFP and 22Rv1-pCK19-GFP treated with DNA damaging agents (Mitoxantrone and Cisplatin) and other antimitotic agents (Vinorelbine) formed colonies, whereas CK19/GFP+ cells failed to do so (Figure 3G).
Combined Notch and Hedgehog Signaling Inhibition Depletes Docetaxel-Resistant Prostate Cancer Cells
Given our findings that CK19− cells mediate acquired Docetaxel resistance in vitro and that these cells were more abundant in prostate cancer patients treated with Docetaxel, we investigated whether these cells could be targeted to inhibit acquired resistance to Docetaxel. The upregulation of Notch and Hedgehog signaling in DU145-DR and 22Rv1-DR (Figure 1) prompted us to investigate the role of these pathways in the survival of CK− cells. We used shRNAs to knock down genes critical for Notch and Hedgehog signaling in DU145-pCK19-GFP and 22Rv1-pCK19-GFP. ShRNAs against NOTCH2, GLI1, and GLI2 were used in biological replicates conferring a 90% reduction in protein levels (Figure S4A). NOTCH2 knockdown reduced the mRNA levels of the Notch target genes HES1 and HEY1, and GLI1 and GLI2 knockdown reduced the mRNA levels of the Hedgehog target gene SMO, confirming that knockdown of these genes disrupted Notch and Hedgehog signaling (Figure S4B).
We then analyzed the effects of Notch and Hedghehog knockdown on CK19− cells. Colony formation assays of GFP− and GFP+ sorted DU145-pCK19-GFP and 22Rv1-pCK19-GFP cells expressing shRNAs against NOTCH2, GLI1, and GLI2 revealed that individual knockdown of Notch or Hedgehog signaling did not have an effect on the colony formation of CK19/GFP− or CK19/GFP+ cells (Figure 4A; Figure S4C). In contrast, concomitant knockdown of both pathways dramatically abrogated the ability of CK19/GFP− cells to form colonies, whereas CK19/GFP+ cells were unaffected (Figure 4A; Figure S4C). These results indicate that both Notch and Hedgehog signaling pathways in combination are required for the maintenance of cells displaying the Docetaxel-resistant phenotype.
Figure 4. Docetaxel-Resistant Prostate Cancer Cells Are Dependent on Notch and Hedgehog Signaling.
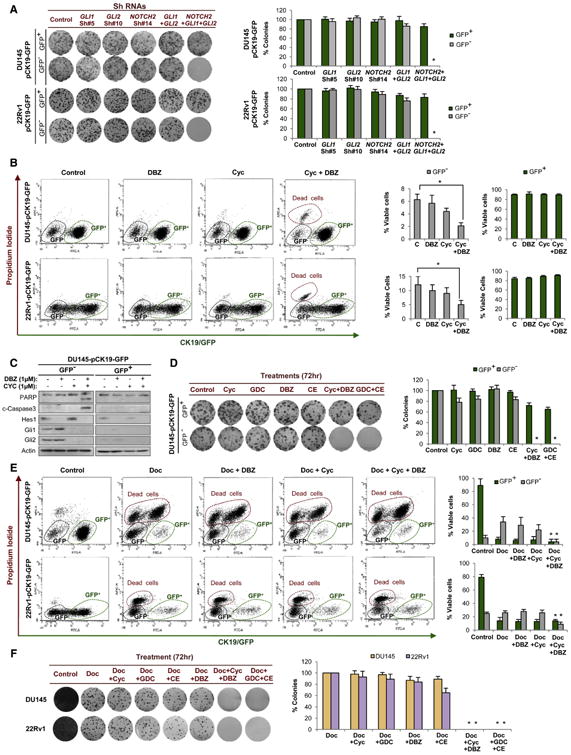
(A) Colony formation assay and quantification of DU145-pCK19-GFP- and 22Rv1-pCK19-GFP-sorted cells expressing shRNAs against GLI1, GLI2, and NOTCH2 alone, as well as double (GLI1 and GLI2) and triple knockdowns.
(B) Flow cytometry analysis of DU145-pCK19-GFP and 22Rv1-pCK19-GFP treated with Cyclopamine (1 μM) and/or DBZ (1 μM, both 48 hr).
(C) Immunoblots of indicated proteins in DU145-pCK19-GFP cells treated with the same conditions as (B).
(D) Colony formation assay and quantification of DU145-pCK19-GFP-sorted cells exposed for 72 hr to Cyclopamine, GDC-0449, DBZ, and Compound E (all 1 μM), alone or in combination (Cyc+DBZ or GDC+CE).
(E) Flow cytometry analysis after Docetaxel (48 hr) alone or in combination with Cyclopamine and/or DBZ (both 1 μM). DU145-pCK19-GFP and 22Rv1-pCK19-GFP cells were treated with 10 and 50 nM Docetaxel, respectively.
(F) Colony formation assay and quantification of parental DU145 and 22Rv1 cells exposed for 72 hr to Docetaxel (10 and 50 nM, respectively) alone or in combination with Notch inhibitors (CE or DBZ, both 1 μM) and/or Hedgehog inhibitors (Cyclopamine or GDC-0449, both 1 μM). Data are represented as means ±SD of triplicate experiments. *p < 0.05.
See also Figure S4.
We further validated these findings using the chemical inhibitors Cyclopamine and GDC-0449, Hedgehog pathway antagonists that act at the level of Smo (Chen et al., 2002; Karhadkar et al., 2004; Robarge et al., 2009; Taipale et al., 2000), and DBZ and Compound E, gamma-secretase inhibitors that block proteolytic processing of Notch (Seiffert et al., 2000; van Es et al., 2005). Quantitative RT-PCR of pathway target genes confirmed that these pharmacological inhibitors were targeting their respective pathways (Figure S4D). Flow cytometry analysis of DU145-pCK19-GFP and 22Rv1-pCK19-GFP cells treated with a combination of Notch and Hedgehog inhibitors showed a significant loss in cell viability of CK19/GFP− cells and no effect on CK19/GFP+ cells (Figure 4B). The decrease in CK19/GFP− cell viability was due to the induction of an apoptotic response, as demonstrated by Caspase-3 and PARP cleavage (Figure 4C; Figure S4E). Finally, as observed in the genetic knockdown studies, colony formation assays confirmed that combined pharmacological inhibition of Notch and Hedgehog signaling selectively depleted CK19/GFP− cells (Figure 4D; Figure S4F).
These results indicated that combined Notch and Hedgehog inhibition could target CK19− Docetaxel-resistant cells. Therefore, we hypothesized that a combination strategy of Docetaxel plus developmental pathway inhibitors could ablate both CK+ and CK− compartments. Indeed, flow cytometry analysis of DU145-pCK19-GFP and 22Rv1-pCK19-GFP revealed that triple combinations of Cyclopamine and DBZ with Docetaxel reduced the viability of both CK19/GFP− and CK19/GFP+ cells (Figure 4E). As expected, triple combination completely ablated the colony formation capacity of both DU145 and 22Rv1 parental cell lines (Figure 4F).
Abrogation of Acquired Docetaxel Resistance In Vivo through Notch and Hedgehog Signaling Inhibition
We next evaluated the effects of this combination strategy in vivo. For these experiments dexamethasone was used as a coadjuvant therapy to reduce the gut toxicity of gamma-secretase inhibitors (Real et al., 2009). NOD/SCID mice bearing DU145 and 22Rv1 xenografts were treated with dexamethasone alone, dual combinations (e.g., dexamethasone plus Docetaxel), triple combinations (e.g., dexamethasone plus Docetaxel plus DBZ), or a quadruple combination (dexamethasone plus Docetaxel plus Cyclopamine plus DBZ). Xenografts treated with dexamethasone and Docetaxel temporarily stabilized tumor volume before progression. Remarkably, mice treated with the quadruple combination showed a robust inhibition of tumor growth during the course of the experiment (15 weeks), compared to mice under the other combination regimes, therefore mirroring our in vitro results (Figure 5A). Inhibitory effects of the drugs on their respective signaling pathways was confirmed by testing the mRNA levels of Notch and Hedgehog pathway genes in tumor cells obtained from xenografts 4 hr after drug administration (Figure 5B). Moreover, in agreement with our in vitro and human sample results, Docetaxel treatment of DU145 and 22Rv1 xenografts enriched for CK− cells, and xenografts treated with the quadruple combination displayed a lower percentage of CK− cells in comparison to Docetaxel-treated animals (Figure 5C). To control for possible drug toxicity associated with the quadruple combination, we substituted Docetaxel for Etoposide, a chemotherapy agent with minor efficacy in prostate cancer (Figure S5A). Whereas similar toxicity (% body weight reduction) was observed (Figure S5B), there was no significant delay in tumor growth (Figure S5C), indicating that the efficacy of the quadruple therapy was not a result of drug toxicity. These results indicated that CK− Docetaxel-resistant cells were critically dependent on Notch and Hedgehog signaling, giving the rationale for an efficacious combination strategy.
Figure 5. Notch and Hedgehog Inhibition Abrogates the Acquisition of Docetaxel Resistance.

(A) Changes in tumor volume of DU145 and 22RV1 xenografts treated with Dexamethasone alone, double combinations, triple combinations, and quadruple combination. Dose schedules were Dexamethasone (15 mg/kg/i.p. daily), Docetaxel (10 mg/kg/i.p. once a week for 3 weeks every 4 weeks), DBZ (10 mM/kg/ip daily for 15 days every 4 weeks), and Cyclopamine (50 μg/kg/sc daily).
(B) Quantitative RT-PCR of Notch and Hedgehog target genes in DU145 and 22RV1 xenografts obtained from mice treated with the same drugs and concentrations as in (A). Bars represent fold change in mRNA levels relative to vehicle (control).
(C) Microphotographs illustrate the expression of low molecular weight cytokeratins (CK18 and CK19) in DU145 and 22RV1 prostate cancer tumor xenografts in NOD/SCID mice treated for 4 weeks with the same drugs as in (A). Magnifications illustrate CK− cells. Histogram represents the percentage of CK− cells detected in DU145 and 22RV1 xenografts for each treatment arm. Four xenografts for each treatment group where analyzed. Data is represented as means ± SD. *p < 0.05.
See also Figure S5.
Notch and Hedgehog Signaling Regulate Survival Molecules in Docetaxel-Resistant Cells
Our studies suggested that Notch and Hedgehog signaling were critical regulators of acquired Docetaxel resistance (Figures 4 and 5). In order to elucidate the molecular mechanisms underlying these observations, we investigated the downstream effectors of Notch and Hedgehog signaling in CK19/GFP− Docetaxel-resistant cells. Notch signaling can activate the prosurvival PI3K/AKT signaling pathway (Meurette et al., 2009; Palomero et al., 2007), whereas Hedgehog signaling can upregulate the antiapoptotic molecule Bcl-2 (Dierks et al., 2007; Singh et al., 2010). Therefore, we speculated that Notch and Hedgehog signaling may regulate CK19/GFP− Docetaxel-resistant cells through prosurvival and antiapoptotic mechanisms, respectively.
We first examined AKT phosphorylation (Ser473) and Bcl-2 expression in the CK19/GFP− and CK19/GFP+ populations of DU145-pCK19-GFP and 22Rv1-pCK19-GFP. Immunoblots revealed that in both cell lines the CK19/GFP− compartment displayed increased levels of p-AKT (Ser473) and Bcl-2 (Figure 6A). To assess whether these survival molecules were indeed regulated by Notch and Hedgehog signaling in CK19/GFP− cells, we performed experiments using chemical inhibitors of Notch and Hedgehog signaling. Immunoblots showed that inhibition of Notch signaling and inhibition of Hedgehog signaling significantly reduced p-AKT (Ser473) and Bcl-2 levels, respectively (Figure 6B; Figure S6A).
Figure 6. Notch and Hedgehog Signaling Regulate Survival Molecules in Docetaxel-Resistant Cells.

(A) Immunoblots of indicated proteins in CK19/GFP− and CK19/GFP+ sorted cells from DU145-pCK19-GFP and 22Rv1-pCK19-GFP.
(B) Immunoblots of indicated proteins in DU145-pCK19-GFP− and 22Rv1-pCK19-GFP− cells exposed for 72 hr to DBZ and/or Cyclopamine (both 1 μM).
(C) Immunoblots of indicated proteins in DU145-pCK19-GFP− and 22Rv1-pCK19-GFP− cells exposed for 72 hr to LY294002 (50 μM) and/or ABT-737 (10 μM).
(D) Colony formation assay and quantification of colonies derived from GFP− and GFP+ cells exposed to the same drugs and concentrations as in (C).
(E) Flow cytometry analysis after 48 hr administration of Cyclopamine (1 μM) and/or DBZ (1 μM) of DU145-pCK19-GFP and 22Rv1-pCK19-GFP cells stably transfected with empty vector (EV), MYR-AKT and BCL2. Immunoblots illustrate the overexpression levels of pAKT (Ser-473) and Bcl-2.
(F) Colony formation assay and quantification of DU145-pCK19-GFP- and 22Rv1-pCK19-GFP-sorted cells stably transfected with empty vector (EV), MYR-AKT, or BCL2 and exposed for 72 hr to Cyclopamine (Cyc), GDC-0449 (GDC), DBZ, and Compound-E (CE, all 1 μM), alone or in combination.
(G) Colony formation assays and quantifications of GFP+-sorted DU145-pCK19-GFP and 22Rv1-pCK19-GFP stably transfected with EV, MYR-AKT, or BCL2 and treated for 72 hr with Mitoxantrone 125 and 500 nM, Cisplatin 5 and 2.5 μM, and Vinorelbine 500 and 750 nM, respectively. Data is represented as means ± SD of three independent experiments. *p < 0.05.
See also Figure S6.
To determine whether the activity of these downstream effectors was necessary for CK19/GFP− cell survival, we tested the combined effects of LY294002, a selective inhibitor of the PI3K/AKT pathway (Vlahos et al., 1994), and ABT-737, an inhibitor of the Bcl-2 family members (Oltersdorf et al., 2005). These studies revealed that combined, but not individual, PI3K/AKT and Bcl-2 inhibition induced apoptosis (Figure 6C) and reduced colony formation (Figure 6D) in CK19/GFP− cells, recapitulating the effect observed with Notch and Hedgehog inhibitors (see Figure 4). To further validate the role of Notch and Hedgehog signaling in CK19/GFP− cells through PI3K/AKT and Bcl-2, we performed rescue experiments. As expected, combined inhibition of Notch and Hedgehog signaling reduced the viability and colony formation of CK19/GFP− cells, whereas overexpression of either a constitutively active myristoylated form of AKT (MYR-AKT) or Bcl-2 reduced the inhibitory effect of these inhibitors (Figures 6E and 6F). Interestingly, we further observed that overexpression of either MYR-AKT or Bcl-2 in the CK19/GFP+ populations of DU145-pCK19-GFP and 22Rv1-pCK19-GFP was sufficient to confer a multidrug resistant phenotype in these previously sensitive cells (Figure 6G). This data was consistent with previous reports that overexpression of these molecules contributes to resistance to an array of chemotherapeutics (Pommier et al., 2004).
Next, we assessed the expression of drug efflux mechanisms in CK19/GFP− cells. Current evidence suggests that the taxane chemotherapeutics are substrates for p-Glycoprotein/ABCB1 (Gottesman et al., 2002). We observed that P-gp/ABCB1 was elevated in the CK19/GFP− population of 22Rv1-pCK19-GFP but not DU145-pCK19-GFP (Figure S6B). Consistent with these results, 22Rv1, but not DU145, exhibited a side population using a Hoechst 33342 assay (Figure S6C). Finally, we observed that Notch and Hedgehog signaling did not regulate ABCB1 mRNA in 22Rv1-pCK19-GFP− cells (Figure S6D). Thus, expression of this drug efflux molecule was not a consistent feature of CK19/GFP− cells. Taken together, these data suggest that Notch and Hedgehog signaling regulate the activation of AKT and expression of Bcl-2, respectively, to promote survival and multidrug resistance in a P-gp/ABCB1 drug efflux independent mechanism.
Docetaxel-Resistant Prostate Cancer Cells Have Potent Tumor-Initiating Capacity
A number of studies have shown that tumor-initiating cells (T-ICs) may preferentially survive exposure to chemotherapy, providing an attractive rationale for relapse following initial tumor shrinkage with standard therapy (Corbin et al., 2011; Ishikawa et al., 2007; Lonardo et al., 2011; Todaro et al., 2007; Yu et al., 2007). Having demonstrated that CK− cells survive Docetaxel exposure in vitro and in vivo, we investigated the tumor-initiating capacity of these cells. Because efficient xenotransplantation is a major criterion for the validation of a T-IC-enriched compartment (Dalerba et al., 2007; Vermeulen et al., 2008; Visvader and Lindeman, 2008), we performed serial dilution tumor initiation assays using the Docetaxel-resistant models. Interestingly, DU145-DR and 22Rv1-DR had higher tumor-initiating capacity than did their parental sensitive cells when injected into NOD/SCID IL-2 receptor gamma chain null (NSG) mice (Figure 7A). These results indicate that DU145 and 22Rv1 Docetaxel-resistant cells display 15.8- and 22.4-fold higher tumor-initiating capacity than did their parental cells, respectively.
Figure 7. Docetaxel-Resistant Prostate Cancer Cells Have High Tumor-Initiating Capacity.

(A) Tumor incidence, T-IC frequency, and latencies 36 weeks after injection of limiting dilutions of parental and Docetaxel-resistant cells.
(B) Tumor incidence, T-IC frequency, and latencies 38 weeks after injection of limiting dilutions of DU145 and 22RV1 HLAI-sorted cells.
(C) Image of a mouse bearing tumors after injection of DU145 HLAI− cells in the upper flanks and HLAI+ cells in the lower flanks. H&E and immunofluorescence of indicated proteins in representative tumor xenografts generated from DU145 and 22RV1 HLAI− cells. White arrows point to CK− cells with positive nuclear staining of transcription factors and lack of HLAI and AR.
(D) Table summarizes prostate cancer patients' clinicopathological characteristics, tumor incidence, T-IC frequency, and latencies after 61 weeks of injection of limiting dilutions of HLAI-sorted cells from fresh human prostate cancer samples.
(E) H&E and immunofluorescence analysis of indicated proteins in human tumors and primary and secondary xenografts generated from HLAI− cells. Patient 9 is represented. White arrows point to CK− cells with nuclear expression of transcription factors and lack of HLAI and AR.
(F) Tumor incidence and latencies 24 weeks after injection of 100 HLAI−-sorted cells from prostate cancer xenografts treated with DMSO, Dexamethasone 15 mg/kg/i.p. daily, Cyclopamine 50 μg/kg/sc daily plus dexamethasone, DBZ 10 μM/kg/i.p. daily for 15 days every 4 weeks plus Dexamethasone, or with triple combination. Data is represented as means ± SD. *p < 0.05.
See also Figure S7 and Table S2.
One feature of the Docetaxel-resistance phenotype was lack of HLAI expression (Figures 1 and 2). Therefore, we reasoned that viable CK− Docetaxel-resistant cells could be isolated from bulk populations using HLAI expression as a cell surface marker. Indeed, double marker flow cytometry analysis revealed that HLAI negativity closely overlapped with the CK− population both in cell lines (Figure S7A) and primary prostate cancers (Figure S7B). Thus, viable CK− and CK+ subpopulations could be isolated by flow cytometry using HLAI expression.
We next used HLAI as a cell surface marker to perform limiting dilution tumor initiation assays in NSG mice. These studies revealed that in both DU145 and 22Rv1 the HLA− compartment was at least 2,000-fold more tumorigenic than the HLAI-positive compartment (Figure 7B). Furthermore, primary xenografts formed from HLAP−/CK− cells recapitulated the phenotypic heterogeneity of the parental cell lines with an HLAI+/CK+ phenotype in the majority of the tumor cells, as well as a small HLAI−/CK− population that expressed nuclear cleaved Notch2, Gli1, and Gli2, and lacked nuclear AR (Figure 7C; Figure S7C). Further, HLAI− cells isolated from primary xenografts serially engrafted into secondary recipients, whereas HLAI+ cells rarely engrafted (Figure 7B). Thus, in both DU145 and 22Rv1, the tumor-initiating capacity of HLAI− cells was ∼2,000-fold higher than HLAI+ cells. Moreover, we used complement-mediated lysis as an alternative method to show the presence of an HLAI− cell compartment with high tumor-initiating capacity in the parental cells. Incubation of DU145 and 22Rv1 parental cells with HLAI antibody and complement induced a robust depletion of HLAI+ cells, whereas HLAI− cells remained viable (Figure S7D). The surviving HLAI− population exhibited a higher tumor-initiating capacity in comparison to the noncomplement depleted cells (Figure S7E).
To investigate the tumorigenic capacity of the identified prostate T-IC population in fresh tumors, we used primary prostate cancer tissue samples. We confirmed histologically the presence of adenocarcinoma in the processed tissue in 30 patients (Table S2). Overall, the injection of cells from 4 out of the 30 (13.3%) confirmed individual prostate cancer samples generated tumor xenografts after a median follow-up time of 55.6 weeks (range 37.3–62.0) in NOD/SCID mice. Among these four patient samples, the HLAI− cells displayed 336-fold higher tumorigenic potential compared to the HLAI+ cells (Figure 7D). Moreover, in a subanalysis using HLAI-sorted cells from primary xenografts injected into NSG mice, HLAI− cells continued to form tumors efficiently, whereas HLAI+ cells failed to engraft, indicating that tumor initiation of HLAI− cells was independent of a remnant host immune response (Figure S7F). Immunohistochemistry of tumors derived from HLAI− cells showed that they faithfully reproduced the phenotype of the primary prostate tumor with the expression of epithelial- and prostate-related markers (CKs and AR) as well as HLAI antigens in the majority of tumor cells, in addition to a small HLAI−/CK− compartment characterized by lack of AR and expression of nuclear cleaved Notch2, Gli1, and Gli2 (Figure 7E; Figure S7G). Because of the long latency of the generated prostate cancer xenografts, we confirmed their identity by short tandem repeat DNA fingerprinting (data not shown). Further, HLAI− cells isolated from primary xenografts serially engrafted into secondary recipients, whereas HLAI+ cells failed to engraft (Figure 7D). Taken together, these results suggest that the HLAI− subpopulation is highly enriched in T-ICs that sustain serial xenotransplantation and reproduce the phenotypic heterogeneity of the primary tumor.
Finally, given that our previous data suggested that Notch and Hedgehog signaling were required to sustain the viability of CK−/HLAI− cells, we assessed whether inhibition of these pathways could reduce the tumor-initiating capacity of these cells. We injected 100 HLAI−-sorted cells from human prostate cancer xenografts #5, #9, and #12 subcutaneously into NSG mice, which were treated with vehicle solution, dexamethasone alone, dual drug combinations (e.g., dexamethasone plus Cyclopamine), or triple drug combination (dexamethasone plus Cyclopamine and DBZ). Mice treated with the combination of Notch and Hedgehog inhibitors showed a significant (p < 0.0001) reduction in tumor incidence when compared to mice treated with vehicle solution (DMSO) or each inhibitor alone (Figure 7F).
Discussion
Here, we identify a population of prostate cancer cells, existing both in cell lines and patient samples, which exhibits resistance to Docetaxel, an undifferentiated phenotype, dependence on combined Notch and Hedgehog signaling, and high tumor-initiating capacity. Overall, our results have important implications for clinical oncology and prostate cancer biology.
Using two independent HRPC cell models, we identified a Docetaxel-resistance phenotype characterized by absence of epithelial differentiation markers and HLAI antigens, as well as activation of developmental pathways. Interestingly, in agreement with our data a previous study reported that treatment of a breast cancer cell line xenograft with an anthracycline resulted in the loss of CKs and other differentiation markers (Yu et al., 2007). In vitro studies revealed that the Docetaxel-resistance phenotype corresponds to a small, intrinsically multidrug resistant subpopulation present in unselected HRPC cells. We identified a small subpopulation of cells that exhibited the Docetaxel-resistance phenotype in all primary and metastatic clinical prostate cancer samples studied, and this cell population was significantly higher in metastatic patients treated with Docetaxel than in untreated patients. Further, the abundance of cells exhibiting the Docetaxel-resistance phenotype was higher in metastatic than primary samples, and in primary untreated samples its percentage was associated with canonical prognostic factors and time to biochemical relapse. Thus, the Docetaxel-resistance phenotype was consistently identified in prostate cancer as a small subpopulation, which is associated with both Docetaxel resistance and canonical prognostic parameters.
Most importantly, although resistance to Docetaxel in HRPC has been a subject of considerable interest, the development of therapeutic strategies that target Docetaxel-resistant cells has remained an elusive challenge in clinical oncology (Mahon et al., 2011; Seruga et al., 2011). Interestingly, Notch and Hedgehog signaling have been implicated in the self-renewal and differentiation of progenitor cells as well as prostate cancer tumorigenesis (Karhadkar et al., 2004; Katoh, 2007; Leong and Gao, 2008; Wang et al., 2006). The upregulation of Notch and Hedgehog signaling in our in vitro models prompted us to evaluate the role of these pathways in Docetaxel resistance in HRPC. These studies resulted in a combination strategy that abrogated tumor regrowth after Docetaxel administration in vivo. These data corroborate previous studies in other tumor types, which have found a link between activation of developmental pathways and chemotherapy resistance (Lonardo et al., 2011; Meng et al., 2009; Steg et al., 2012). Mechanistically, Notch and Hedgehog signaling regulated canonical survival molecules with well-documented roles in chemotherapy resistance (Pommier et al., 2004). These results were consistent with previous reports that Notch and Hedgehog signaling regulate canonical survival pathways in other tumor types (Dierks et al., 2007; Meurette et al., 2009; Palomero et al., 2007; Singh et al., 2010). In summary, given the limited capacity of Docetaxel to control HRPC, a widespread and fatal disease, this work lays the foundation for a promising therapeutic strategy.
Further, the identified Docetaxel-resistance phenotype enabled us to validate a bona fide T-IC population on the basis of HLAI expression in both HRPC cell lines and primary prostate clinical samples. The T-IC hypothesis posits that tumors are hierarchically organized with a distinct compartment endowed with the capacity to self-renew and generate the diversity of cells that comprise the tumor, and the gold standard for testing this hypothesis is a serial xenotransplantation assay from freshly resected human materials (Visvader and Lindeman, 2008; Zhou et al., 2009). Here, we provided evidence that a subpopulation of cells, which exhibits the Docetaxel-resistance phenotype in cell lines and prostate cancer tissues, satisfied the T-IC criteria. These results corroborate a growing body of evidence (Corbin et al., 2011; Ishikawa et al., 2007; Lonardo et al., 2011; Todaro et al., 2007; Yu et al., 2007) that T-ICs may contribute to disease progression by participating in chemotherapy resistance.
In conclusion, a common and devastating phenomenon in clinical oncology is tumor relapse following initial success with cytotoxic therapies. We provide evidence that inhibition of Notch and Hedgehog signaling in HRPC depletes a subpopulation of cells responsible for acquired Docetaxel resistance and tumor initiation, laying the foundation for a promising therapeutic strategy.
Experimental Procedures
Additional experimental procedures are described in detail in the Supplemental Experimental Procedures.
Generation of Acquired Docetaxel-Resistant Prostate Cancer Cell Models
Human HRPC cell lines, DU-145 and 22RV1, were obtained from American Type Culture Collection (ATCC) and maintained in RPMI 1640 medium (GIBCO) supplemented with 10% FBS without antibiotics. Docetaxel-resistant clones, DU-145-DR and 22RV1-DR, were selected by culturing cells with Docetaxel in a dose-escalation manner using 72 hr exposures. Initial culture was at 5 nM Docetaxel for DU145 and 25 nM for 22RV1. After sensitive clones were no longer present and surviving DU-145 and 22RV1 cells repopulated the flask, the concentration of Docetaxel was increased to 10, 25, 50, 100, and 250 nM. 22RV1-DR cells were further exposed to 500 nM. The process of acquired drug resistance took 9 months for DU-145-DR and 6.5 months for 22RV1-DR. In parallel, parental DU-145 and 22RV1 cells were exposed to DMSO (vehicle solution) in the same dose-escalation manner. Cell viability, apoptosis, immunoblotting, immunofluorescence, and quantitative RT-PCR assays are described in the Supplemental Experimental Procedures.
cDNA Microarray Analysis
22RV1, 22RV1-DR, DU-145, and DU-145-DR gene expression profiles were analyzed. Total RNA from each sample was isolated by Tryzol (Invitrogen, Carlsbad, CA, USA) and purified by RNeasy mini kit and RNase-free DNase set (Qiagen, Venlo, The Netherlands) in accordance with the manufacturer's protocols. RNA quality of all samples was tested by RNA electrophoresis and RNA LabChip analysis (Agilent, Santa Clara, CA, USA) to ensure RNA integrity. Samples were prepared for analysis with Affymetrix Human U133 arrays in accordance with the manufacturer's instructions. Gene expression levels of samples were normalized and analyzed with Microarray Suite, MicroDB, and Data Mining tool software (Affymetrix, Santa Clara, CA, USA). The absolute call (present, marginal, or absent) and average difference of 22,215 expressions in a sample, and the absolute call difference, fold change, average difference of gene expression between two or three samples were normalized and identified using this software package. Statistical analysis of the mean expression average difference of genes change was done using a t test between Docetaxel-sensitive and Docetaxel-resistant samples. Genes that were not annotated or not easily classified were excluded from the functional clustering analysis.
Gene Ontology Analysis
Genes differentially expressed in the Docetaxel-resistant cells compared to the parental-sensitive cells generated a list of commonly deregulated transcripts. This list was assessed by the DAVID Bioinformatics Resources, a web-based statistical hypergeometric test applied for enrichment analysis of gene ontology (GO) categories, which include biological process, molecular function, and cellular component (http://david.adcc.ncifcrf.gov/). GO categories enriched on the highest hierarchical level (≥level 5) at statistical significance (p < 0.01) were taken into consideration.
Generation of the pCK19-GFP Reporter Plasmid
CK19 gene promoter region was amplified from genomic DNA of DU145 cells by PCR with specific primer sets (Fw 5′-AACGCATGCTTTGGGGGGATG-3′ and Rv 5′-TCCCCCTTTACTCGGCCCCCAC-3′) as described previously (Tripathi et al., 2005). Briefly, a region of 1,768 bp corresponding to human Cytokeratin 19 promoter was amplified. The promoter region includes 1,142 bp of the 5′ UTR region, 480 bp belonging to Exon 1, and 146 bp belonging to Intron 1. The PCR products were digested with Ase l and Hind lll and cloned into pEGFPN1 vector (Clontech, Mountain View, CA, USA) previously digested with the same enzymes. As a result, the CMV promoter was removed from the original vector and the GFP expression was under control of the CK19 promoter. The final construct was confirmed by digestion and sequencing analysis. DU145 and 22Rv1 cells were transfected with pCK19-GFP construct using Lipofectamine Plus 2000 (Invitrogen). After 24 hr, medium was replaced with fresh medium and stably expressing cells selected in the presence of G418 (Invitrogen). Positive clones were confirmed by direct microscopy and immunofluorescence and also by PCR amplification of GFP coding region using specific primers (Fw 5′-TTCCTGCGTTATCCCCTGATTC-3′ and Rv 5′-GCTCCTCCGGCCCTTGCTCACCAT-3′). Notch and Hedgehog genetic (shRNA) and chemical inhibition experiments are described in the Supplemental Experimental Procedures.
Live Cell Imaging
Time-lapse videomicroscopy was used to assess Docetaxel sensitivity of DU145-pCK19-GFP and 22Rv1-pCK19-GFP cells. Cells growing in 6-well plates at low confluence were placed in the stage inside an incubator chamber at 37°C, 50% humidity and in an atmosphere of 5% CO2. Unattended time-lapse movies of randomly chosen GFP+ and GFP− DU145 and 22Rv1 cells were performed with a Nikon Eclipse Ti inverted microscope. NIS Elements AR (Nikon, Tokyo, Japan) software was used to collect and process data. Imaging was performed using a 10× objective, and images were captured using 200-ms exposure times for GFP and 20-ms for bright field every 30 min.
Human Prostate Cancer Tissue Samples
Formalin-fixed paraffin-embedded human primary (n = 31) and metastatic (n = 36) prostate cancer tissue samples were provided by the tumor bank of Columbia University Medical Center. Fresh primary prostate tumor tissue samples (n = 30) were obtained from patients who had undergone surgical procedures at Columbia University Medical Center. All samples were collected under informed consent and supervision of the Columbia University Medical Center Institutional Review Board, and all studies using these samples were approved by the Columbia University Medical Center Institutional Review Board. Tissue sections with cancer were selected by reviewing hematoxylin and eosin (H&E) stained slides. Immunohistochemistry and immunofluorescent analyses are described in the Supplemental Experimental Procedures.
Mouse Procedures
All animal experiments were approved by the Institutional Animal Care and Use Committee (IACUC) at Columbia University. Animal use and care was in strict compliance with institutional guidelines and all experiments conformed to the relevant regulatory standards established by Columbia University. Xenograft experiments were performed with 5- to 6-week-old NOD.Cg-Prkdcscid IL2rgtm1Wjl (NSG) and NOD.CB17-Prkdcscid (NOD/SCID) mice obtained from Jackson Laboratories. In vivo effects of the combination of Docetaxel with Notch and Hedgehog pathway inhibitors and assessment of tumor initiating capacity are described in the Supplemental Experimental Procedures.
Statistical Analyses
Statistical analysis was carried out with SPSS version 19.0 (SPSS, Inc., Chicago, IL, USA). Experimental data is expressed as means ± SD and analyzed by Student's t test. Association between the percentage of CK− cells and biochemical (PSA) disease recurrence was analyzed by the Kaplan-Meier method, and curves were compared by the log-rank test. All the statistical tests were conducted at the two-sided 0.05 level of significance.
Supplementary Material
Significance.
Acquisition of chemotherapy resistance is a devastating and widespread phenomenon in clinical oncology. Although Docetaxel improves survival in HRPC, patients who initially respond acquire resistance, and this event precedes therapeutic stalemate and death. This study identified a subpopulation of prostate cancer cells that contribute to Docetaxel resistance. The molecular characterization of this subpopulation culminated in an in vivo model in which a combination strategy using Docetaxel with Notch and Hedgehog inhibitors abrogated the acquisition of Docetaxel resistance. These findings provide the rationale for a therapeutic strategy in a currently intractable clinical challenge.
Acknowledgments
We thank the Flow Cytometry Shared Resource, Molecular Pathology Shared Resource, Department of Pathology, and Drs. Donna Farber and Damian Turner at Columbia University, as well as Dr. Ruth Kornreich and Edith Gould from Mount Sinai School of Medicine. Finally, we thank the TJ Martell Foundation for its support.
Footnotes
Accession Numbers: Microarray data have been deposited at GEO with the accession number GSE36135.
Supplemental Information: Supplemental Information includes seven figures, two tables, Supplemental Experimental Procedures, and two movies and can be found with this article online at http://dx.doi.org/10.1016/j.ccr.2012.07.016.
References
- Ali TZ, Epstein JI. False positive labeling of prostate cancer with high molecular weight cytokeratin: p63 a more specific immunomarker for basal cells. Am J Surg Pathol. 2008;32:1890–1895. doi: 10.1097/PAS.0b013e31817ce994. [DOI] [PubMed] [Google Scholar]
- Chen JK, Taipale J, Cooper MK, Beachy PA. Inhibition of Hedgehog signaling by direct binding of cyclopamine to Smoothened. Genes Dev. 2002;16:2743–2748. doi: 10.1101/gad.1025302. [DOI] [PMC free article] [PubMed] [Google Scholar]
- Corbin AS, Agarwal A, Loriaux M, Cortes J, Deininger MW, Druker BJ. Human chronic myeloid leukemia stem cells are insensitive to imatinib despite inhibition of BCR-ABL activity. J Clin Invest. 2011;121:396–409. doi: 10.1172/JCI35721. [DOI] [PMC free article] [PubMed] [Google Scholar]
- Dalerba P, Cho RW, Clarke MF. Cancer stem cells: models and concepts. Annu Rev Med. 2007;58:267–284. doi: 10.1146/annurev.med.58.062105.204854. [DOI] [PubMed] [Google Scholar]
- Dierks C, Grbic J, Zirlik K, Beigi R, Englund NP, Guo GR, Veelken H, Engelhardt M, Mertelsmann R, Kelleher JF, et al. Essential role of stromally induced hedgehog signaling in B-cell malignancies. Nat Med. 2007;13:944–951. doi: 10.1038/nm1614. [DOI] [PubMed] [Google Scholar]
- Gottesman MM, Fojo T, Bates SE. Multidrug resistance in cancer: role of ATP-dependent transporters. Nat Rev Cancer. 2002;2:48–58. doi: 10.1038/nrc706. [DOI] [PubMed] [Google Scholar]
- Ishikawa F, Yoshida S, Saito Y, Hijikata A, Kitamura H, Tanaka S, Nakamura R, Tanaka T, Tomiyama H, Saito N, et al. Chemotherapy-resistant human AML stem cells home to and engraft within the bone-marrow endosteal region. Nat Biotechnol. 2007;25:1315–1321. doi: 10.1038/nbt1350. [DOI] [PubMed] [Google Scholar]
- Jemal A, Bray F, Center MM, Ferlay J, Ward E, Forman D. Global cancer statistics. CA Cancer J Clin. 2011;61:69–90. doi: 10.3322/caac.20107. [DOI] [PubMed] [Google Scholar]
- Karhadkar SS, Bova GS, Abdallah N, Dhara S, Gardner D, Maitra A, Isaacs JT, Berman DM, Beachy PA. Hedgehog signalling in prostate regeneration, neoplasia and metastasis. Nature. 2004;431:707–712. doi: 10.1038/nature02962. [DOI] [PubMed] [Google Scholar]
- Katoh M. Networking of WNT, FGF, Notch, BMP, and Hedgehog signaling pathways during carcinogenesis. Stem Cell Rev. 2007;3:30–38. doi: 10.1007/s12015-007-0006-6. [DOI] [PubMed] [Google Scholar]
- Leong KG, Gao WQ. The Notch pathway in prostate development and cancer. Differentiation. 2008;76:699–716. doi: 10.1111/j.1432-0436.2008.00288.x. [DOI] [PubMed] [Google Scholar]
- Lonardo E, Hermann PC, Mueller MT, Huber S, Balic A, Miranda-Lorenzo I, Zagorac S, Alcala S, Rodriguez-Arabaolaza I, Ramirez JC, et al. Nodal/Activin signaling drives self-renewal and tumorigenicity of pancreatic cancer stem cells and provides a target for combined drug therapy. Cell Stem Cell. 2011;9:433–446. doi: 10.1016/j.stem.2011.10.001. [DOI] [PubMed] [Google Scholar]
- Mahon KL, Henshall SM, Sutherland RL, Horvath LG. Pathways of chemotherapy resistance in castration-resistant prostate cancer. Endocr Relat Cancer. 2011;18:R103–R123. doi: 10.1530/ERC-10-0343. [DOI] [PubMed] [Google Scholar]
- Meng RD, Shelton CC, Li YM, Qin LX, Notterman D, Paty PB, Schwartz GK. gamma-Secretase inhibitors abrogate oxaliplatin-induced activation of the Notch-1 signaling pathway in colon cancer cells resulting in enhanced chemosensitivity. Cancer Res. 2009;69:573–582. doi: 10.1158/0008-5472.CAN-08-2088. [DOI] [PMC free article] [PubMed] [Google Scholar]
- Meurette O, Stylianou S, Rock R, Collu GM, Gilmore AP, Brennan K. Notch activation induces Akt signaling via an autocrine loop to prevent apoptosis in breast epithelial cells. Cancer Res. 2009;69:5015–5022. doi: 10.1158/0008-5472.CAN-08-3478. [DOI] [PubMed] [Google Scholar]
- Oltersdorf T, Elmore SW, Shoemaker AR, Armstrong RC, Augeri DJ, Belli BA, Bruncko M, Deckwerth TL, Dinges J, Hajduk PJ, et al. An inhibitor of Bcl-2 family proteins induces regression of solid tumours. Nature. 2005;435:677–681. doi: 10.1038/nature03579. [DOI] [PubMed] [Google Scholar]
- Palomero T, Sulis ML, Cortina M, Real PJ, Barnes K, Ciofani M, Caparros E, Buteau J, Brown K, Perkins SL, et al. Mutational loss of PTEN induces resistance to NOTCH1 inhibition in T-cell leukemia. Nat Med. 2007;13:1203–1210. doi: 10.1038/nm1636. [DOI] [PMC free article] [PubMed] [Google Scholar]
- Petrylak DP, Tangen CM, Hussain MH, Lara PN, Jr, Jones JA, Taplin ME, Burch PA, Berry D, Moinpour C, Kohli M, et al. Docetaxel and estramustine compared with mitoxantrone and prednisone for advanced refractory prostate cancer. N Engl J Med. 2004;351:1513–1520. doi: 10.1056/NEJMoa041318. [DOI] [PubMed] [Google Scholar]
- Pommier Y, Sordet O, Antony S, Hayward RL, Kohn KW. Apoptosis defects and chemotherapy resistance: molecular interaction maps and networks. Oncogene. 2004;23:2934–2949. doi: 10.1038/sj.onc.1207515. [DOI] [PubMed] [Google Scholar]
- Pound CR, Partin AW, Eisenberger MA, Chan DW, Pearson JD, Walsh PC. Natural history of progression after PSA elevation following radical prostatectomy. JAMA. 1999;281:1591–1597. doi: 10.1001/jama.281.17.1591. [DOI] [PubMed] [Google Scholar]
- Real PJ, Tosello V, Palomero T, Castillo M, Hernando E, de Stanchina E, Sulis ML, Barnes K, Sawai C, Homminga I, et al. Gamma-secretase inhibitors reverse glucocorticoid resistance in T cell acute lymphoblastic leukemia. Nat Med. 2009;15:50–58. doi: 10.1038/nm.1900. [DOI] [PMC free article] [PubMed] [Google Scholar]
- Robarge KD, Brunton SA, Castanedo GM, Cui Y, Dina MS, Goldsmith R, Gould SE, Guichert O, Gunzner JL, Halladay J, et al. GDC-0449-a potent inhibitor of the hedgehog pathway. Bioorg Med Chem Lett. 2009;19:5576–5581. doi: 10.1016/j.bmcl.2009.08.049. [DOI] [PubMed] [Google Scholar]
- Seiffert D, Bradley JD, Rominger CM, Rominger DH, Yang F, Meredith JE, Jr, Wang Q, Roach AH, Thompson LA, Spitz SM, et al. Presenilin-1 and -2 are molecular targets for gamma-secretase inhibitors. J Biol Chem. 2000;275:34086–34091. doi: 10.1074/jbc.M005430200. [DOI] [PubMed] [Google Scholar]
- Seruga B, Ocana A, Tannock IF. Drug resistance in metastatic castration-resistant prostate cancer. Nat Rev Clin Oncol. 2011;8:12–23. doi: 10.1038/nrclinonc.2010.136. [DOI] [PubMed] [Google Scholar]
- Singh RR, Kim JE, Davuluri Y, Drakos E, Cho-Vega JH, Amin HM, Vega F. Hedgehog signaling pathway is activated in diffuse large B-cell lymphoma and contributes to tumor cell survival and proliferation. Leukemia. 2010;24:1025–1036. doi: 10.1038/leu.2010.35. [DOI] [PubMed] [Google Scholar]
- Steg AD, Bevis KS, Katre AA, Ziebarth A, Dobbin ZC, Alvarez RD, Zhang K, Conner M, Landen CN. Stem cell pathways contribute to clinical chemoresistance in ovarian cancer. Clin Cancer Res. 2012;18:869–881. doi: 10.1158/1078-0432.CCR-11-2188. [DOI] [PMC free article] [PubMed] [Google Scholar]
- Taipale J, Chen JK, Cooper MK, Wang B, Mann RK, Milenkovic L, Scott MP, Beachy PA. Effects of oncogenic mutations in Smoothened and Patched can be reversed by cyclopamine. Nature. 2000;406:1005–1009. doi: 10.1038/35023008. [DOI] [PubMed] [Google Scholar]
- Tannock IF, de Wit R, Berry WR, Horti J, Pluzanska A, Chi KN, Oudard S, Théodore C, James ND, Turesson I, et al. TAX 327 Investigators. Docetaxel plus prednisone or mitoxantrone plus prednisone for advanced prostate cancer. N Engl J Med. 2004;351:1502–1512. doi: 10.1056/NEJMoa040720. [DOI] [PubMed] [Google Scholar]
- Todaro M, Alea MP, Di Stefano AB, Cammareri P, Vermeulen L, Iovino F, Tripodo C, Russo A, Gulotta G, Medema JP, Stassi G. Colon cancer stem cells dictate tumor growth and resist cell death by production of interleukin-4. Cell Stem Cell. 2007;1:389–402. doi: 10.1016/j.stem.2007.08.001. [DOI] [PubMed] [Google Scholar]
- Tripathi MK, Misra S, Chaudhuri G. Negative regulation of the expressions of cytokeratins 8 and 19 by SLUG repressor protein in human breast cells. Biochem Biophys Res Commun. 2005;329:508–515. doi: 10.1016/j.bbrc.2005.02.006. [DOI] [PMC free article] [PubMed] [Google Scholar]
- van Es JH, van Gijn ME, Riccio O, van den Born M, Vooijs M, Begthel H, Cozijnsen M, Robine S, Winton DJ, Radtke F, Clevers H. Notch/gamma-secretase inhibition turns proliferative cells in intestinal crypts and adenomas into goblet cells. Nature. 2005;435:959–963. doi: 10.1038/nature03659. [DOI] [PubMed] [Google Scholar]
- Vermeulen L, Sprick MR, Kemper K, Stassi G, Medema JP. Cancer stem cells—old concepts, new insights. Cell DeathDiffer. 2008;15:947–958. doi: 10.1038/cdd.2008.20. [DOI] [PubMed] [Google Scholar]
- Visvader JE, Lindeman GJ. Cancer stem cells in solid tumours: accumulating evidence and unresolved questions. Nat Rev Cancer. 2008;8:755–768. doi: 10.1038/nrc2499. [DOI] [PubMed] [Google Scholar]
- Vlahos CJ, Matter WF, Hui KY, Brown RF. A specific inhibitor of phosphatidylinositol 3-kinase, 2-(4-morpholinyl)-8-phenyl-4H-1-benzopyran-4-one (LY294002) J Biol Chem. 1994;269:5241–5248. [PubMed] [Google Scholar]
- Wang XD, Leow CC, Zha J, Tang Z, Modrusan Z, Radtke F, Aguet M, de Sauvage FJ, Gao WQ. Notch signaling is required for normal prostatic epithelial cell proliferation and differentiation. Dev Biol. 2006;290:66–80. doi: 10.1016/j.ydbio.2005.11.009. [DOI] [PubMed] [Google Scholar]
- Yu F, Yao H, Zhu P, Zhang X, Pan Q, Gong C, Huang Y, Hu X, Su F, Lieberman J, Song E. let-7 regulates self renewal and tumorigenicity of breast cancer cells. Cell. 2007;131:1109–1123. doi: 10.1016/j.cell.2007.10.054. [DOI] [PubMed] [Google Scholar]
- Zhou BB, Zhang H, Damelin M, Geles KG, Grindley JC, Dirks PB. Tumour-initiating cells: challenges and opportunities for anticancer drug discovery. Nat Rev Drug Discov. 2009;8:806–823. doi: 10.1038/nrd2137. [DOI] [PubMed] [Google Scholar]
Associated Data
This section collects any data citations, data availability statements, or supplementary materials included in this article.