

Abstract
Objective
Intraspinal human spinal cord‐derived neural stem cell (HSSC) transplantation is a potential therapy for amyotrophic lateral sclerosis (ALS); however, previous trials lack controls. This post hoc analysis compared ambulatory limb‐onset ALS participants in Phase 1 and 2 (Ph1/2) open‐label intraspinal HSSC transplantation studies up to 3 years after transplant to matched participants in Pooled Resource Open‐Access ALS Clinical Trials (PRO‐ACT) and ceftriaxone datasets to provide required analyses to inform future clinical trial designs.
Methods
Survival, ALSFRS‐R, and a composite statistic (ALS/SURV) combining survival and ALS Functional Rating Scale revised (ALSFRS‐R) functional status were assessed for matched participant subsets: PRO‐ACT n = 1108, Ph1/2 n = 21 and ceftriaxone n = 177, Ph1/2 n = 20.
Results
Survival did not differ significantly between cohorts: Ph1/2 median survival 4.7 years, 95% CI (1.2, ∞) versus PRO‐ACT 2.3 years (1.9, 2.5), P = 1.0; Ph1/2 3.0 years (1.2, 5.6) versus ceftriaxone 2.3 years (1.8, 2.8), P = 0.88. Mean ALSFRS‐R at 24 months significantly differed between Ph1/2 and both comparison cohorts (Ph1/2 30.1 ± 8.6 vs. PRO‐ACT 24.0 ± 10.2, P = 0.048; Ph1/2 30.7 ± 8.8 vs. ceftriaxone 19.2 ± 9.5, P = 0.0023). Using ALS/SURV, median PRO‐ACT and ceftriaxone participants died by 24 months, whereas median Ph1/2 participant ALSFRS‐Rs were 23 (P = 0.0038) and 19 (P = 0.14) in PRO‐ACT and ceftriaxone comparisons at 24 months, respectively, supporting improved functional outcomes in the Ph1/2 study.
Interpretation
Comparison of Ph1/2 studies to historical datasets revealed significantly improved survival and function using ALS/SURV versus PRO‐ACT controls. While results are encouraging, comparison against historical populations demonstrate limitations in noncontrolled studies. These findings support continued evaluation of HSSC transplantation in ALS, support the benefit of control populations, and enable necessary power calculations to design a randomized, sham surgery‐controlled efficacy study.
Introduction
Amyotrophic lateral sclerosis (ALS) is a fatal disease involving progressive motor neuron degeneration.1 The complex pathogenesis and limited efficacy of disease‐modifying therapies predicates an urgent need for novel treatment strategies. Recent studies examining cellular transplantation for neurological disorders2 prompted interest in cell‐based therapies for ALS, and several cell types and delivery strategies are being evaluated in preclinical and translational ALS studies.3, 4
Human spinal cord‐derived neural stem cell (HSSC) intraspinal transplantation as a therapeutic approach has progressed to clinical trials in ALS patients. This approach is supported by in vitro and in vivo preclinical studies5, 6, 7, 8, 9 and demonstrated safety of HSSC intraspinal transplantation in Gottingen minipigs,10, 11 data which secured Food & Drug Administration approval to examine HSSC intraspinal transplantation in ALS patients.
We completed Phase 112, 13, 14, 15 and 216 HSSC intraspinal transplantation trials in ALS patients. Phase 1 evaluated the feasibility of injecting HSSCs directly into lumbar (L2–L4) or cervical (C3–C5) spinal cord regions in 15 ALS participants following a “risk escalation” paradigm. These spinal segments were chosen with the goal of maintaining participant function, as lumbar regions control ambulation and cervical regions control respiration. Phase 2 evaluated the safety of transplanting 2–8 million HSSCs into the cervical (C3–C5) region in 15 additional participants, with three participants also undergoing lumbar (L2–L4) transplantation of an additional 8 million HSSCs.
The Phase 1 and 2 (Ph1/2) trials confirmed the safety of HSSC transplantation, but participant numbers were small and the trials lacked a placebo arm. To determine the potential effect size for a future larger placebo‐controlled Phase 3 trial, we compared long‐term clinical outcomes and survival of our study cohort – Ph1/2 ambulatory limb‐onset ALS participants receiving intraspinal HSSC transplantation (referred to as HSSC Ph1/2) – to two historical cohorts of similar ALS participants. This article extends our most recent report16 by performing a hypothesis‐based post hoc analysis on ambulatory limb onset participants using a matching algorithm while also examining all available long‐term safety data on surviving trial participants as a further step towards conducting a Phase 3 trial. Finally, and in contrast with the most recent publication, the long‐term data allow us to look for potential efficacy windows of this cellular treatment strategy and underscore the utility of a combined function and survival statistic.
Methods
HSSC Ph1/2 participants
The HSSC product,17 surgical methods,14, 15 participant selection, immunosuppression regimen, and study activities are previously described.12, 13, 16 Phase 1, conducted at Emory University, followed a “risk escalation” design with 15 participants. To minimize potential procedure complications, the initial six participants were nonambulatory and received lumbar injections, while later groups enrolled more functional ambulatory participants.3 Phase 2, conducted at Emory University (seven participants), the University of Michigan (six participants), and Massachusetts General Hospital (two participants), was a multicenter dose escalation study.3, 16 Two ambulatory subjects had bulbar onset. The present post hoc analysis only included ambulatory Ph1/2 participants with limb‐onset disease, as nonambulatory participants with advanced disease and bulbar‐onset participants are less likely to benefit from this therapeutic approach targeting spinal motor neurons. Hence, only 22 of the 30 Ph1/2 subjects were eligible to be included in this analysis.
Control groups
HSSC Ph1/2 were open‐label feasibility/safety studies without a control population and were not powered to demonstrate efficacy. Nevertheless, similar to our prior analysis,16 to gain insight into potential benefit and plan for a future trial, participants from the Pooled Resource Open‐Access ALS Clinical Trials (PRO‐ACT) dataset18, 19 and the ceftriaxone trial (dataset provided by the Northeast ALS Consortium)20 served as historical controls. The PRO‐ACT dataset contains open‐access ALS Functional Rating Scale revised (ALSFRS‐R) and survival data for over 10,723 participants from 23 Phase 2 and 3 ALS trials conducted between 1990 and 2013, including the ceftriaxone cohort.18, 19, 21 The large data volume collected under controlled environments justifies its use as a noncontemporaneous historical dataset. PRO‐ACT participants were included only if they contained data on age, gender, disease duration, and an ALSFRS‐R score within 1 month of when records were first available to use as a baseline. The ceftriaxone study, conducted between 2006 and 2012, contained fewer ALS participants but represents a more recent cohort, justifying a separate analysis.20 For both datasets, >1 month follow‐up data were required for inclusion in our analysis.
Matching procedure
A matching procedure selected historical participants based on same gender, age difference ≤5 years, difference in baseline ALSFRS‐R scores ≤5, and difference in time from symptom onset ≤6 months. Ph1/2 participants were included in the analysis if they matched at least one participant in the comparison study and, conversely, comparison study participants were included if they matched at least one Ph1/2 participant. As a result of matching, 21 Ph1/2 subjects were compared to 1108 PRO‐ACT subjects, and 20 Ph1/2 subjects were compared to 177 ceftriaxone subjects (the Ph1/2 subjects without any matches had long onset durations).
Survival and ALS/SURV assessments
Kaplan–Meier survival curves were compared by the Wilcoxon statistic. Survival time was referenced to day of first surgery for Ph1/2 participants, the first ALSFRS‐R measurement in PRO‐ACT, and the baseline visit for ceftriaxone. PRO‐ACT matches were required to have a ALSFRS‐R observation within the first 30 days and a second observation at greater than 30 days. Ceftriaxone matches were required to have an ALSFRS‐R observation within 0.1 years from the baseline visit and at least 1 follow‐up after 0.1 years. Means of ALSFRS‐R at each follow‐up interval, without imputation, were calculated and compared with t‐tests.
To incorporate functional outcomes in addition to survival, we utilized an ALSFRS‐R/survival composite measure (ALS/SURV), a novel analysis method that is a simplification of the combined assessment of function and score (CAFS) algorithm.22 In this method, all participants are ranked at each time point by ALSFRS‐R or time to death, allowing calculation of meaningful confidence intervals in terms of ALSFRS‐R score and/or length of survival. Specifically, ALS/SURV at each time point represented either (1) ALSFRS‐R if the participant was alive, or (2) a negative value if the participant was deceased, where the earliest death was assigned the most negative value and the most recent death the smallest negative value. ALSFRS‐R was determined at baseline and 6, 12, 18, and 24 months for each participant using (1) the exact value when the participant's visit was within 0.15 years of the time point or (2) linear interpolation when the participant had ALSFRS‐R values before and after the time point. Interval windows were defined as ±0.15 years based on the ceftriaxone dataset where time was rounded to tenths of a year; thus, a 0.1‐year difference could be as high as 0.15 prior to rounding. Considering this window, a 6‐month visit could occur between 0.35 and 0.65 years (4.2–7.8 months), and a 2‐year visit between 1.85 and 2.15 years. When the participant was lost to follow‐up but not deceased, the participant was treated as lost to follow‐up from that point forward. Therefore, in our analysis the ALS/SURV composite score is equal to the current ALSFRS‐R score when the participant is alive or equal to −(maximum length of follow‐up) + (length of survival in years) if the participant died. When ranking ALS/SURV values, the highest rank was assigned to the participant with the highest ALSFRS‐R value and the lowest rank to the first participant who died. Therefore, all deceased participants at the specified time point will have lower ranks than all participants still alive.
Consider the 24‐month time point. At this time point, many subjects have died, but others are still alive and have ALSFRS‐R values. Those who have died can be ordered by time of death from shortest to longest (nearest 24 months) and ranked from 1 to D where D is the number of deaths. Those who are alive and are assessed at 24 months can be ordered by their ALSFRS‐R tests from lowest to highest and ranked from D + 1 to N where N is the total number of subjects evaluated at 24 months. For ease of interpretation, the ranks were divided by N + 1 to put them on a scale of 0 to 1, with a mean value of 0.5. A Mann–Whitney‐Wilcoxon rank sum test can then compare the two groups. This analysis at each time point using complete data (omitting subjects who have not died but do not have an ALSFRS‐R score at that time point) is presented.
While the above analysis only includes subjects who have died or have data at the time point, we also took an imputation approach. In ALS, a reasonable assumption for subjects without data is that their progression would have been similar to the subjects who continue to be followed. This can be imputed by assigning subjects who do not have values in the percentile that they had at the last time when they were observed. For example, if a subject was at the median of all subjects when last observed, then the subject will be imputed to remain at the 50th percentile relative to all the subjects at each subsequent time point. This analysis with imputed data is also presented.
Clinical safety
Available Ph1/2 safety data through August 2017 were examined for adverse events (AEs) using our previously described paradigm.16
Power analysis and statistics
The method described in this paper orders the data values by percentiles. Any other monotonic ordering yields the same results for nonparametric tests (such as the Wilcoxon test). When the percentiles are replaced by their normal deviates, the resulting data values are normally distributed with a standard deviation of one. The difference in means of the normal deviates between the groups is the empirical (observed) effect size. We performed this modified analysis for the groups in this paper to provide an estimate of the effect size.
Statistical analyses utilized SAS 9.4 (SAS Institute, Cary, NC). Graphs were plotted with GraphPad Prism (GraphPad Software, La Jolla, CA).
Results
Cohorts
Phase 1 enrolled 15 participants, but the first six were excluded from the post hoc analysis as they represented a feasibility cohort of nonambulatory, late‐stage participants (three had tracheostomies). Phase 2 enrolled 15 participants, although two subjects with bulbar‐onset disease were excluded. This resulted in 22 Ph1/2 participants (Table 1) for our current evaluation of long‐term follow‐up. As this window extended beyond our previously reported safety data,16 an updated summary of frequent AEs and serious AEs for the Phase 2 study through August 2017 is included (Table S1). There were no changes to the two previously reported serious AEs16 (subject 312 remains weaker than presurgical baseline and subject 315 continues to have neuropathic pain). Across the two Phases there were 16 deaths through August 2017 (Table S2): one was attributed to a fatal arrhythmia (due to undiagnosed cardiac hypertrophy), one was due to glioblastoma (pathology confirmed the tumor was of patient origin, deeming it unrelated to study drug or immunosuppression), and the remaining were associated with respiratory failure secondary to ALS progression. No deaths were attributed to the HSSCs, surgical device, surgical procedure, or immunosuppression paradigm, supporting the safety of HSSC transplantation for ALS.
Table 1.
Cohort demographics
| (A) Complete cohorts | |||||
|---|---|---|---|---|---|
| Characteristic | Ph1/2 | PRO‐ACT | P‐value PRO‐ACT versus Ph1/2 | Ceftriaxone | P‐value ceftriaxone versus Ph1/2 |
| Subjects (number) | 30 | 3344 | 507 | ||
| Age, years (SD) | 50.0 ± 9.9 | 55.7 ± 11.3 | 0.0038 | 55.4 ± 10.4 | 0.0070 |
| Baseline ALSFRS‐R (SD) | 32.8 ± 9.6 | 37.9 ± 5.4 | 0.0072 | 36.4 ± 5.9 | 0.053 |
| Disease duration, years (SD) | 2.6 ± 2.8 | 1.6 ± 0.9 | 0.060 | 1.6 ± 0.7 | 0.058 |
| Male (%) | 83.3 | 62.8 | 0.022 | 60.5 | 0.012 |
| Bulbar onset (%) | 6.7 | 20.5 | 0.068 | 22.9 | 0.040 |
| (B) Matched cohorts to ambulatory limb‐onset Ph1/2 participants | ||||||
|---|---|---|---|---|---|---|
| Characteristic | Ph1/2 | PRO‐ACT | P‐value PRO‐ACT versus Ph1/2 | Ph1/2 | Ceftriaxone | P‐value ceftriaxone versus Ph1/2 |
| Subjects (number) | 21 | 1108 | ‐ | 20 | 177 | ‐ |
| Age, years (SD) | 49.2 ± 10.5 | 52.9 ± 9.7 | 0.12 | 49.6 ± 10.6 | 53.3 ± 9.4 | 0.10 |
| Baseline ALSFRS‐R (SD) | 36.5 ± 5.4 | 38.1 ± 4.7 | 0.17 | 36.9 ± 5.3 | 36.7 ± 4.8 | 0.83 |
| Disease duration, years (SD) | 1.7 ± 1.1 | 1.3 ± 0.6 | 0.13 | 1.5 ± 0.8 | 1.4 ± 0.6 | 0.23 |
| Male (%) | 85.7 | 86.4 | 1.00 | 85.0 | 85.9 | 1.00 |
| Bulbar onset (%) | 0.0 | 0.0 | n/a | 0.0 | 0.0 | n/a |
PRO‐ACT, Pooled Resource Open‐Access ALS Clinical Trials; ALSFRS‐R, ALS Functional Rating Scale revised.
PRO‐ACT and ceftriaxone data were utilized for historical control populations. The PRO‐ACT dataset contained 3344 participants with complete data on gender, age, disease duration, and, if relevant, time to death (Table 1A). After eliminating those with bulbar‐onset disease and matching the PRO‐ACT subjects to Ph1/2 subjects, 1108 PRO‐ACT participants remained (Table 1B). There were no significant differences between matched groups for gender (P = 1.00 Fisher's exact test), age, duration from symptom onset, and baseline ALSFRS‐R (P = 0.12, 0.13, and 0.17, respectively, two‐tailed two‐sample t‐test with unequal variances).
The ceftriaxone dataset contained 507 participants with follow‐up data (Table 1A). After eliminating those with bulbar‐onset disease and matching to the Ph1/2 subjects, 177 participants remained (Table 1B). There were no significant differences between matched groups for gender (P = 1.00 Fisher's exact test), age, duration from symptom onset, and baseline ALSFRS‐R (P = 0.10, 0.23 and 0.83, respectively, two‐tailed two‐sample t‐test with unequal variances).
Survival analysis
Survival did not differ significantly between ambulatory limb‐onset Ph1/2 or matched PRO‐ACT and ceftriaxone participants: Ph1/2, n = 21, median survival (MS) 4.7 years, 95% CI (1.2, ∞) versus PRO‐ACT, n = 1108, MS 2.3 years, 95% CI (1.9, 2.5), Wilcoxon P = 1.0; Ph1/2, n = 20, MS 3.0 years, 95% CI (1.2, 5.6) versus ceftriaxone, n = 177, MS 2.3 years, 95% CI (1.8, 2.8), Wilcoxon P = 0.88 (Figs. 1, 2, Table 2). Survival curves deviated in the Ph1/2 and comparison cohorts after 2 years.
Figure 1.

Kaplan–Meier survival curves. (A) Matched PRO‐ACT (n = 1108) versus Ph1/2 (n = 21) participants: during follow‐up, 239 deaths were observed in the PRO‐ACT group, 11 in the Ph1/2 group (Wilcoxon P = 0.996, log‐rank 0.203). (B) Matched ceftriaxone (n = 177) versus Ph1/2 (n = 20) participants: during follow‐up, 84 deaths were observed in the ceftriaxone group, 11 in the Ph1/2 group (Wilcoxon P = 0.877, log‐rank 0.297). PRO‐ACT, Pooled Resource Open‐Access ALS Clinical Trials.
Figure 2.
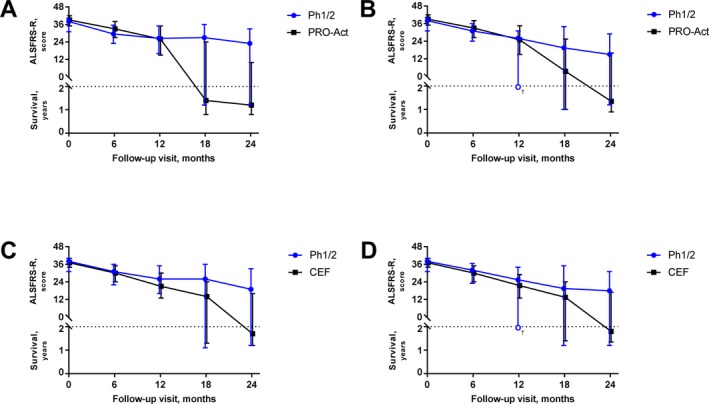
ALS/SURV outcomes for matched Ph1/2 versus PRO‐ACT and ceftriaxone cohorts: ALS/SURV outcomes are plotted by time. Each marker represents the median measure (from Table 2). The bars encompass the 25th and 75th percentile. Values above the horizontal line reflect ALSFRS‐R whereas values below reflect survival. Graphs represent absolute measures for Ph1/2 versus PRO‐ACT without losses to follow‐up (A) or with losses to follow‐up (B), and absolute measures for Ph1/2 versus ceftriaxone without losses to follow‐up (C) or with losses to follow‐up (D). For the Ph1/2 cohort, the lower quartile limit fell between a subject who was alive and a subject who had died; therefore, no value could be estimated (open circle/†; B and D). ALS, amyotrophic lateral sclerosis; ALSFRS‐R, ALS Functional Rating Scale revised; PRO‐ACT, Pooled Resource Open‐Access ALS Clinical Trials.
Table 2.
ALS/SURV rankings over time for ambulatory, limb‐onset participants
| (A) ALSFRS‐R | ||||||||||
|---|---|---|---|---|---|---|---|---|---|---|
| Ph1/2 | PRO‐ACT | Ph1/2 | Ceftriaxone | |||||||
| N | Mean (SD) | N | Mean (SD) | t‐test | N | Mean (SD) | N | Mean (SD) | t‐test | |
| Baseline | 21 | 36.5 ± 5.4 | 1108 | 38.1 ± 4.7 | 0.17 | 20 | 36.9 ± 5.3 | 177 | 36.6 ± 4.9 | 0.84 |
| 6 months | 18 | 30.6 ± 6.5 | 974 | 32.5 ± 7.6 | 0.25 | 17 | 30.8 ± 6.7 | 163 | 29.7 ± 7.6 | 0.56 |
| 12 months | 14 | 30.5 ± 9 | 655 | 28.3 ± 9.3 | 0.37 | 13 | 30.5 ± 9.3 | 134 | 23.9 ± 9.1 | 0.028 |
| 18 months | 11 | 31.8 ± 8.1 | 165 | 24.6 ± 10.4 | 0.016 | 10 | 32.2 ± 8.4 | 100 | 21 ± 9.7 | 0.0021 |
| 24 months | 11 | 30.1 ± 8.6 | 86 | 24.0 ± 10.2 | 0.048 | 10 | 30.7 ± 8.8 | 58 | 19.2 ± 9.5 | 0.0023 |
| (B) Matched cohort ALS/SURV, no imputation | ||||||||||
|---|---|---|---|---|---|---|---|---|---|---|
| Ph1/2 | PRO‐ACT | Ph1/2 | Ceftriaxone | |||||||
| N | Median (IQR) | N | Median (IQR) | Wilcoxon | N | Median (IQR) | N | Median (IQR) | Wilcoxon | |
| Baseline | 21 | 38 (31, 40) | 1108 | 39 (35, 42) | 0.12 | 20 | 38 (31, 40) | 177 | 37 (34, 40) | 0.95 |
| 6 months | 20 | 29.5 (23, 35.5) | 1012 | 33 (27, 38) | 0.11 | 19 | 31 (22, 36) | 168 | 30 (24, 35) | 0.91 |
| 12 months | 18 | 26.5 (16, 35) | 792 | 26 (15, 35) | 0.82 | 17 | 26 (16, 35) | 155 | 21 (13, 30) | 0.29 |
| 18 months | 17 | 27 (1.2 yr, 36) | 351 | 1.4 yr (0.8 yr, 24) | 0.028 | 16 | 26 (1.1 yr, 36) | 140 | 14 (1.3 yr, 24) | 0.24 |
| 24 months | 19 | 23 (1.2 yr, 33) | 306 | 1.2 yr (0.8 yr, 10) | 0.0038 | 18 | 19 (1.2 yr, 33) | 115 | 1.7 yr (1.2 yr, 16) | 0.14 |
| (C) Matched cohort ALS/SURV, with imputation | ||||||||||
|---|---|---|---|---|---|---|---|---|---|---|
| Ph1/2 | PRO‐ACT | Ph1/2 | Ceftriaxone | |||||||
| N | Median (IQR)a | N | Median (IQR)a | Wilcoxon | N | Median (IQR)a | N | Median (IQR)a | Wilcoxon | |
| Baseline | 21 | 38 (31, 40) | 1108 | 39 (35, 42) | 0.12 | 20 | 38 (31, 40) | 177 | 37 (34, 40) | 0.95 |
| 6 months | 21 | 31 (24, 36) | 1108 | 33 (26.5, 38) | 0.25 | 20 | 32 (23, 36.5) | 177 | 30 (24, 35) | 0.86 |
| 12 months | 21 | 26 (b, 31) | 1108 | 25 (15, 34.5) | 0.94 | 20 | 25.5 (b, 34) | 177 | 21.5 (13, 29) | 0.37 |
| 18 months | 21 | 19.5 (1 yr, 34) | 1108 | 3.5 (1 yr, 25.5) | 0.18 | 20 | 19.5 (1.2 yr, 35) | 177 | 13.5 (1.4 yr, 24) | 0.22 |
| 24 months | 21 | 15 (1.2 yr, 29) | 1108 | 1.35 yr (0.9 yr, 16) | 0.023 | 20 | 18 (1.2 yr, 31) | 177 | 1.8 yr (1.35 yr, 17) | 0.14 |
Note that ALS/SURV represents a combination of survival and ALSFRS‐R score. When “yr” is specified, the value refers to survival time; that is, not enough subjects were alive at that time point to estimate the median or quartile of ALSFRS‐R at that time point and therefore the length of survival is used as the estimate. ALS, amyotrophic lateral sclerosis; ALSFRS‐R, ALS Functional Rating Scale revised; PRO‐ACT, Pooled Resource Open‐Access ALS Clinical Trials; Ph1/2, Phase 1 and 2.
Values are estimated from the closest subject, and not interpolated.
The lower quartile limit fell between a subject who was alive and a subject who had died; therefore, no value could be estimated.
ALSFRS‐R
Baseline ALSFRS‐R comparing the ambulatory limb‐onset Ph1/2 participants to the PRO‐ACT and ceftriaxone cohorts were 36.5 ± 5.4 versus 38.1 ± 4.7 (P = 0.17) and 36.9 ± 5.3 versus 36.6 ± 4.9 (P = 0.84), respectively (Table 2A). At 24 months, ALSFRS‐R in Ph1/2 compared to PRO‐ACT and ceftriaxone cohorts was 30.1 ± 8.6 versus 24.0 ± 10.2 (P = 0.048) and 30.7 ± 8.8 versus 19.2 ± 9.5 (P = 0.0023), respectively.
ALS/SURV analysis
ALS/SURV ranking was required for the PRO‐ACT and ceftriaxone comparisons due to the lack of a survival difference (Figs. 1, 2, Table 2). Table 2A presents the mean ALSFRS‐R at each follow‐up interval. Table 2A and C represent the median of the ALS/SURV score, which can be either an ALSFRS‐R score or length of survival (year), and the 25–75% interquartile range (IQR). For example, if the 25th percentile is 1.4 years, then 25% of the participants died within 1.4 years. Table 2B presents the median and IQR of the ALS/SURV statistic when only observed values are used. Table 2C presents these statistics when missing values for subjects are imputed as if the subjects progressed at the same rate as the overall group; that is, remained at the same percentile as when they became lost to follow‐up.
Using only observed data, the median Ph1/2 participant's ALS/SURV at 24 months was an ALSFRS‐R of 23 (IQR 1.2 years, 33), whereas the median PRO‐ACT participant died at 1.2 years (IQR 0.8 year, 10) (P = 0.0038) (Table 2B). With imputation, the median Ph1/2 participant had a ALS/SURV of 15 (IQR 1.2 years, 29) and the median PRO‐ACT participant died at 1.35 years (IQR 0.9 year, 16) (P = 0.023) (Table 2C).
For the matched ceftriaxone comparison, the median Ph1/2 participant's ALS/SURV was 19 (IQR 1.2 years, 33) at 24 months compared to 1.7 years (IQR 1.2 years, 16) in ceftriaxone (P = 0.14) (Table 2B). When values were imputed for lost to follow‐up cases, the ALS/SURV was 18 (IQR 1.2 years, 31) for the median Ph1/2 participants and 1.8 years (IQR 1.35 years, 17) for the median ceftriaxone participant (P = 0.14) (Table 2C).
At baseline and at 6 months, PRO‐ACT had a higher average rank than Ph1/2. However, by 12‐months this is reversed and Ph1/2 has a higher average rank than PRO‐ACT; that is, for survivors Ph1/2 has a better long‐term outcome than PRO‐ACT.
As ceftriaxone did not demonstrate a treatment effect, we decided to analyze all matching participants, but for completeness, also performed separate analyses on the placebo arm that contained 171 participants with follow‐up data, 64 of which remained after matching to limb‐onset Ph1/2 subjects. There were no significant differences in gender, age, disease duration, or baseline ALSFRS‐R between these groups (data not shown). Likewise, no differences in our survival and functional assessments were detected (data not shown).
Power analysis
The 24‐month comparisons with matched Ph1/2 subjects yielded effect sizes of 0.74 and 0.49 for PRO‐ACT subjects (without and with imputation, respectively), and 0.44 and 0.37 for ceftriaxone subjects. Therefore, it is likely that the effect size of a treatment such as Ph1/2 would be in the range of 0.25–0.35. Table 3 summarizes the samples sizes that would be needed to achieve 80% or 90% power using a 2‐tailed test at a 5% level of significance with either equal sample sizes or a 2:1 allocation of subjects to treatment compared to a sham surgery that is placebo arm.
Table 3.
Power estimate
| Effect size | 0.25 | 0.30 | 0.35 |
|---|---|---|---|
| Equal sample size, 80% power (treatment, placebo) | 255, 255 | 175, 175 | 130, 130 |
| 2:1 allocation, 80% power (treatment, placebo) | 380, 190 | 260, 130 | 200, 100 |
| Equal sample size, 90% power (treatment, placebo) | 340, 340 | 235, 235 | 175, 175 |
| 2:1 allocation, 90% power (treatment, placebo) | 500, 250 | 350, 175 | 260, 130 |
Discussion
To date, ALS clinical trials of cellular therapies have focused on safety, while efficacy remains to be established. Here, we used available data from our Ph1/2 HSSC transplantation trials in ALS participants to reconfirm safety and perform post hoc comparisons to historical control datasets to gain insight into potential efficacy over a 2‐year follow‐up period. Given the HSSC Ph1/2 study designs, the post hoc analysis was limited to ambulatory limb‐onset participants (n = 22), the subpopulation most likely to benefit from cervical‐ or lumbar‐targeted HSSC treatments. Results indicate that this Ph1/2 participant subpopulation had no significantly increased survival compared to PRO‐ACT and ceftriaxone historical controls; however, survival curves comparing Ph1/2 with these cohorts clearly deviated at 2 years. While this could be the result of chance or a biased Ph1/2 population, it is possible that stem cell efficacy was not apparent until 2 years. Supporting this view is the deviation of ALSFRS‐R scores, with statistically significant higher scores in the Ph1/2 subpopulation compared to PRO‐ACT and ceftriaxone controls at 18 and 12 months, respectively. The ALS/SURV statistic also highlights functional differences between the Ph1/2 and comparison cohorts; the median Ph1/2 participant was alive with disability whereas the median participant in the PRO‐ACT and ceftriaxone cohorts had died. These analyses collectively support continued evaluation of HSSC transplantation in ALS participants, and importantly, inform future efficacy trial design.
The current report differs from our prior publication in important ways.16 First, the prior publication included only 9 months of Phase 2 follow‐up data, whereas this report includes >3 years of follow‐up data. This enables a more thorough evaluation of safety and long‐term outcomes. These long‐term data highlight differences in survival outcomes after the 2‐year mark between the Ph1/2 cohort and historical controls, indicating that the effect of HSSCs may best be measured at >1–2 years post treatment and thereby supporting the need for long‐term clinical trials and informing study design for a future trial. Additionally, the current long‐term follow‐up data allows for the investigation of efficacy windows, which if replicated in a future study would suggest that treatment provided early in disease is most optimal for allowing HSSCs time to provide a disease modifying benefit. Second, the current analysis focuses on a specific participant cohort from the Ph1/2 trials that is ambulatory with limb‐onset disease. This group is most likely to benefit from HSSC transplantation given the spinal‐onset disease and transplant locations in the cervical and/or lumbar segments. Third, we used a matching technique for our specific participant cohort to identify historical participants likely to have been selected into the Ph1/2 studies, further strengthening the current analysis. Fourth, we use an ALS/SURV statistic which enables combined analysis of survival and function, thus summarizing key ALS outcomes while accounting for losses to follow‐up, a limitation in long‐term studies. Finally, using the ALS/SURV statistic, we can perform the power calculation necessary for a future trial.
While not applied previously in ALS to our knowledge, ALS/SURV is similar to the CAFS and composite statistics used in studies where endpoints involved nerve conductions.23, 24 When there is high mortality, combining functional status with survival duration has greater comparative power and provides additional insight into potential efficacy. Hence, ALS/SURV represents an ordinal measure combining survival with ALSFRS‐R. At the extremes, if everyone died ALS/SURV would reduce to comparing survival, and if everyone survived ALS/SURV would compare function. Thus, it includes more comparative information than either measure alone, and if function and survival are positively correlated (an underlying assumption), ALS/SURV will have greater power than either measure individually. Importantly, ALS/SURV analyses were performed with and without imputation of participants lost to follow‐up. In a traditional intent‐to‐treat randomized control study, participants are included in the final analysis even if they drop out. Imputing losses to follow‐up based on ranks at the time of loss allows these participants to be included in the final analysis. The true outcome likely falls between the two analyses with or without imputation. Finally, ALS/SURV composite data were analyzed by nonparametric statistical methods using the Mann–Whitney‐Wilcoxon rank sum test, as well as normal deviates as described for the power analysis, to support other possible analyses such as modeling differences between groups.
ALS/SURV demonstrated that Ph1/2 participants maintained a higher percentage of baseline function versus PRO‐ACT and ceftriaxone participants, although these improvements were only significant relative to PRO‐ACT. Sample size hinders potential assessment of an HSSC dose–response effect in Ph1/2 participants. The power analysis simulation for a future trial drew participants from the matched Ph1/2 and ceftriaxone cohorts that had similar inclusion criteria. As a single study, ceftriaxone inclusion/exclusion criteria are well delineated, while the large number of studies in PRO‐ACT exhibit variable inclusion/exclusion criteria. Results indicate that 255 participants per group are required to achieve 80% power with equal allocation to treatment and placebo, highlighting the need for large numbers of willing participants, potentially blinded to surgical therapy, to prove intraspinal HSSC transplantation efficacy for ALS treatment.
Ph1/2 participants exhibited a significant difference in ALSFRS‐R at 24 months in both PRO‐ACT and ceftriaxone comparisons, but only for the PRO‐ACT dataset for ALS/SURV. PRO‐ACT contains data between 1990 and 2013 and the ceftriaxone study occurred between 2006 and 2012; therefore, relative to the Phase 1 2009 start date, ceftriaxone subjects had more contemporaneous treatments given its more comparable start date. Collectively, ALSFRS‐R and ALS/SURV differences in our Ph1/2 cohort versus PRO‐ACT and the ALSFRS‐R and ALS/SURV difference versus ceftriaxone supports continuing investigation of HSSC intraspinal transplantation in ALS.
We acknowledge the potential bias of historical controls,25 as bias can result from changes in patient management, patient populations, study selection criteria, diagnostic criteria, and patient willingness to participate in trials. Our data also illustrate a limitation of historical controls. Assuming that Ph1/2 participants had no difference in outcome compared to historical controls, and that the ceftriaxone study showed no treatment benefit, one would expect no differences in ALS/SURV between the three cohorts. However, because the ALS/SURV summary statistic shows a statistically significant difference between Ph1/2 and PRO‐ACT but not ceftriaxone, it raises the possibility of a period effect. Furthermore, with the availability of edaravone, historical controls may have further limitations due to changes in treatments.
This post hoc analysis has limitations. As previously mentioned, the Ph1/2 data represent two trial phases where participants received differing HSSC doses. While we objectively defined our cohorts and only performed the data analyses after matching and “locking” the comparison groups, a post hoc analysis may not represent the true outcome. Furthermore, historical controls cannot account for differences in ALS treatments over time. The ceftriaxone study was performed at 59 study sites, whereas most Ph1/2 participants were treated at two centers. Therefore, investigator‐initiated interventions, like using noninvasive ventilation, in combination with the close follow‐up required in this study, may have improved Ph1/2 participant survival as a result of maximal medical management and not the cellular therapy. The study also did not control for other possible variables, such as education, socio‐economic status, or family support, which could all impact willingness to participate in clinical studies and/or outcomes. Finally, we acknowledge that the subjects in our analysis cohort were 85% male, which does not reflect true disease gender distribution ratios; however, our goal and expectation for future studies is to include more representative ratios of males and females to ensure insight into any gender‐specific outcomes.
Overall, the Ph1/2 studies were designed as safety trials given the uncertain risk of escalating numbers and concentrations of intraspinal stem cell injections. Combined with the small numbers of participants, and as Ph1/2 trials, these studies were not designed to demonstrate efficacy. This post hoc analysis, however, demonstrates that ambulatory ALS participants receiving HSSCs exhibit significantly increased ALSFRS‐R scores relative to PRO‐ACT and ceftriaxone historical controls. In addition, they exhibited relatively better outcomes using a combined survival/functional score versus PRO‐ACT database participants. While these results should not be overinterpreted as proof‐of‐benefit, the current data support that this HSSC transplantation approach should be tested for efficacy and provide the parameters necessary to design a sufficiently powered, randomized, sham surgery placebo‐controlled study.
Author Contributions
Drs. Feldman and Goutman contributed equally to this work and both had full access to all the data in the study and take responsibility for the integrity of the data and the accuracy of the data analysis. Study concept and design: Feldman and Johe. Acquisition, analysis, or interpretation of data: All authors. Drafting of the manuscript: Goutman, Brown, Sakowski, Feldman. Critical revision of the manuscript for important intellectual content: All authors. Statistical analysis: Brown. Obtained funding: Feldman, Glass, Cudkowicz. Administrative, technical, or material support: Sakowski. Study supervision: Feldman.
Conflicts of Interest
Stephen Goutman, MD has provided consulting services for Cytokinetics. Nazem Atassi, MD provides consulting services to Biogen and MT Pharma. Merit Cudkowicz, MD provides consulting services for Biogen, MT Pharma, Cytokinetics, Biohaven, Immunity Pharm, Lilly, Denali, and Karyopharm. Karl Johe, PhD and Tom Hazel, PhD are employees of Neuralstem, Inc. Nicholas Boulis, MD consults for Agilis, Voyager, Oxford Biomedica, and NeuralStem, Inc; is an inventor of technology licensed from the Cleveland Clinic to NeuralStem for use in the current study; received salary from Above and Beyond from 2015 to 2016; and is a founder and Scientific Advisory Board member of Switch Bio. All other authors have no conflicts to report.
Supporting information
Table S1. Most frequent adverse events and serious adverse events by MedDRA category and MedDRA term – Phase 2 study (in long‐term follow‐up).
Table S2. Summary of Phase 1 and 2 subject deaths.
Acknowledgments
The authors thank the patients and family members who participated in these trials. We also thank Jayna Duell, RN, Blake Swihart, Meraida Polak, RN, and Jane Bordeau, RN for study coordination and collection of primary data. We are appreciative to Brian Callaghan, MD for his critical feedback on the manuscript. Additionally, Seward Rutkove, MD provided critical input on electrophysiologic measures. Lastly, we are grateful to the Data Safety Monitoring Board members for the Ph1/2 studies: Z. Simmons, L. Bruijn, T. Freeman, C. Gooch, D. Kaul, H. Mitsumoto, P. Park, T. Pearson, and M. Vogelbaum.
Funding Information
Funding was provided by the National Institute of Neurological Disorders and Stroke 1R01NS077982, the ALS Association, Neuralstem, Inc., the A. Alfred Taubman Medical Research Institute, and philanthropic sources. The funders had a role in the design of the study and were able to comment on the manuscript; they were not involved in the conduct of the study, collection, management, analysis, and interpretation of the data.
Funding Statement
This work was funded by National Institute of Neurological Disorders and Stroke grant 1R01NS077982; ALS Association, Neuralstem, Inc. grant ; A. Alfred Taubman Medical Research Institute grant ; philanthropic sources grant .
References
- 1. Rowland LP, Shneider NA. Amyotrophic lateral sclerosis. N Engl J Med 2001;344:1688–1700. [DOI] [PubMed] [Google Scholar]
- 2. Lunn JS, Sakowski SA, Hur J, Feldman EL. Stem cell technology for neurodegenerative diseases. Ann Neurol 2011;70:353–361. [DOI] [PMC free article] [PubMed] [Google Scholar]
- 3. Chen KS, Sakowski SA, Feldman EL. Intraspinal stem cell transplantation for amyotrophic lateral sclerosis. Ann Neurol 2016;79:342–353. [DOI] [PMC free article] [PubMed] [Google Scholar]
- 4. Goutman SA, Chen KS, Feldman EL. Recent advances and the future of stem cell therapies in amyotrophic lateral sclerosis. Neurotherapeutics 2015;12:428–448. [DOI] [PMC free article] [PubMed] [Google Scholar]
- 5. Hefferan MP, Galik J, Kakinohana O, et al. Human neural stem cell replacement therapy for amyotrophic lateral sclerosis by spinal transplantation. PLoS One 2012;7:e42614. [DOI] [PMC free article] [PubMed] [Google Scholar]
- 6. Xu L, Ryugo DK, Pongstaporn T, et al. Human neural stem cell grafts in the spinal cord of SOD1 transgenic rats: differentiation and structural integration into the segmental motor circuitry. J Comp Neurol 2009;514:297–309. [DOI] [PMC free article] [PubMed] [Google Scholar]
- 7. Xu L, Shen P, Hazel T, et al. Dual transplantation of human neural stem cells into cervical and lumbar cord ameliorates motor neuron disease in SOD1 transgenic rats. Neurosci Lett 2011;494:222–226. [DOI] [PMC free article] [PubMed] [Google Scholar]
- 8. Xu L, Yan J, Chen D, et al. Human neural stem cell grafts ameliorate motor neuron disease in SOD‐1 transgenic rats. Transplantation 2006;82:865–875. [DOI] [PubMed] [Google Scholar]
- 9. Yan J, Xu L, Welsh AM, et al. Extensive neuronal differentiation of human neural stem cell grafts in adult rat spinal cord. PLoS Med 2007;4:e39. [DOI] [PMC free article] [PubMed] [Google Scholar]
- 10. Raore B, Federici T, Taub J, et al. Cervical multilevel intraspinal stem cell therapy: assessment of surgical risks in Gottingen minipigs. Spine (Phila Pa 1976) 2011;36:E164–E171. [DOI] [PubMed] [Google Scholar]
- 11. Usvald D, Vodicka P, Hlucilova J, et al. Analysis of dosing regimen and reproducibility of intraspinal grafting of human spinal stem cells in immunosuppressed minipigs. Cell Transplant 2010;19:1103–1122. [DOI] [PubMed] [Google Scholar]
- 12. Feldman EL, Boulis NM, Hur J, et al. Intraspinal neural stem cell transplantation in amyotrophic lateral sclerosis: phase 1 trial outcomes. Ann Neurol 2014;75:363–373. [DOI] [PMC free article] [PubMed] [Google Scholar]
- 13. Glass JD, Boulis NM, Johe K, et al. Lumbar intraspinal injection of neural stem cells in patients with amyotrophic lateral sclerosis: results of a phase I trial in 12 patients. Stem Cells 2012;30:1144–1151. [DOI] [PubMed] [Google Scholar]
- 14. Riley J, Glass J, Feldman EL, et al. Intraspinal stem cell transplantation in amyotrophic lateral sclerosis: a phase I trial, cervical microinjection, and final surgical safety outcomes. Neurosurgery 2014;74:77–87. [DOI] [PubMed] [Google Scholar]
- 15. Riley J, Federici T, Polak M, et al. Intraspinal stem cell transplantation in amyotrophic lateral sclerosis: a phase I safety trial, technical note, and lumbar safety outcomes. Neurosurgery 2012;71:405–416; discussion 16. [DOI] [PubMed] [Google Scholar]
- 16. Glass JD, Hertzberg VS, Boulis NM, et al. Transplantation of spinal cord‐derived neural stem cells for ALS: analysis of phase 1 and 2 trials. Neurology 2016;87:392–400. [DOI] [PMC free article] [PubMed] [Google Scholar]
- 17. Guo X, Johe K, Molnar P, et al. Characterization of a human fetal spinal cord stem cell line, NSI‐566RSC, and its induction to functional motoneurons. J Tissue Eng Regen Med 2010;4:181–193. [DOI] [PMC free article] [PubMed] [Google Scholar]
- 18. Atassi N, Berry J, Shui A, et al. The PRO‐ACT database: design, initial analyses, and predictive features. Neurology 2014;83:1719–1725. [DOI] [PMC free article] [PubMed] [Google Scholar]
- 19. Sims‐Robinson C, Bakeman A, Bruno E, et al. Dietary reversal ameliorates short‐ and long‐term memory deficits induced by high‐fat diet early in life. PLoS One 2016;11:e0163883. [DOI] [PMC free article] [PubMed] [Google Scholar]
- 20. Cudkowicz ME, Titus S, Kearney M, et al. Safety and efficacy of ceftriaxone for amyotrophic lateral sclerosis: a multi‐stage, randomised, double‐blind, placebo‐controlled trial. Lancet Neurol 2014;13:1083–1091. [DOI] [PMC free article] [PubMed] [Google Scholar]
- 21. Atassi N. Personal communication regarding current PRO‐ACT dataset information. 2017.
- 22. Berry JD, Miller R, Moore DH, et al. The Combined Assessment of Function and Survival (CAFS): a new endpoint for ALS clinical trials. Amyotroph Lateral Scler Frontotemporal Degener 2013;14:162–168. [DOI] [PubMed] [Google Scholar]
- 23. Dyck PJ, Litchy WJ, Daube JR, et al. Individual attributes versus composite scores of nerve conduction abnormality: sensitivity, reproducibility, and concordance with impairment. Muscle Nerve 2003;27:202–210. [DOI] [PubMed] [Google Scholar]
- 24. Dyck PJ, Davies JL, Litchy WJ, O'Brien PC. Longitudinal assessment of diabetic polyneuropathy using a composite score in the Rochester Diabetic Neuropathy Study cohort. Neurology 1997;49:229–239. [DOI] [PubMed] [Google Scholar]
- 25. Friedman LM, Furberg CD, DeMets DL. Fundamentals of clinical trials. 4th ed New York: Springer, 2010. [Google Scholar]
Associated Data
This section collects any data citations, data availability statements, or supplementary materials included in this article.
Supplementary Materials
Table S1. Most frequent adverse events and serious adverse events by MedDRA category and MedDRA term – Phase 2 study (in long‐term follow‐up).
Table S2. Summary of Phase 1 and 2 subject deaths.