

Abstract
Little is known about the value of the nutritional risk screening 2002 (NRS2002) scale in nasopharyngeal carcinoma (NPC). We conducted a large‐scale study to address this issue. We employed a big‐data intelligence database platform at our center and identified 3232 eligible patients treated between 2009 and 2013. Of the 3232 (12.9% of 24 986) eligible patients, 469 (14.5%), 13 (0.4%), 953 (29.5%), 1762 (54.5%) and 35 (1.1%) had NRS2002 scores of 1, 2, 3, 4 and 5, respectively. Survival outcomes were comparable between patients with NRS2002 <3 and ≥3 (original scale). However, patients with NRS2002 ≤3 vs >3 (regrouping scale) had significantly different 5‐year disease‐free survival (DFS; 82.7% vs 75.0%, P < .001), overall survival (OS; 88.8% vs 84.1%, P = .001), distant metastasis‐free survival (DMFS; 90.2% vs 85.9%, P = .001) and locoregional relapse‐free survival (LRRFS; 91.6% vs 87.2%, P = .001). Therefore, we proposed a revised NRS2002 scale, and found that it provides a better risk stratification than the original or regrouping scales for predicting DFS (area under the curve [AUC] = 0.530 vs 0.554 vs 0.577; P < .05), OS (AUC = 0.534 vs 0.563 vs 0.582; P < .05), DMFS (AUC = 0.531 vs 0.567 vs 0.590; P < .05) and LRRFS (AUC = 0.529 vs 0.542 vs 0.564; P < .05 except scale A vs B). Our proposed NRS2002 scale represents a simple, clinically useful tool for nutritional risk screening in NPC.
Keywords: intensity‐modulated radiotherapy, nasopharyngeal carcinoma, nutritional risk screening 2002, prognosis, supportive care
1. INTRODUCTION
The nasopharygeal epithelial carcinoma (NPC) has distinct epidemiology and treatment regimens from other head and neck cancers. The age‐standardized incidence of NPC is 20‐50 per 100 000 males in endemic areas such as southern China1, 2 but only 0.5 per 100 000 in predominantly white populations.2 Radical surgery is not an option due to anatomical constraints; radiotherapy is the primary and only curative treatment for non‐metastatic disease, which is highly radiosensitive, while radiotherapy combined with chemotherapy is standard for advanced disease.3, 4, 5, 6, 7
As the oral mucosa is unavoidably included in the radiation target volume, severe oral mucositis frequently disrupts oral function and integrity,8 and can cause severe pain and reduce nutritional intake, resulting in significant weight loss. Weight loss and poor nutritional status are associated with more severe toxicities during chemotherapy9 and radiotherapy10 and a poorer response to infection,11 and adversely affect prognosis in head and neck cancers.11 In addition, numerous studies have demonstrated that poor nutrition or weight loss are associated with poorer survival outcomes in NPC.12, 13, 14, 15 Therefore, nutrition and weight loss are major concerns for both clinicians and patients with NPC. However, previous studies have only assessed a single index (i.e. a prognostic nutritional index or weight), without considering disease or baseline characteristics, and could not adequately identify patients at risk of poor nutrition and weight loss. Thus, a tool that enables early identification of the high‐risk subpopulation for delivery of nutritional interventions needs to be developed urgently.
The nutritional risk screening 2002 (NRS2002) scale, developed by the European Society for Clinical Nutrition and Metabolism (ESPEN),16 has been validated for identifying patients at risk who may benefit from nutritional intervention in various cancers,17, 18 including head and neck cancers.19 However, the NRS2002 has never been applied in NPC. Given the urgent clinical need, we conducted a retrospective study using a large‐scale, big‐data intelligence platform to assess the value of the NRS2002 for identifying individuals at high risk of poor nutrition in NPC among patients treated with intensity‐modulated radiotherapy (IMRT).
2. MATERIALS AND METHODS
2.1. Participants
We employed a big‐data intelligence database, which has been described in detail previously20 (Yiducloud Technology, Beijing, China), at Sun Yat‐sen University Cancer Center to identify eligible patients between 2009 and 2013 (Figure S1). Inclusion criteria were: (i) newly diagnosed non‐disseminated NPC; (ii) World Health Organization (WHO) pathology type II/III; (iii) Karnosfky performance score ≥70; (iv) receiving IMRT; (v) if receiving concurrent chemotherapy, single‐agent cisplatin only; (vi) weekly assessment of weight and biochemical profiles; and (vii) no other malignancies or previous radiotherapy or chemotherapy. This study was approved by the Research Ethics Committee of Sun Yat‐sen University Cancer Center. Informed consent was obtained from all patients before treatment.
2.2. Staging workup
All patients underwent head and neck physical examinations, direct fibre‐optic nasopharyngoscopy, MRI scan of skull to sternoclavicular joint, chest radiography or computed tomography (CT), abdominal sonography and whole‐body bone scans. PET‐CT was performed to evaluate metastasis, if clinically indicated. All patients received routine dental evaluations before radiotherapy.
Local tumor extension (T category) and lymph node metastasis (N category) of patients were re‐staged according to the 8th edition of the International Union against Cancer/American Joint Committee on Cancer (UICC/AJCC) tumor‐node‐metastasis system. Two radiologists (L.Z.L and L.T) employed at our hospital with over 10 years’ experience separately reviewed all imaging data to minimize heterogeneity in restaging; disagreements were resolved by consensus.
2.3. NRS2002 assessment
Nutritional risk during radiotherapy was assessed according to the NRS2002 scale (Table S1), which takes into account severity of disease (mild, moderate and severe) and impaired nutritional status (mild, moderate and severe), with an adjustment for age of ≥70 years. Two doctors (H.P and B.B.C) from the radiation oncology and medical oncology departments independently reviewed patients’ medical history, weekly height and weight, weekly blood and biochemical profiles and food intake to determine the NRS2002 score for each patient. For the sections on “severity of disease” and “age,” patients were scored before radiotherapy according to the individual medical history and age records. For “impaired nutritional status,” patients were scored weekly after the beginning of radiotherapy according to weight, body mass index (BMI) or food intake change. The highest score of each patient was selected for subsequent analysis. A score of ≥3 indicated nutritional impairment. Discrepancies were resolved by consensus or in collaboration with a third expert (J.M) with over 30 years of experience in head and neck cancer.
2.4. Clinical treatment and nutritional intervention
All patients received radical IMRT using the simultaneous integrated boost technique at our center.21, 22 Target volumes were delineated based on MRI or PET/CT. The prescribed dose was 66‐70 Gy at 2.12‐2.27 Gy/fraction to planning target volume (PTV) of nasopharyngeal gross tumor volume (GTVnx), 64‐70 Gy to PTV of GTV of metastatic lymph nodes (GTVnd), 60‐63 Gy to PTV of high‐risk clinical target volume (CTV1) and 50‐56 Gy to PTV of low‐risk clinical target volume (CTV2). Radiotherapy alone was usually recommended for patients with stage I disease, concurrent chemoradiotherapy (CCRT) for stage II, and CCRT with or without induction chemotherapy (IC) for stage III‐IVB. IC consisted of cisplatin‐based regimens including docetaxel with cisplatin (TP), fluorouracil with cisplatin (PF), or docetaxel plus cisplatin with fluorouracil (TPF) every 3 weeks for 2‐4 cycles. Concurrent chemotherapy was tri‐weekly or weekly cisplatin.
A nutritional intervention plan was not routinely scheduled before treatment for any patient. Nutritional interventions were delivered if malnutrition occurred according to the guidelines of our center. For patients with poor appetite but normal swallowing function, enteral nutrition, such as ENSURE (Nestle, Switzerland, Vevey), was recommended. For patients with severe oral pain who could not swallow, parenteral nutrition was delivered for 3 consecutive days. Nasogastric feeding was not possible, as the patients could not accept a nasogastric tube.
2.5. Follow‐up and endpoints
Follow‐up duration was measured from day of diagnosis to last visit or death. Conventional follow‐up included head and neck MRI, plasma Epstein‐Barr virus DNA, abdominal sonography, chest radiography or CT, whole bone scan, and PET/CT if necessary, at least every 3‐6 months during the first 2 years, then every 6‐12 months thereafter (or until death). Endpoints included disease‐free survival (DFS, time from diagnosis to treatment failure or death), overall survival (OS, to death from any cause), distant metastasis‐free survival (DMFS, to distant metastasis) and locoregional relapse‐free survival (LRRFS, to local or regional recurrence, or both).
2.6. Statistical methods
The χ2‐test or Fisher's exact test were used to compare categorical variables and a non‐parametric test was used for continuous variables. Multivariate logistic regression analysis was used to identify factors associated with NRS2002 score. Propensity score matching (PSM)23 was performed via logistic regression for each patient to balance various factors between different NRS2002 score groups. The caliper was set at 0.01 to achieve satisfactory matching. Life‐table estimation was performed using the Kaplan–Meier method to compare survival outcomes, and differences were evaluated using the log‐rank test. A multivariate Cox proportional hazards model was used to estimate hazard ratios (HR), 95% confidence intervals (CI) and independent prognostic factors: age, gender, smoking, drinking, family history of cancer, lactate dehydrogenase (LDH), T category, N category, overall stage, IC, cumulative cisplatin dose (CCD) and NRS2002 score. Receiver operating characteristics (ROC) curve analysis was adopted to compare the predictive power of different scales for clinical endpoints, and the difference was compared by Z‐test. Statistical analysis was performed with the Statistical Package for the Social Science, version 20.0 (SPSS, Chicago, IL, USA) and MedCalc (MedCalc Software, Ostend, Belgium). Two‐sided P < .05 indicated a statistically significant difference.
3. RESULTS
3.1. Patient selection
Searches of the big‐data platform using the keyword “nasopharyngeal carcinoma” identified 24 986 patients treated between 2009 and 2013. After reviewing the medical records thoroughly, 3232 (12.9%) patients were eligible for this study (Figure S2), with a median age of 45 years (3‐79 years) and male‐to‐female ratio of 2.98. In total, 469 (14.5%), 13 (0.4%), 953 (29.5%), 1762 (54.5%) and 35 (1.1%) patients had NRS2002 scores of 1, 2, 3, 4 and 5, respectively. The associations between NRS2002 score and severity of disease, impaired nutritional status and age are presented in Table S2. Obviously, most patients (2750/3232; 85.1%) suffered nutritional impairment; therefore, patients were subdivided into low‐risk (NRS2002 < 3, n = 482) and high‐risk (NRS ≥ 3, n = 2750) groups using established NRS2002 score cut‐off values. The baseline characteristics of these groups are compared in Table 1. The high‐risk group had significantly more patients with advanced T category (P < .001), N category (P < .001) and overall stage (P < .001). Consequently, the high‐risk group were more likely to receive more intensive treatment such as IC (P < .001) or concurrent cisplatin (P < .001). All other factors were well‐balanced between the low‐risk and high‐risk groups.
Table 1.
Baseline characteristics between low‐risk and high‐risk groups among the 3232 patients
| Characteristics | Low‐risk (NRS2002 < 3) N = 482 | High‐risk (NRS2002 ≥ 3) N = 2750 | P‐value |
|---|---|---|---|
| Number (%) | Number (%) | ||
| Median age (y, range) | 44 (7‐79) | 45 (3‐78) | .235a |
| Gender | |||
| Male | 375 (77.8) | 2046 (74.4) | .112b |
| Female | 107 (22.2) | 704 (25.6) | |
| Smoking | |||
| Yes | 165 (34.2) | 968 (35.2) | .84b |
| No | 317 (65.8) | 1781 (64.8) | |
| Drinking | |||
| Yes | 82 (17.0) | 383 (13.9) | .075b |
| No | 400 (83.0) | 2367 (86.1) | |
| Family history of cancer | |||
| Yes | 147 (30.5) | 733 (26.7) | .08b |
| No | 335 (69.5) | 2017 (73.3) | |
| LDH (U/L) | 170 (84‐1721) | 173 (39‐753) | .694a |
| Induction chemotherapy | |||
| Yes | 194 (40.2) | 1460 (53.1) | <.001b |
| No | 288 (59.8) | 1290 (46.9) | |
| Median CCD (mg/m2, range) | 100 (0‐300) | 160 (0‐300) | <.001a |
| T categoryc | |||
| T1 | 110 (22.8) | 332 (12.0) | <.001b |
| T2 | 100 (20.7) | 475 (17.3) | |
| T3 | 199 (41.3) | 1374 (50.0) | |
| T4 | 73 (15.2) | 569 (20.7) | |
| N categoryc | |||
| N0 | 135 (28.0) | 318 (11.6) | <.001b |
| N1 | 241 (50.0) | 1424 (51.8) | |
| N2 | 85 (17.6) | 698 (25.4) | |
| N3 | 21 (4.4) | 310 (11.2) | |
| Overall stagec | |||
| I | 56 (11.6) | 90 (3.3) | <.001b |
| II | 132 (27.4) | 436 (15.9) | |
| III | 205 (42.5) | 1401 (50.9) | |
| IVA‐B | 89 (18.5) | 823 (29.9) | |
| BMI (kg/m2) | |||
| Underweight (<18.5) | 37 (7.7) | 207 (7.5) | .751 |
| Normal weight (18.5‐22.99) | 199 (41.3) | 1196 (43.5) | |
| Overweight (23.0‐27.49) | 207 (42.9) | 1112 (40.4) | |
| Obese (≥27.5) | 39 (8.1) | 235 (8.6) | |
| Albumin (g/L) | |||
| <45.4 | 230 (47.7) | 1378 (50.1) | .333 |
| ≥45.4 | 252 (52.3) | 1372 (49.9) | |
| Hemoglobin (g/L) | |||
| <144 | 235 (48.8) | 1364 (49.6) | .732 |
| ≥144 | 247 (51.2) | 1386 (50.4) | |
| High blood pressure | |||
| Yes | 40 (8.3) | 262 (9.5) | .393 |
| No | 442 (91.7) | 2488 (90.5) | |
| Chronic hepatitis B virus | |||
| Yes | 49 (10.2) | 331 (12.0) | .240 |
| No | 433 (89.8) | 2419 (88.0) | |
| Diabetes | |||
| Yes | 15 (3.1) | 109 (4.0) | .369 |
| No | 467 (96.9) | 2641 (96.0) | |
| Cardiovascular disease | |||
| Yes | 10 (2.1) | 58 (2.1) | .961 |
| No | 472 (97.9) | 2692 (97.9) | |
BMI, body mass index; CCD, cumulative cisplatin dose during radiotherapy; LDH, lactate dehydrogenase; NRS, nutritional risk screening.
P‐values were calculated by non‐parametric test.
P‐values were calculated by χ2‐test.
According to the 7th edition of International Union against Cancer/American Joint Committee on Cancer tumor‐node‐metastasis staging system.
3.2. Factors associated with NRS2002 score
Multivariate logistic regression was used to identify factors associated with NRS2002 score in NPC (Table 2). N category (P < .05 for all) and overall stage (P < .05 for all) were strongly associated with NRS2002 score, with more advanced stage related to a higher NRS2002 score. IC (OR, 1.239; 95% CI, 1.084‐1.559; P = .048) and higher CCD during radiotherapy (OR, 1.003; 95% CI, 1.002‐1.004; P < .001) were also associated with a higher NRS2002 score, indicating that IC may contribute to impaired nutritional status. Intriguingly, alcohol consumption (OR, 1.417; 95% CI, 1.080‐1.858; P = .012) was also correlated with impaired nutritional status.
Table 2.
Results of multivariate logistic regression in identifying the factors associated with NRS2002 score
| NRS2002 score | Variable | B | P‐valuea | OR (95% CI) |
|---|---|---|---|---|
| <3 or ≥3 | Drinking: yes vs no | 0.348 | .012 | 1.417 (1.080‐1.858) |
| N category: N1 vs N0 | 0.608 | <.001 | 1.836 (1.359‐2.482) | |
| N category: N2 vs N0 | 0.742 | <.001 | 2.101 (1.458‐3.027) | |
| N category: N3 vs N0 | 1.237 | <.001 | 3.444 (1.949‐6.085) | |
| Overall stage: II vs I | −0.008 | .973 | 0.992 (0.627‐1.570) | |
| Overall stage: III vs I | 0.499 | .032 | 1.647 (1.043‐2.601) | |
| Overall stage: IV vs I | 0.544 | .038 | 1.723 (1.029‐2.883) | |
| Induction chemotherapy: yes vs no | 0.214 | .048 | 1.239 (1.084‐1.559) | |
| CCD (continuous variable) | 0.003 | <.001 | 1.003 (1.002‐1.004) |
CCD, cumulative cisplatin dose during radiotherapy; CI, confidence interval; NRS, nutritional risk screening; OR, odds ratio.
P‐values were calculated by binary logistic regression with backward elimination and the following variables: gender (male vs female), family history of cancer (yes vs no), smoking (yes vs no), drinking (yes vs no), T category (T2 vs T1; T3 vs T1; T4 vs T1), N category (N1 vs N0; N2 vs N0; N3 vs N0), overall stage (II vs I; III vs I; IV vs I), induction chemotherapy (yes vs no) and cumulative cisplatin dose (continuous variable, per‐mg/m2 increase).
3.3. Survival differences for patients with NRS2002 score <3 or ≥3
In total, 476 pairs were selected by PSM and the baseline information is summarized in Table S3. By last visit, the median follow‐up duration for the 476 matched pairs was 59.53 (8.03‐84.43) months. The estimated 5‐year DFS, OS, DMFS) and LRRFS rates for the matched low‐risk and high‐risk groups were 85.3% vs 82.5% (P = .274), 91.4% vs 89.0% (P = .221), 91.8% vs 89.0% (P = .123) and 93.3% vs 91.5% (P = .344, Figure 1), respectively. When entered into multivariate analysis, the NRS2002 score was an independent prognostic factor only for DMFS (HR, 1.673; 95% CI, 1.092‐2.562; P = .018), but not DFS, OS or LRRFS (Table 3).
Figure 1.
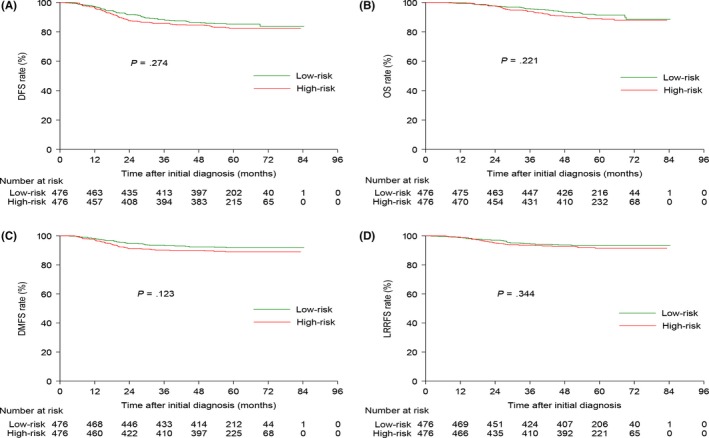
Kaplan–Meier DFS (A), OS (B), DMFS (C) and LRRFS (D) curves for the 476 pairs of patients stratified as low risk (NRS2002 <3) and high risk (NRS2002 ≥ 3) using the NRS2002 scale. DFS, disease‐free survival; DMFS, distant metastasis‐free survival; LRRFS, locoregional relapse‐free survival; NRS, nutritional risk screening; OS, overall survival
Table 3.
Results of multivariate analysis for the selected 476 pairs
| Endpoints | Variable | HR (95% CI) | P a |
|---|---|---|---|
| DFS | LDH | 1.861 (1.089‐3.182) | .023 |
| N category | 2.719 (1.877‐3.939) | <.001 | |
| Overall stage | 1.541 (1.013‐2.344) | .043 | |
| NRS2002 score | 1.373 (0.993‐1.900) | .056 | |
| OS | Age | 1.605 (1.065‐2.419) | .024 |
| Gender | 0.386 (0.187‐0.799) | .01 | |
| LDH | 2.456 (1.363‐4.427) | .003 | |
| N category | 2.390 (1.514‐3.773) | <.001 | |
| Overall stage | 2.112 (1.195‐3.733) | .01 | |
| NRS2002 score | 1.473 (0.973‐2.230) | .067 | |
| DMFS | Gender | 0.393 (0.190‐0.813) | .012 |
| LDH | 2.653 (1.442‐4.881) | .002 | |
| N category | 4.512 (2.953‐6.896) | <.001 | |
| NRS2002 score | 1.673 (1.092‐2.562) | .018 | |
| LRRFS | N category | 2.081 (1.245‐3.476) | .005 |
| NRS2002 score | 1.428 (0.883‐2.310) | .147 |
CI, confidence interval; DFS, disease‐free survival; DMFS, distant metastasis‐free survival; HR, hazard ratio; LRRFS, locoregional relapse‐free survival; NRS, nutritional risk screening; OS, overall survival LDH, lactate dehydrogenase.
P‐values were calculated using an adjusted Cox proportional‐hazards model with backward elimination and the following parameters: age (>45 y vs ≤45 y), gender (female vs male), smoking (yes vs no), drinking (yes vs no), family history of cancer (yes vs no), LDH (>245 vs ≤245 U/L), T category (T3‐4 vs T1‐2), N category (N2‐3 or N0‐1), overall stage (III‐IV vs I‐II), induction chemotherapy (yes vs no), cumulative cisplatin dose (≥200 vs <200 mg/m2) and NRS2002 score (≥3 vs <3).
3.4. Survival analysis after regrouping
We conducted univariate survival analysis between different NRS2002 score groups (Figure 2). Surprisingly, patients with an NRS2002 score of 3 achieved significantly better DFS, OS and DMFS than those with NRS2002 scores of 4 and 5, and similar outcomes to patients with NRS2002 scores of 1 and 2. Therefore, we reclassified patients with NRS2002 scores of 3 as low‐risk (NRS2002 ≤ 3, n = 1436). Subsequently, 1168 pairs were selected from the original cohort; the baseline characteristics of these groups are shown in Table S4.
Figure 2.
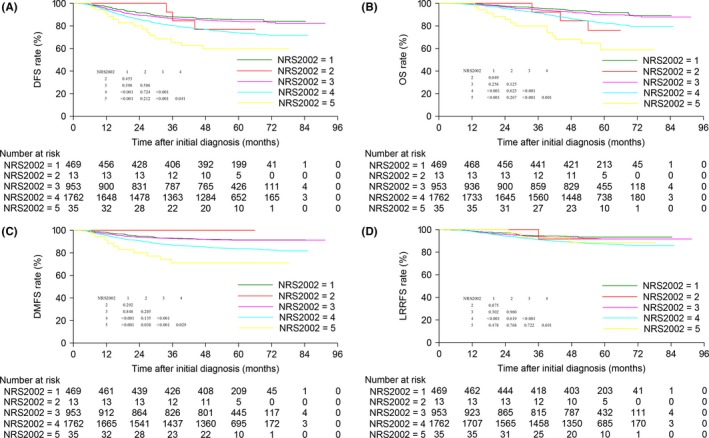
Kaplan–Meier DFS (A), OS (B), DMFS (C) and LRRFS (D) curves for the entire cohort of 3232 patients according to NRS2002 score. DFS, disease‐free survival; DMFS, distant metastasis‐free survival; LRRFS, locoregional relapse‐free survival; NRS, nutritional risk screening; OS, overall survival
In comparison with the high‐risk (NRS2002 > 3) group, patients with NRS2002 scores ≤3 achieved significantly better 5‐year DFS (82.7% vs 75.0%, P < .001), OS (88.8% vs 84.1%, P = .001), DMFS (90.2% vs 85.9%, P = .001) and LRRFS (91.6% vs 87.2%, P = .001; Figure 3). Consistent with the results of univariate analysis, the NRS2002 score was significantly associated with DFS (HR, 1.490; 95% CI, 1.244‐1.785; P < .001), OS (HR, 1.497; 95% CI, 1.195‐1.874; P < .001), DMFS (HR, 1.511; 95% CI, 1.187‐1.923; P = .001) and LRRFS (HR, 1.579; 95% CI, 1.215‐2.054; P = .001; Table S5).
Figure 3.
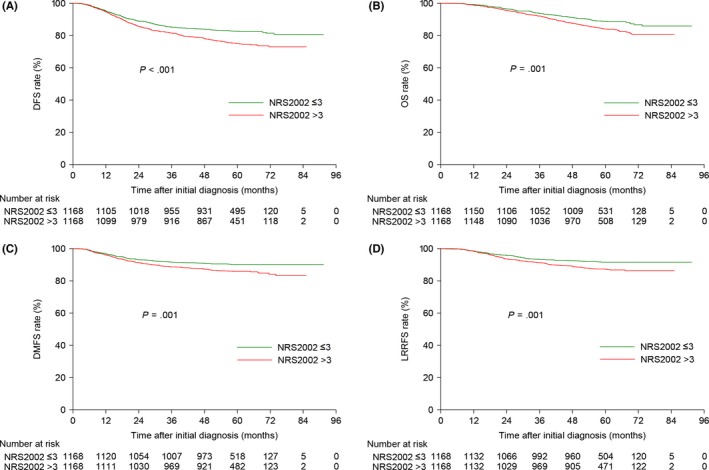
Kaplan–Meier DFS (A), OS (B), DMFS (C) and LRRFS (D) curves for the 1168 pairs of patients stratified as low risk (NRS2002 ≤ 3) and high risk (NRS2002 > 3) using the NRS2002 scale. DFS, disease‐free survival; DMFS, distant metastasis‐free survival; LRRFS, locoregional relapse‐free survival; NRS, nutritional risk screening; OS, overall survival
3.5. Proposal of a revised NRS2002 scale
Previous studies24, 25 focusing on elderly patients applied an age cut‐off value of 65 years. Moreover, Du et al12 found that weight loss of ≥10% was associated with significantly poorer survival outcomes. Therefore, we proposed a revised NRS2002 scale for NPC (Table S6). According to the revised NRS2002 scale, 517 (16.0%), 898 (27.8%), 1504 (46.5%), 307 (9.5%) and 6 (0.2%) patients had scores of 1, 2, 3, 4 and 5, respectively (Table S7). Then, ROC curve analysis was used to compare the risk stratification ability of the 3 scales: scale A, original scale (NRS2002 < 3 or ≥3); scale B, regrouping scale (NRS2002 ≤ 3 or >3); scale C, our revised NRS2002 scale (Figure 4). Obviously, our proposed scale achieved the best power for predicting DFS (area under the curve [AUC] = 0.530 vs 0.554 vs 0.577; all rates P < .05), OS (AUC = 0.534 vs 0.563 vs 0.582; all rates P < .05), DMFS (AUC = 0.531 vs 0.567 vs 0.590; all rates P < .05) and LRRFS (AUC = 0.529 vs 0.542 vs 0.564; all rates P < .05 except scale A vs B).
Figure 4.
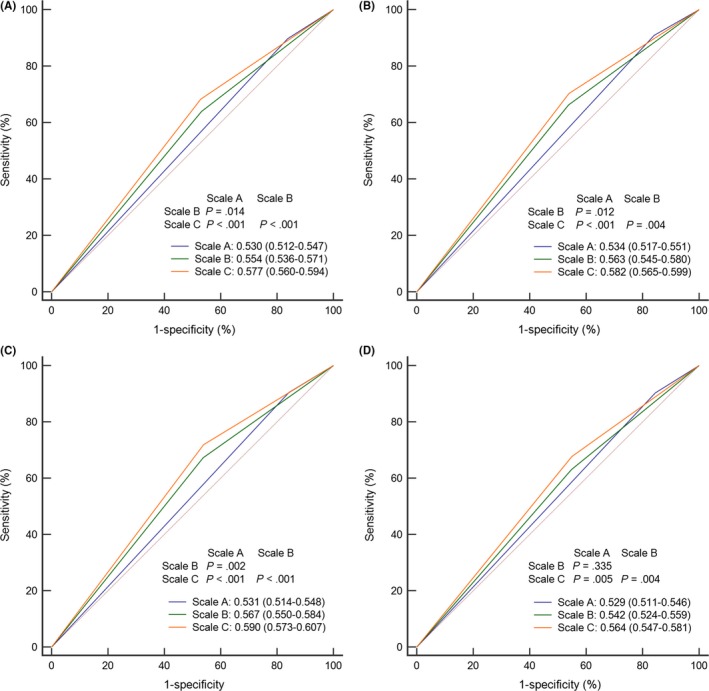
ROC curve analysis comparing risk stratification for the original NRS2002 (scale A), regroup NRS2002 (scale B) and revised NRS2002 (scale C) scales for predicting (A) DFS, (B) OS, (C) DMFS and (D) LRRFS. DFS, disease‐free survival; DMFS, distant metastasis‐free survival; LRRFS, locoregional relapse‐free survival; NRS, nutritional risk screening; OS, overall survival; ROC, receiver operating characteristic
4. DISCUSSION
Our current study verified the prognostic value of the NRS2002 scale in NPC and found the survival outcomes of patients with NRS2002 scores <3 and ≥3 were comparable. Further analysis revealed that patients with NRS2002 scores ≤3 achieved significantly better outcomes than patients with NRS2002 scores >3, indicating the cut‐off values of the conventional NRS2002 scale may not be directly relevant to NPC. Thus, we proposed and validated a revised NRS2002 scale for NPC with more powerful risk stratification ability than the original or regrouping NRS2002 scale. We also identified the factors associated with the NRS2002 score in NPC. To the best of our knowledge, this is the first study to apply the NRS2002 scale to assess nutritional risk for individual patients with NPC.
Before conducting our study, we searched the literature and identified 3 main nutritional risk assessment scales: NRS2002 scale,18, 19, 26, 27 patient‐generated subjective global assessment (PG‐SGA) scale28, 29, 30, 31 and mini nutritional assessment (MNA) scale.32, 33, 34 These 3 scales were proven effective for nutritional assessment for patients with malignancies. However, some items in the PG‐SGA and MNA scales were not routinely assessed and recorded before or during treatment in our center. Consequently, nutritional assessment using these 2 scales was not available. Therefore, we adopted the NRS2002 scale.
It should be noted that we did not consider NRS2002 during IC, as compliance to IC is satisfactory and few patients suffer nutritional impairment during this process. In fact, only 92/1654 (5.6%) patients who received IC experienced nutritional impairment (Table S8). Moreover, patients usually returned home after receiving IC, making it more difficult to assess nutritional status. Hence, we did not evaluate the NRS2002 score during IC. As age is one of the criteria in the NRS2002 scale, we did not restrict age when recruiting participants; therefore, some patients younger than 18 years old were included. According to the guidelines of our hospital, a disease severity score ≥2 was a strong contraindication for radiotherapy. Therefore, all patients in this study had a disease severity score of 1.
We found advanced tumor stage, IC and a higher CCD during radiotherapy were associated with a significantly higher NRS2002 score, which is similar to previous findings.12 Obviously, patients with advanced stage disease received more intensive chemotherapy regimens and, therefore, were more likely to suffer more severe nutritional impairment. However, insufficient chemotherapy may also adversely affect prognosis. As both low and extreme treatment intensities correlate with poorer survival outcomes, it is important to deliver the optimal treatment intensity to obtain the best prognosis. With regard to IC, more efficacious and less toxic regimens should be considered, such as gemcitabine plus cisplatin.35, 36 In addition, the number of cycles of IC should be optimized; 2 cycles may be sufficient.37 For concurrent chemotherapy, an overdose of cisplatin should be avoided; 200 mg/m2 may be adequate to provide a survival advantage.38
In survival analysis, patients with an NRS2002 score >3 had significantly poorer survival outcomes than those with a NRS2002 score ≤3. The reasons for this finding may be numerous and complicated. First, malnutrition could lead to radiotherapy and chemotherapy interruptions, prolong treatment duration and decrease treatment tolerance, therefore negatively affecting survival.39 Second, poor nutrition status could weaken a variety of defence mechanisms, including cellular and humoral immunity, anatomic barriers and phagocyte function,40, 41, 42 thus increasing the chance of secondary infection and compromising treatment response. Furthermore, inadequate nutrition may represent an indicator of the tumor inflammatory response, which promotes tumor cell proliferation/survival, angiogenesis and metastasis, and alters responses to hormones and chemotherapeutic agents.42, 43
Given that nutrition has a significant impact on prognosis, it is essential to identify patients at high risk of nutritional impairment and to deliver nutritional intervention as early as possible. Based on our finding that patients with an NRS2002 score of 3 achieved excellent outcomes, similar to patients with lower scores, it is reasonable to infer that the original NRS2002 scale may not provide adequate nutritional risk stratification in NPC. Therefore, based on previous studies,12, 24, 25 we made some modifications to the age and weight loss criteria to establish a revised NRS2002 scale. ROC curve analysis revealed that the revised NRS2002 scale achieved the best power in risk stratification than the original NRS2002 and regrouping scales for all end‐points. Thus, the revised NRS2002 scale represents a simple, powerful nutritional risk screening tool for patients with NPC that could help to inform clinical decision‐making.
Compared to previous studies of nutritional status in NPC,12, 13, 14, 15 this is the first application of the NRS2002 scale to consider age and severity of disease as well as nutritional status. The proposed revised NRS2002 scale provides more comprehensive understanding of patient and disease status, and may, therefore, have more significant clinical value than the individual indexes (weight loss or prognostic nutritional index) investigated in previous studies.12, 13, 14, 15 Moreover, this was the largest sample size investigated to date, which confers greater statistical power to detect significant differences. Given the unbalanced distribution of some factors between different NRS2002 score groups, we used the PSM method to match these factors and reduce potential bias. The limitations of this study should also be noted. Importantly, data from a single center was retrospectively assessed. However, we applied PSM and multivariate analysis to balance various factors and address the potential limitations of divergent confounders. Moreover, the effect of IC was not explored in detail and requires further study. The relationship between radiotherapy interruption and NRS2002 score was not evaluated because many patients did not have this data.
In summary, tumor stage and chemotherapy intensity are significantly associated with NRS2002 score in NPC, and patients with a NRS2002 score >3 have significantly poorer survival outcomes than those with a NRS score ≤3 in the IMRT era. Moreover, we proposed and validated a revised NRS2002 scale that better enables identification of patients at high risk of nutritional impairment. The revised NRS2002 scale needs to be validated in randomized clinical trials.
CONFLICT OF INTEREST
The authors have no conflict of interest to declare.
Supporting information
ACKNOWLEDGMENTS
We sincerely thank Dr Wei Liang and Dr Lei Shi (Yidu Cloud Technology, Beijing, China) for providing technical support in extracting study data from their big‐data intelligence database platform. The data supporting the conclusions of our study was deposited at the Research Data Deposit (RDDA2017000377).
Peng H, Chen B‐B, Tang L‐L, et al. Prognostic value of nutritional risk screening 2002 scale in nasopharyngeal carcinoma: A large‐scale cohort study. Cancer Sci. 2018;109:1909‐1919. https://doi.org/10.1111/cas.13603
Funding information
Natural Science Foundation of Guangdong Province (2017A030312003); National Natural Science Foundation of China (81572658); Program of Introducing Talents of Discipline to Universities (B14035); Innovation Team Development Plan of the Ministry of Education (No. IRT_17R110); Health & Medical Collaborative Innovation Project of Guangzhou City, China (201803040003); Overseas Expertise Introduction Project for Discipline Innovation (111 Project, B14035).
REFERENCES
- 1. Zhang LF, Li YH, Xie SH, et al. Incidence trend of nasopharyngeal carcinoma from 1987 to 2011 in Sihui County, Guangdong Province, South China: an age‐period‐cohort analysis. Chin J Cancer. 2015;34:350‐357. [DOI] [PMC free article] [PubMed] [Google Scholar]
- 2. Jemal A, Bray F, Center MM, Ferlay J, Ward E, Forman D. Global cancer statistics. CA Cancer J Clin. 2011;61:69‐90. [DOI] [PubMed] [Google Scholar]
- 3. Al‐Sarraf M, LeBlanc M, Giri PG, et al. Chemoradiotherapy versus radiotherapy in patients with advanced nasopharyngeal cancer: phase III randomized intergroup study 0099. J Clin Oncol. 1998;16:1310‐1317. [DOI] [PubMed] [Google Scholar]
- 4. Chan AT, Leung SF, Ngan RK, et al. Overall survival after concurrent cisplatin‐radiotherapy compared with radiotherapy alone in locoregionally advanced nasopharyngeal carcinoma. J Natl Cancer Inst. 2005;97:536‐539. [DOI] [PubMed] [Google Scholar]
- 5. Chen Y, Sun Y, Liang SB, et al. Progress report of a randomized trial comparing long‐term survival and late toxicity of concurrent chemoradiotherapy with adjuvant chemotherapy versus radiotherapy alone in patients with stage III to IVB nasopharyngeal carcinoma from endemic regions of China. Cancer. 2013;119:2230‐2238. [DOI] [PubMed] [Google Scholar]
- 6. Lee AW, Tung SY, Chua DT, et al. Randomized trial of radiotherapy plus concurrent‐adjuvant chemotherapy vs radiotherapy alone for regionally advanced nasopharyngeal carcinoma. J Natl Cancer Inst. 2010;102:1188‐1198. [DOI] [PubMed] [Google Scholar]
- 7. Wee J, Tan EH, Tai BC, et al. Randomized trial of radiotherapy versus concurrent chemoradiotherapy followed by adjuvant chemotherapy in patients with American Joint Committee on Cancer/International Union against cancer stage III and IV nasopharyngeal cancer of the endemic variety. J Clin Oncol. 2005;23:6730‐6738. [DOI] [PubMed] [Google Scholar]
- 8. Moslemi D, Nokhandani AM, Otaghsaraei MT, Moghadamnia Y, Kazemi S, Moghadamnia AA. Management of chemo/radiation‐induced oral mucositis in patients with head and neck cancer: a review of the current literature. Radiother Oncol. 2016;120:13‐20. [DOI] [PubMed] [Google Scholar]
- 9. Arrieta O, Michel Ortega RM, Villanueva‐Rodriguez G, et al. Association of nutritional status and serum albumin levels with development of toxicity in patients with advanced non‐small cell lung cancer treated with paclitaxel‐cisplatin chemotherapy: a prospective study. BMC Cancer. 2010;10:50. [DOI] [PMC free article] [PubMed] [Google Scholar]
- 10. Meyer F, Fortin A, Wang CS, Liu G, Bairati I. Predictors of severe acute and late toxicities in patients with localized head‐and‐neck cancer treated with radiation therapy. Int J Radiat Oncol Biol Phys. 2012;82:1454‐1462. [DOI] [PubMed] [Google Scholar]
- 11. Capuano G, Grosso A, Gentile PC, et al. Influence of weight loss on outcomes in patients with head and neck cancer undergoing concomitant chemoradiotherapy. Head Neck. 2008;30:503‐508. [DOI] [PubMed] [Google Scholar]
- 12. Du XJ, Tang LL, Mao YP, et al. Value of the prognostic nutritional index and weight loss in predicting metastasis and long‐term mortality in nasopharyngeal carcinoma. J Transl Med. 2015;13:364. [DOI] [PMC free article] [PubMed] [Google Scholar]
- 13. Du XJ, Tang LL, Mao YP, et al. The pretreatment albumin to globulin ratio has predictive value for long‐term mortality in nasopharyngeal carcinoma. PLoS One. 2014;9:e94473. [DOI] [PMC free article] [PubMed] [Google Scholar]
- 14. Miao J, Xiao W, Wang L, et al. The value of the Prognostic Nutritional Index (PNI) in predicting outcomes and guiding the treatment strategy of nasopharyngeal carcinoma (NPC) patients receiving intensity‐modulated radiotherapy (IMRT) with or without chemotherapy. J Cancer Res Clin Oncol. 2017;143:1263‐1273. [DOI] [PMC free article] [PubMed] [Google Scholar]
- 15. Qiu C, Yang N, Tian G, Liu H. Weight loss during radiotherapy for nasopharyngeal carcinoma: a prospective study from northern China. Nutr Cancer. 2011;63:873‐879. [DOI] [PubMed] [Google Scholar]
- 16. Kondrup J, Allison SP, Elia M, et al. ESPEN guidelines for nutrition screening 2002. Clin Nutr. 2003;22:415‐421. [DOI] [PubMed] [Google Scholar]
- 17. Kondrup J, Rasmussen HH, Hamberg O, Stanga Z, Ad Hoc ESP Working Group . Nutritional risk screening (NRS 2002): a new method based on an analysis of controlled clinical trials. Clin Nutr. 2003;22:321‐336. [DOI] [PubMed] [Google Scholar]
- 18. Sun Z, Kong XJ, Jing X, Deng RJ, Tian ZB. Nutritional risk screening 2002 as a predictor of postoperative outcomes in patients undergoing abdominal surgery: a systematic review and meta‐analysis of prospective cohort studies. PLoS One. 2015;10:e0132857. [DOI] [PMC free article] [PubMed] [Google Scholar]
- 19. Orell‐Kotikangas H, Osterlund P, Saarilahti K, Ravasco P, Schwab U, Makitie AA. NRS‐2002 for pre‐treatment nutritional risk screening and nutritional status assessment in head and neck cancer patients. Support Care Cancer. 2015;23:1495‐1502. [DOI] [PubMed] [Google Scholar]
- 20. Lv JW, Chen YP, Huang XD, et al. Hepatitis B virus screening and reactivation and management of patients with nasopharyngeal carcinoma: a large‐scale, big‐data intelligence platform‐based analysis from an endemic area. Cancer. 2017;123:3540‐3549. [DOI] [PubMed] [Google Scholar]
- 21. Peng H, Chen L, Li WF, et al. Prognostic value of neoadjuvant chemotherapy in locoregionally advanced nasopharyngeal carcinoma with low pre‐treatment Epstein‐Barr virus DNA: a propensity‐matched analysis. J Cancer. 2016;7:1465‐1471. [DOI] [PMC free article] [PubMed] [Google Scholar]
- 22. Peng H, Chen L, Zhang J, et al. Induction chemotherapy improved long‐term outcomes of patients with locoregionally advanced nasopharyngeal carcinoma: a propensity matched analysis of 5‐year survival outcomes in the era of intensity‐modulated radiotherapy. J Cancer. 2017;8:371‐377. [DOI] [PMC free article] [PubMed] [Google Scholar]
- 23. Austin PC. The relative ability of different propensity score methods to balance measured covariates between treated and untreated subjects in observational studies. Med Decis Making. 2009;29:661‐677. [DOI] [PubMed] [Google Scholar]
- 24. Liu H, Chen QY, Guo L, et al. Feasibility and efficacy of chemoradiotherapy for elderly patients with locoregionally advanced nasopharyngeal carcinoma: results from a matched cohort analysis. Radiat Oncol. 2013;8:70. [DOI] [PMC free article] [PubMed] [Google Scholar]
- 25. Zhang Y, Yi JL, Huang XD, et al. Inherently poor survival of elderly patients with nasopharyngeal carcinoma. Head Neck. 2015;37:771‐776. [DOI] [PubMed] [Google Scholar]
- 26. Guo W, Ou G, Li X, Huang J, Liu J, Wei H. Screening of the nutritional risk of patients with gastric carcinoma before operation by NRS 2002 and its relationship with postoperative results. J Gastroenterol Hepatol. 2010;25:800‐803. [DOI] [PubMed] [Google Scholar]
- 27. Leandro‐Merhi VA, de Aquino JLB, Reis LO. Predictors of nutritional risk according to NRS‐2002 and calf circumference in hospitalized older adults with neoplasms. Nutr Cancer. 2017;69:1219‐1226. [DOI] [PubMed] [Google Scholar]
- 28. Abbott J, Teleni L, McKavanagh D, Watson J, McCarthy AL, Isenring E. Patient‐generated subjective global assessment short form (PG‐SGA SF) is a valid screening tool in chemotherapy outpatients. Support Care Cancer. 2016;24:3883‐3887. [DOI] [PubMed] [Google Scholar]
- 29. Kim HS, Lee JY, Lim SH, et al. Patient‐generated subjective global assessment as a prognosis tool in patients with multiple myeloma. Nutrition. 2017;36:67‐71. [DOI] [PubMed] [Google Scholar]
- 30. Martin L, Watanabe S, Fainsinger R, et al. Prognostic factors in patients with advanced cancer: use of the patient‐generated subjective global assessment in survival prediction. J Clin Oncol. 2010;28:4376‐4383. [DOI] [PubMed] [Google Scholar]
- 31. Rodrigues CS, Lacerda MS, Chaves GV. Patient Generated Subjective Global Assessment as a prognosis tool in women with gynecologic cancer. Nutrition. 2015;31:1372‐1378. [DOI] [PubMed] [Google Scholar]
- 32. Gioulbasanis I, Georgoulias P, Vlachostergios PJ, et al. Mini Nutritional Assessment (MNA) and biochemical markers of cachexia in metastatic lung cancer patients: interrelations and associations with prognosis. Lung Cancer. 2011;74:516‐520. [DOI] [PubMed] [Google Scholar]
- 33. Hsu WC, Tsai AC, Chan SC, Wang PM, Chung NN. Mini‐nutritional assessment predicts functional status and quality of life of patients with hepatocellular carcinoma in Taiwan. Nutr Cancer. 2012;64:543‐549. [DOI] [PubMed] [Google Scholar]
- 34. Read JA, Crockett N, Volker DH, et al. Nutritional assessment in cancer: comparing the Mini‐Nutritional Assessment (MNA) with the scored Patient‐Generated Subjective Global Assessment (PGSGA). Nutr Cancer. 2005;53:51‐56. [DOI] [PubMed] [Google Scholar]
- 35. Chua ML, Chan AT. Gemcitabine: a game changer in nasopharyngeal carcinoma. Lancet. 2016;388:1853‐1854. [DOI] [PubMed] [Google Scholar]
- 36. Zhang L, Huang Y, Hong S, et al. Gemcitabine plus cisplatin versus fluorouracil plus cisplatin in recurrent or metastatic nasopharyngeal carcinoma: a multicentre, randomised, open‐label, phase 3 trial. Lancet. 2016;388:1883‐1892. [DOI] [PubMed] [Google Scholar]
- 37. Peng H, Chen L, Li WF, et al. Optimize the cycle of neoadjuvant chemotherapy for locoregionally advanced nasopharyngeal carcinoma treated with intensity‐modulated radiotherapy: a propensity score matching analysis. Oral Oncol. 2016;62:78‐84. [DOI] [PubMed] [Google Scholar]
- 38. Peng H, Chen L, Zhang Y, et al. Prognostic value of the cumulative cisplatin dose during concurrent chemoradiotherapy in locoregionally advanced nasopharyngeal carcinoma: a secondary analysis of a prospective phase III clinical trial. Oncologist. 2016;21:1369‐1376. [DOI] [PMC free article] [PubMed] [Google Scholar]
- 39. Lee SW, Back GM, Yi BY, et al. Preliminary results of a phase I/II study of simultaneous modulated accelerated radiotherapy for nondisseminated nasopharyngeal carcinoma. Int J Radiat Oncol Biol Phys. 2006;65:152‐160. [DOI] [PubMed] [Google Scholar]
- 40. Lis CG, Gupta D, Lammersfeld CA, Markman M, Vashi PG. Role of nutritional status in predicting quality of life outcomes in cancer–a systematic review of the epidemiological literature. Nutr J. 2012;11:27. [DOI] [PMC free article] [PubMed] [Google Scholar]
- 41. McMillan DC. Systemic inflammation, nutritional status and survival in patients with cancer. Curr Opin Clin Nutr Metab Care. 2009;12:223‐226. [DOI] [PubMed] [Google Scholar]
- 42. Muliawati Y, Haroen H, Rotty LW. Cancer anorexia – cachexia syndrome. Acta Med Indones. 2012;44:154‐162. [PubMed] [Google Scholar]
- 43. Mantovani A, Allavena P, Sica A, Balkwill F. Cancer‐related inflammation. Nature. 2008;454:436‐444. [DOI] [PubMed] [Google Scholar]
Associated Data
This section collects any data citations, data availability statements, or supplementary materials included in this article.
Supplementary Materials