

Abstract
To identify novel therapeutic targets for non‐small cell lung cancer (NSCLC), we conducted an integrative study in the following 3 stages: (i) identification of potential target gene(s) through shRNA functional screens in 2 independent NSCLC cell lines; (ii) validation of the clinical relevance of identified gene(s) using public databases; and (iii) investigation of therapeutic potential of targeting the identified gene(s) in vitro. A semi‐genome‐wide shRNA screen was performed in NCI‐H358 cells, and was integrated with data from our previous screen in NCI‐H460 cells. Among genes identified in shRNA screens, 24 were present in both NCI‐H358 and NCI‐H460 cells and were considered potential targets. Among the genes, we focused on eIF2β, which is a subunit of heterotrimeric G protein EIF2 and functions as a transcription initiation factor. The eIF2β protein is highly expressed in lung cancer cell lines compared with normal bronchial epithelial cells, and gene copy number analyses revealed that eIF2β is amplified in a subset of NSCLC cell lines. Gene expression analysis using The Cancer Genome Atlas (TCGA) dataset revealed that eIF2β expression is significantly upregulated in lung cancer tissues compared with corresponding normal lung tissues. Furthermore, high eIF2β expression was correlated with poor survival in patients with lung adenocarcinoma, as shown in other cohorts using publicly available online tools. RNAi‐mediated depletion of eIF2β suppresses growth of lung cancer cells independently of p53 mutation status, in part through G1 cell cycle arrest. Our data suggest that eIF2β is a therapeutic target for lung cancer.
Keywords: adenocarcinoma, eukaryotic initiation factor‐2, G1 phase cell cycle checkpoints, heterotrimeric GTP‐binding proteins, RNA interference
1. INTRODUCTION
Lung cancer is one of the most lethal types of cancers, causing mortality of over 1.5 million people worldwide a year.1, 2 Substantial progress in treatment outcomes for this disease has been made in the past decade, primarily reflecting improved efficacy of molecular targeted drugs.3, 4 However, long‐term survival of advanced lung cancer patients remains very rare, warranting the development of novel therapeutics that specifically target lung cancer cells. We recently performed a semi‐genome wide shRNA screen in the non‐small cell lung cancer (NSCLC) cell line NCI‐H460 and identified therapeutic targets using gene expression and copy number data for lung cancer cells from publicly available sources or experiments in our laboratory.5 In these studies, we identified proteasome subunit alpha 6 (PSAM6), which encodes a subunit gene of the 26S proteasome complex. Silencing of PSAM6 induced apoptosis or cell cycle arrest in lung cancer cells but not in immortalized normal human bronchial epithelial cells. In addition, PSAM6 was amplified in a subset of lung cancer cell lines, suggesting potential as a therapeutic target for lung cancer.
In addition to PSMA6, we identified several other genes with potential as targets. To delineate optimal therapeutic targets among these genes, we repeated shRNA screens using the alternative NSCLC cell line NCI‐H358, and identified 24 genes for which silencing caused growth suppression in both cell lines. In particular, eIF2β (also known as EIF2S2) is a subunit of heterotrimeric G protein EIF2, which comprises the 3 subunits eIF2α, eIF2β and eIF2γ.6, 7 In gene ontology analyses that included the well‐studied therapeutic targets for human cancer RAN member RAS oncogene family and exportin 1 (XPO1),8, 11 we showed that eIF2β is an RNA transport molecule and demonstrated its potential as a therapeutic target.
EIF2 regulates the earliest step of translation in a guanosine triphosphate (GTP)‐dependent manner, and binding to GTP but not GDP on the eIF2γ promoter initiates translation by delivering an initiator methionyl‐tRNA to the ribosome. Switching from the GTP‐bound form to the GDP‐bound form is mediated by the guanine nucleotide exchange factor EIF2B, which is a heterodecameric complex. In addition, EIF2B activity is inhibited by phosphorylation of Ser51, leading to global repression of translation and concomitant upregulation of several genes that are involved in stress responses. Oncogenic roles of eIF2α have been extensively studied in several human cancers;6, 12 however, few studies demonstrate the roles of eIF2β in carcinogenesis. For example, in a mouse model of testicular germ cell tumor development, heterozygous deletion of eIF2β reduced the incidence of TGCT.13 In addition, an integrated genomic search of novel therapeutic targets for breast cancer indicated that eIF2β is highly amplified in luminal breast tumors, which are an aggressive subtype of breast tumors.14 These studies warrant consideration of eIF2β as a target for lung cancer. Thus, to evaluate the potential of eIF2β‐targeted therapy, we investigated the roles of eIF2β in lung cancer development. We found high eIF2β expression in NSCLC tumors, and that eIF2β was correlated with poor prognosis in patients with adenocarcinoma. Furthermore, eIF2β RNA interference manipulations induced G1 cell cycle arrest in part by upregulating p21WAF1/CIP1. The present data suggest that eIF2β is a diagnostic and prognostic biomarker for lung cancer and that eIF2β‐targeted therapeutics are promising.
2. MATERIALS AND METHODS
2.1. Cell cultures
Nineteen lung cancer and two Cdk4/hTERT‐immortalized normal human bronchial epithelial cell lines, HBEC3 and HBEC4, and normal human bronchial epithelial (NHBE) culture were purchased from ATCC (Manassas, VA, USA) or were derived from the Hamon Center collection (University of Texas Southwestern Medical Center, Dallas, TX, USA).15 HBEC3 cells stably expressing oncogenic KRAS V12 were generated as described previously.16 NCI‐H460 and NCI‐H1975 (hereafter designated as H460 and H1975, respectively) cells were used in functional analyses. Lung cancer cell lines were cultured in RPMI‐1640 (Sigma‐Aldrich, St. Louis, MO, USA) supplemented with 10% FCS, and NHBE, HBEC3 and HBEC4 cells were cultured in KSFM (Life Technologies, Gaithersburg, MD, USA) supplemented with 50 ng/mL bovine pituitary extract and 5 ng/mL epidermal growth factor. 293FT cells were cultured in DMEM (Thermo Fisher Scientific, Waltham, MA, USA) supplemented with 10% FCS. The mutation status of epidermal growth factor receptor (EGFR), KRAS and BRAF for cell lines used is described in Table S1.
2.2. Pooled shRNA screen
A pooled shRNA screen was performed in H358 cells using the DECIPHER library human Module 1 (#DHPAC‐M1‐P; Cellecta) targeting 5043 genes, and the results were used to generate a volcano plot.5
2.3. DNA copy number analysis
Whole‐genome single nucleotide polymorphism array profiling was performed with 69 NSCLC cell lines and normal human bronchial epithelial cells using the Illumina Human1M‐Duo DNA Analysis BeadChip (Illumina). Data were processed using Illumina BeadStudio as described previously.5 Final copy number variations were interpreted qualitatively as deleted, unchanged or amplified.
2.4. Transfection of siRNA
A total of 5 × 10⁵ of cells were plated in 10‐cm plates and were cultured for 24 hours. They were then transiently transfected with 10‐nmol/L predesigned siRNA (MISSION siRNA, Sigma‐Aldrich) targeting eIF2β or control siRNA (Sigma‐Aldrich) using Lipofectamine RNAiMAX (Invitrogen, Carlsbad, CA, USA) according to the manufacturer's protocol. After 48 hours, transfected cells were harvested for further analyses or were replated for cell growth assays.
2.5. Viral vectors and viral transduction
Vectors expressing shRNA specific to eIF2β (TRCN0000307920 and TRCN 0000074792) (Sigma‐Aldrich, St. Louis, MO, USA) or GFP were lentivirally transduced in H460 as described previously.17
2.6. Cell growth assays
Colorimetric proliferation assays were performed using WST‐1 Assay Kits (Roche, Basel, Switzerland) according to the manufacturer's instructions.
2.7. Western blot analysis
Western blot analyses were performed using whole cell lysates as described previously.17 Primary antibodies included rabbit polyclonal anti‐actin (Sigma‐Aldrich), rabbit monoclonal anti‐eIF2β, rabbit monoclonal anti‐cleaved poly (ADP‐ribose) polymerase (PARP), rabbit monoclonal anti‐p21WAF1/CIP1 (Cell Signaling Technology, Boston, MA, USA), rabbit polyclonal anti‐ATF4 (Proteintech, Rosemont, IL, USA) and rabbit polyclonal anti‐eIF2α (Cell Signaling Technology). Actin protein levels were used as a protein loading control. Anti‐rabbit or anti‐mouse secondary antibodies (GE Healthcare, Tokyo, Japan) were used at a dilution of 1:2000. The signal levels of eIF2β and actin were measured by Image J (https://imagej.nih.gov/ij/download.html).
2.8. Cell cycle analysis
Cells were harvested at 48 hours after transfection with siRNA and were then washed in ice‐cold PBS. Following centrifugation at 300 g for 3 minutes, cells were suspended in 300 μL of cold PBS with gentle vortexing before fixing by drop‐wise addition of 700 μL of ice‐cold ethanol. Fixed cells were then stored at 4°C for at least 2 hour. Pelleted cells were washed twice in cold PBS, re‐suspended in 1 mL of PBS containing 200 μg/mL RNase and then stained with 20 μg propidium iodide. Cells were then incubated at 37°C for 30 minutes and were maintained at 4°C until analysis. Cells were finally filtered through a 40‐μm nylon mesh and were analyzed using a flow FACS Gallios Flow Cytometer (Beckman Coulter, Brea, CA, USA).
2.9. Statistical analysis
All statistical analyses of in vitro data were conducted using IBM SPSS version 23 software (International Business Machines, Armonk, New York, USA) and differences between groups were identified using Mann‐Whitney U tests.
Categorical data were compared using Fisher's exact or χ2‐tests. Continuous variables were compared using Mann–Whitney U tests or paired t tests. Pearson's correlations were used to assess linear associations between variables. Survival data were analyzed using likelihood ratio tests in multivariate analyses. Statistical analyses were performed using JMP (version 13) and GraphPad Prism software (Version 7.0) and differences and correlations were considered significant when P < .05.
Kaplan–Meier survival curves were generated from 474 lung adenocarcinoma samples and available survival data from TCGA (http://cancergenome.nih.gov/). Differences in survival were identified using the log‐rank test and overall survival was defined as the time from the initial pathological diagnosis (the TCGA dataset) to the date of death or last follow‐up, at which point the data were censored. Cox proportional hazards model analyses were performed to adjust for significant covariates in univariate analysis, which included sex, age, smoking status, stage and eIF2β expression, and to estimate relative hazards of mortality over the follow‐up period. Finally, mRNA expression levels of eIF2β in the TCGA dataset were dichotomized.
3. RESULTS
3.1. Overlapping genes in 2 dropout viability screens of 2 non‐small cell lung cancer cell lines were identified as potential targets for lung cancer
Previously, we identified candidate genes that have potential as targets for lung cancer using dropout viability screens with an shRNA library and the highly proliferative lung cancer cell line NIC‐H460.5 To select genes that have more generalized potential as therapeutic targets, we initially repeated shRNA screens using the alternative NSCLC cell line H358. We selected this cell line because it differs in the status of p53 from H460; H460 has wild‐type p53 while H358 is null for p53.18 We expected that screens using 2 lung cancer cell lines with or without p53 would enable us to identify therapeutic targets that are not strongly associated with p53 status. H358 cells were lentivirally transduced with the DECIPHER library human Module 1 and abundances of individual shRNA constructs for each gene were quantified by sequencing corresponding barcode sequences using next‐generation sequencing as described previously.5 Using a volcano plot (Figure 1A) we then selected 37 genes as potential candidates based on significant average suppressive effects (P < .05) below a log2 of −1.5. In our previous study, we arbitrarily employed a cutoff for fold changes of log2 of −2.0, and identified 51 of 5043 genes (1.0%) as targets. Herein, we selected overlapping genes from 2 independent screens to limit the number of targets and used a less stringent fold‐change criteria of log2 = −1.5 for both H460 and H358. These analyses revealed 24 genes that were present in both screens with H460 and H358 (Figure 1B and Table 1). Gene ontology and KEGG pathways for these 24 genes were then performed using the web‐based online pathway tool NIH‐DAVID (Table1).19, 20 Among KEGG pathways for the 24 genes, the RNA transport pathway was attractive as a therapeutic target because it included XPO1 and RAN, which are well characterized therapeutic targets for human cancers, including lung cancer.8, 11 Our screening studies identified eIF2β as an additional gene of the RNA transport pathway. This gene encodes the β‐subunit of EIF2, which is a heterotrimeric G protein comprising α‐, β‐ and γ‐subunits, and functions as a translation initiator factor.
Figure 1.
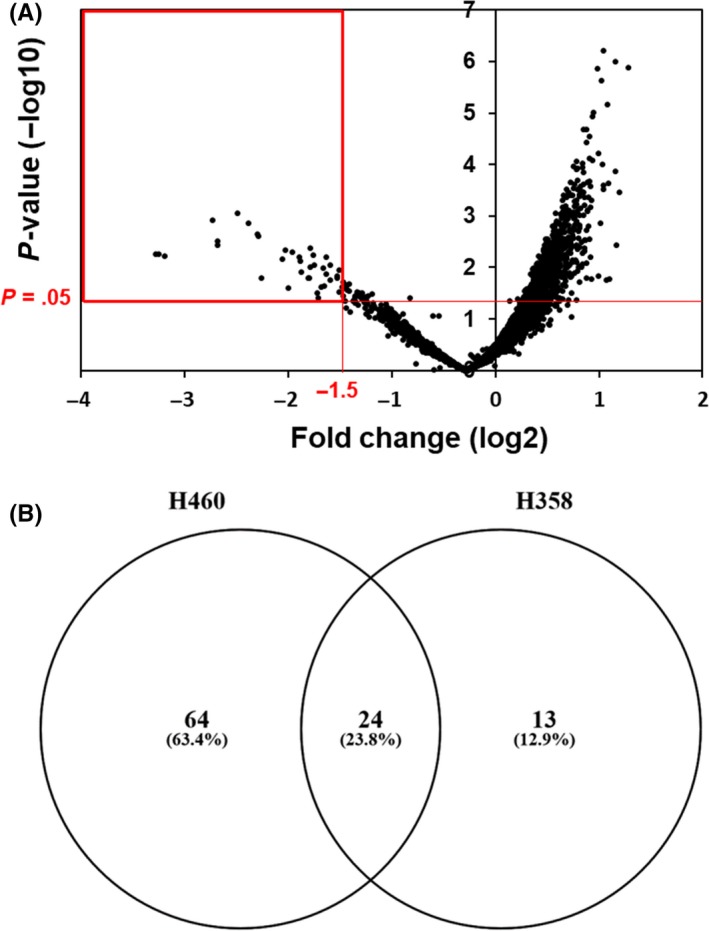
Semi‐genome‐wide screening with a pooled shRNA library identified genes that are essential for proliferation and/or survival of the NCI‐H358 lung cancer cells. A, Screening results are presented as a volcano plot with 5043 genes ranked by fold change and significance. Thirty‐seven genes are selected as potential candidates based on significant average suppressive effects (P < .05) below a log2 of −1.5 (red rectangle). B, The Venn diagram shows 3 categories of genes that were identified as targets only in H460, only in H358, and in both H460 and H358 cells
Table 1.
List of 24 overlapping genes between H460 and H358
| Gene | Description | KEGG pathway |
|---|---|---|
| eIF2β (EIF2S2) | Eukaryotic translation initiation factor 2 subunit beta | RNA transport |
| RAN | RAN, member RAS oncogene family | RNA transport, ribosome biogenesis in eukaryotes, HTLV‐I infection, Epstein‐Barr virus infection |
| XPO1 | Exportin 1 | RNA transport, ribosome biogenesis in eukaryotes, HTLV‐I infection, Epstein‐Barr virus infection, influenza A |
| RPL6 | Ribosomal protein L6 | Ribosome |
| RPL10 | Ribosomal protein L10 | Ribosome |
| RPL14 | Ribosomal protein L14 | Ribosome |
| RPS13 | Ribosomal protein S13 | Ribosome |
| RPSA | Ribosomal protein SA | Ribosome |
| PSMA2 | Proteasome subunit alpha 2 | Proteasome |
| PSMA3 | Proteasome subunit alpha 3 | Proteasome |
| PSMD2 | Proteasome 26S subunit, non‐ATPase 2 | Proteasome, Epstein‐Barr virus infection |
| PSMD6 | Proteasome 26S subunit, non‐ATPase 6 | Proteasome, Epstein‐Barr virus infection |
| EFTUD2 | Elongation factor Tu GTP binding domain containing 2 | Spliceosome |
| HNRNPC | Heterogeneous nuclear ribonucleoprotein C (C1/C2) | Spliceosome |
| PRPF40A | Pre‐mRNA processing factor 40 homolog A | Spliceosome |
| SNRNP200 | Small nuclear ribonucleoprotein U5 subunit 200 | Spliceosome |
| TUBA1C | Tubulin alpha 1c | Phagosome, gap junction, pathogenic Escherichia coli infection |
| PAFAH1B1 | Platelet activating factor acetylhydrolase 1b regulatory subunit 1 | Metabolic pathways, ether lipid metabolism |
| RRM1 | Ribonucleotide reductase catalytic subunit M1 | Metabolic pathways, purine metabolism, pyrimidine metabolism, glutathione metabolism |
| POLR2B | RNA polymerase II subunit B | Metabolic pathways, purine metabolism, pyrimidine metabolism, RNA polymerase, Huntington's disease, Epstein‐Barr virus infection |
| POLR2D | RNA polymerase II subunit D | Metabolic pathways, purine metabolism, pyrimidine metabolism, RNA polymerase, Huntington's disease, Epstein‐Barr virus infection |
| POLR2F | RNA polymerase II subunit F | Metabolic pathways, purine metabolism, pyrimidine metabolism, RNA polymerase, cytosolic DNA‐sensing pathway, Huntington's disease, Epstein‐Barr virus infection |
| RBX1 | Ring‐box 1 | Nucleotide excision repair, HIF‐1 signaling pathway, cell cycle, oocyte meiosis, ubiquitin mediated proteolysis, protein processing in endoplasmic reticulum, Wnt signaling pathway, TGF‐beta signaling pathway, circadian rhythm, pathways in cancer, renal cell carcinoma |
| CSE1L | Chromosome segregation 1 like | N/A |
3.2. The eIF2β gene is highly expressed in lung cancers and is correlated with poor prognosis of patients with lung adenocarcinoma
We evaluated protein expression levels of eIF2β in a panel of lung cancer cell lines and in 3 cdk4/hTERT‐immortalized human bronchial epithelial cell lines with or without the oncogene KRAS V12, and compared these with primary NHBE (Figure 2A). The eIF2β protein was more abundantly expressed in all lung cancer cell lines than in NHBE cells. Thus, to determine whether abundant eIF2β expression follows gene copy amplifications, we evaluated gene copy numbers using array comparative genomic hybridization, and showed that eIF2β is amplified in a subset of NSCLC cell lines (11.6%; cutoff was set as >0.2) (Figure 2B). We found a moderate correlation between gene copy numbers and protein levels in selected cell lines (Pearson correlation coefficient = 0.6155, P = .0085; Figure S1), suggesting that gene copy amplification causes high eIF2β protein expression in some cases.
Figure 2.

The eIF2β is highly expressed in lung cancers. A, Expression levels of the eIF2β protein were evaluated in 19 non‐small cell lung cancer cell lines, 3 cdk4/hTERT‐immortalized normal human bronchial epithelial cell lines, and in a normal culture of normal human bronchial epithelial cells (NHBE). B, SNP array‐based copy number variation of eIF2β in 69 NSCLC cell lines and normal human bronchial epithelial cells
To determine the clinical relevance of eIF2β in lung cancers, we examined eIF2β expression in lung adenocarcinoma tissue using TCGA dataset. These analyses showed significantly higher eIF2β mRNA expression in lung adenocarcinoma tissues than in normal adjacent tissues, (P < .0001, Mann–Whitney test and paired t test) (Figure 3A). Moreover, eIF2β mRNA levels in 118 (24.9%) of 474 lung adenocarcinomas exceeded the highest expression levels in normal adjacent tissues (Table 2), and we defined these 118 cases as belonging to the high eIF2β expression group and the other 356 cases to the low group (Figure S2). The level of eIF2β expression in lung adenocarcinomas was significantly associated with gender (P = .0142, Fisher's exact test) and smoking status (P = .0460, χ2 test), but not with age or stage (Table 2).
Figure 3.

Expression of eIF2β predicts survival in lung adenocarcinoma patients. A, Left graph showing expression levels of eIF2β mRNA in lung adenocarcinoma tumors (n = 512) and adjacent normal tissues (n = 58) in the TCGA dataset; P‐values were calculated using the Mann–Whitney U test. Right graph showing expression levels of eIF2β mRNA in 57 pairs of lung adenocarcinoma tumors and adjacent normal tissues from the same subjects; P‐values were calculated using paired t tests. B, Kaplan–Meier survival curves of lung adenocarcinoma patients in the TCGA dataset were stratified according to mRNA expression of eIF2β (eIF2β low, n = 356; eIF2β high, n = 118). C, Kaplan–Meier survival curves of lung adenocarcinoma patients in the dataset of the online Kaplan–Meier plotter were stratified according to mRNA expression of eIF2β (eIF2β low, n = 540; eIF2β high, n = 180). D, Kaplan–Meier survival curves of lung adenocarcinoma in 5 datasets of PrognoScan were stratified according to mRNA expression of eIF2β. In panels (C), (D) and (E) P‐values were calculated using log‐rank tests. All statistical tests were 2‐sided
Table 2.
eIF2β expression in lung adenocarcinoma from TCGA dataset
| Characteristic | Total | eIF2β mRNA expression | P d | |
|---|---|---|---|---|
| High, n (%) | Low, n (%) | |||
| Total | 474 | 118 (24.9) | 356 (75.1) | |
| Gender | ||||
| Male | 218 | 66 (30.3) | 152 (69.7) | .0142 |
| Female | 256 | 52 (20.3) | 204 (79.7) | |
| Age | ||||
| >65 years | 247 | 58 (23.5) | 189 (76.5) | .5236 |
| ≤65 years | 227 | 60 (26.4) | 167 (73.6) | |
| Smoking statusa | ||||
| Current | 109 | 37 (33.9) | 72 (66.1) | .0460 |
| Former | 278 | 61 (21.9) | 217 (78.1) | |
| Never | 69 | 16 (23.2) | 53 (76.8) | |
| Stageb | ||||
| I | 254 | 53 (20.9) | 201 (79.1) | .0633 |
| II | 111 | 32 (28.8) | 79 (71.2) | |
| III | 77 | 27 (35.1) | 50 (64.9) | |
| IV | 25 | 6 (24.0) | 19 (76.4) | |
| EGFR mutation statusc | ||||
| Yes | 72 | 12 (16.7) | 60 (83.3) | .0769 |
| No | 383 | 102 (26.6) | 281 (73.4) | |
Smoking status was not available for 18 samples.
Stage information were not investigated in 7 samples.
EGFR mutation information were not available for 19 samples.
P‐values were calculated by Fisher's exact test or χ2‐test.
Kaplan–Meier analyses of 474 lung adenocarcinoma patients revealed that high eIF2β expression was significantly associated with worse overall survival (log‐rank test P = .0176; Figure 3B). Furthermore, univariate Cox regression analyses revealed that eIF2β expression and stage were significantly associated with overall survival (P = .0225, HR = 1.96, 95% CI 1.07‐2.36; Table 3), and multivariable Cox regression analysis identified eIF2β as a significant independent predictor of overall survival (P = .0255, HR = 1.6‐1, 95% CI 1.06‐2.41; Table 3).
Table 3.
Univariate and multivariable analysis of overall survival in lung adenocarcinoma from TCGA dataset
| Variable | Univariate analysis | Multivariable analysis | ||||
|---|---|---|---|---|---|---|
| HR | 95% CI | P a | HR | 95% CI | P a | |
| Gender | ||||||
| Female | Reference | Reference | ||||
| Male | 0.89 | 0.61‐1.29 | .5578 | 0.79 | 0.53‐1.16 | .2280 |
| Age | ||||||
| >65 years | Reference | Reference | ||||
| ≤65 years | 0.84 | 0.58‐1.22 | .3720 | 0.76 | 0.51‐1.13 | .1759 |
| Smoking status | ||||||
| Never smoker | Reference | Reference | ||||
| Former smoker | 0.97 | 0.60‐1.63 | .8969 | 1.45 | 0.86‐2.53 | .1640 |
| Current smoker | 0.69 | 0.37‐1.28 | .2342 | 0.76 | 0.40‐1.44 | .3966 |
| Stage | ||||||
| I | Reference | Reference | ||||
| II | 2.64 | 1.63‐4.26 | <.0001 | 3.07 | 1.86‐5.07 | <0.0001 |
| III | 4.42 | 2.74‐7.11 | <.0001 | 4.66 | 2.87‐7.56 | <0.0001 |
| IV | 3.29 | 1.54‐6.40 | .0033 | 4.14 | 1.89‐8.31 | 0.0001 |
| eIF2βmRNA expression | ||||||
| Low | Reference | Reference | ||||
| High | 1.96 | 1.07‐2.36 | .0225 | 1.61 | 1.06‐2.41 | .0255 |
P‐values were calculated by likelihood ratio test.
To confirm the prognostic potential of eIF2β, we used the online Kaplan–Meier plotter (http://www.kmplot.com/lung) and PrognoScan (http://www.abren.net/PrognoScan-cgi/PrognoScan.cgi) in a large set of lung adenocarcinomas. Lung adenocarcinoma cases with high eIF2β expression in Kaplan–Meier plots had significantly worse outcomes (log‐rank test P = .0076, multivariate analysis P = .0076, HR = 1.4, 95% CI 1.09‐1.78; Figure 3C). Moreover, all 5 lung adenocarcinoma datasets from PrognoScan showed correlations between high eIF2β expression and worse overall survival, and these were significant in 2 datasets (Figure 3D).
3.3. Depletion of eIF2β induced G1 cell cycle arrest, reflecting upregulation of p21WAF1/CIP1 in lung cancer cells
In further analyses, we examined the effects of eIF2β knockdown on the growth of the non‐small cell lung cancer cell lines H460 and H1975. H460 cells were used in our previous shRNA screen and efficient knockdown of eIF2β by RNA interference was confirmed by western blotting (Figure 4A). Colorimetric growth assays and colony formation assay showed that eIF2β knockdown in H460 and H1975 suppresses cell growth and colony formation (Figure 4A,B). We also examined the effects of eIF2β knockdown on the growth of HBEC. eIF2β knockdown moderately suppresses cell growth of HBEC (Figure S3). Next, to examine the effects of eIF2β knockdown on in vivo growth of lung cancer cells, we established 2 eIF2β shRNA‐expressing H460 subclones that expressed lower levels of eIF2β protein (Figure S4). However, because of drastic growth inhibition by eIF2β knockdown in both subclones, we were unable to subcutaneously inject them into an immunodepleted mouse.
Figure 4.

Depletion of eIF2β induces G1 cell cycle arrest in part through upregulation of p21WAF 1/ CIP 1. A, Colorimetric growth assay in H460 cells and H1975 cells transfected with eIF2β siRNA or control oligos. B, Colony formation assay in H460 cells and H1975 cells transfected with eIF2β siRNA or control oligos. C, Flow cytometry analyses of cell cycle progression in H460, and H1975 cells transfected with eIF2β siRNA or control oligos; cells were harvested for analysis 48 h after siRNA treatment. D, Western blots of p21WAF 1/ CIP 1, cleaved PARP, phosphoEIF2α and ATF4 in H460, and H1975 cells transfected with eIF2β siRNA or control oligos
To investigate the growth suppressing mechanisms of eIF2β knockdown, we evaluated changes in cell cycle distribution and apoptosis after eIF2β knockdown. In cell cycle analyses, eIF2β knockdown‐induced G1 arrest and decreased numbers of H460 and H1975 cells in the S‐phase (Figure 4C). In addition, p21WAF1/CIP1 protein expression was increased following eIF2β knockdown in H1975 but not in H460 cells (Figure 4D). Because H460 but not H1975 carries wild‐type p53,18 we concluded that eIF2β knockdown‐induced G1 arrest occurred regardless of p53 status. In subsequent western blot analyses of cleaved PARP, no increase in apoptosis were observed in H460 or H1975 cells (Figure 4D). Hence, eIF2β knockdown‐induced growth inhibition of lung cancers occur primarily through G1 arrest, and involves upregulation of p21WAF1/CIP1 in some cases.
Following stresses, such as endoplasmic reticulum stress, cells reduce the translation‐initiation activity of EIF2 to activate antiproliferative pathways, primarily by phosphorylating serine 51 of the α‐subunit of EIF2 (eIF2α) and specifically upregulating stress response genes such as ATF4. Thus, we examined whether the eIF2α‐S51P‐ATF4 pathway is involved in eIF2β knockdown‐induced G1 arrest by evaluating phosphorylation of eIF2α and ATF4 expression. Knockdown of eIF2β did not affect either expression of phosphorylation of eIF2α and ATF4 in both H460 H1975 cells (Figure 4D). These data indicate that the eIF2α‐S51P‐ATF4 axis is not involved in eIF2β knockdown‐induced G1 arrest in lung cancer cells.
4. DISCUSSION
Using the TCGA database with large numbers of samples we show that eIF2β is upregulated in lung cancer tissues. Moreover, upregulation of eIF2β was correlated with worse prognosis in patients with adenocarcinoma, and this was validated in several independent cohorts using publicly available online tools. Many previous studies show that eIF2α is upregulated in several types of human cancers, including lung cancers, compared with their normal counterparts.21 Rosenwald et al previously demonstrated that eIF2α is frequently increased in bronchioalveolar carcinomas but not in squamous cell carcinomas.22 We observed a weak correlation between eIF2α and eIF2β expression (Figure S5), suggesting that simultaneous upregulation of these molecules increases translation initiation, contributing to enhanced proliferation of tumor cells. Alternatively, contributions of upregulated eIF2α and eIF2β to tumorigenesis may be more complicated, because upregulation of eIF2α does not necessarily reflect increased translation‐initiation activity. The phosphorylated form of eIF2α lacks global translation‐initiation activity, and instead promotes antiproliferative pathways.6 Therefore, to determine whether upregulation of eIF2α reflects enhanced proliferation of lung cancer cells, precise quantification of phosphorylated and unphosphorylated forms of eIF2α are required in lung tumor tissues.
During the preparation of this manuscript, Salton et al23 showed that a dominant negative form of eIF2β suppresses proliferation in human embryonic kidney 293 cells through G2 cell cycle arrest. We show that RNAi‐mediated silencing of eIF2β suppresses growth of lung cancer cells, in part through G1 arrest, and due to upregulation of p21WAF1/CIP1 in some cases. Upon eIF2β knockdown, G1 arrest was induced in both p53 wild‐type H460 and p53 mutant H1975 cells,18 suggesting that G1 arrest is induced independently of p53. Differing methods for suppressing eIF2β function result in cell cycle arrest at different phases; whereas the dominant negative form of eIF2β causes G2 arrest in HEK293 cells, RNA interference‐mediated eIF2β knockdown results in G1 arrest in lung cancer cells. Although these discrepancies are incomprehensible, differences in cellular contexts and/or unidentified functions of dominant negative eIF2β may influence the outcomes of eIF2β suppression.
Finally, we hypothesize that eIF2β knockdown interrupts the balance between GTP‐binding EIF2 (active) and GDP‐binding EIF2 (inactive), which may activate the eIF2α‐S51P‐ATF4 pathway and promote G1 arrest in lung cancer cells. However, eIF2β knockdown did not significantly affect eIF2α‐S51P‐ATF4 signaling. Alternatively, eIF2β knockdown is likely to reduce the availability of GTP‐binding EIF2, which may cause G1 arrest, although further experiments are required to support this hypothesis.
In conclusion, eIF2β was highly expressed in the present lung cancer cells and was associated with poor prognoses of patients with adenocarcinoma. In agreement, eIF2β knockdown caused G1 arrest in multiple lung cancer cell lines, suggesting potential as a therapeutic target and prognostic marker.
CONFLICTS OF INTEREST
Authors do not have any conflicts of interest to declare.
Supporting information
ACKNOWLEDGMENT
We thank Mari Kizuki for her excellent technical assistance.
Tanaka I, Sato M, Kato T, et al. eIF2β, a subunit of translation‐initiation factor EIF2, is a potential therapeutic target for non‐small cell lung cancer. Cancer Sci. 2018;109:1843–1852. https://doi.org/10.1111/cas.13602
Funding information
Grant‐in‐Aid for Exploratory Research 26670416 and Grant‐in‐Aid for Scientific Research (B) 26293197 for M. Sato; Grant‐in‐Aid for Scientific Research (C) 23591144 for M. Kondo from the Japan Society for the Promotion of Science; University of Texas Southwestern Medical Center SPORE (Grant/Award Number: P50CA70907) and CPRIT (Grant/Award Number: RP110708) for J. D. Minna.
REFERENCES
- 1. Global Burden of Disease Cancer Collabration , Fitzmaurice C, Dicker D, et al. The global burden of cancer 2013. JAMA Oncol. 2015;1:505‐527. [DOI] [PMC free article] [PubMed] [Google Scholar]
- 2. Torre LA, Siegel RL, Jemal A. Lung Cancer Statistics. Adv Exp Med Biol. 2016;893:1‐19. [DOI] [PubMed] [Google Scholar]
- 3. Chen Z, Fillmore CM, Hammerman PS, Kim CF, Wong KK. Non‐small‐cell lung cancers: a heterogeneous set of diseases. Nat Rev Cancer. 2014;14:535‐546. [DOI] [PMC free article] [PubMed] [Google Scholar]
- 4. Sato M, Shames DS, Gazdar AF, Minna JD. A translational view of the molecular pathogenesis of lung cancer. J Thorac Oncol. 2007;2:327‐343. [DOI] [PubMed] [Google Scholar]
- 5. Kakumu T, Sato M, Goto D, et al. Identification of proteasomal catalytic subunit PSMA6 as a therapeutic target for lung cancer. Cancer Sci. 2017;108:732‐743. [DOI] [PMC free article] [PubMed] [Google Scholar]
- 6. Koromilas AE. Roles of the translation initiation factor eIF2α serine 51 phosphorylation in cancer formation and treatment. Biochim Biophys Acta. 2015;1849:871‐880. [DOI] [PubMed] [Google Scholar]
- 7. Kashiwagi K, Takahashi M, Nishimoto M, et al. Crystal structure of eukaryotic translation initiation factor 2B. Nature. 2016;531:122‐125. [DOI] [PubMed] [Google Scholar]
- 8. Yuen HF, Chan KK, Grills C, et al. Ran is a potential therapeutic target for cancer cells with molecular changes associated with activation of the PI3K/Akt/mTORC1 and Ras/MEK/ERK pathways. Clin Cancer Res. 2012;18:380‐391. [DOI] [PMC free article] [PubMed] [Google Scholar]
- 9. Robles AI, Arai E, Mathe EA, et al. An integrated prognostic classifier for stage I lung adenocarcinoma based on mRNA, microRNA, and DNA methylation biomarkers. J Thorac Oncol. 2015;10:1037‐1048. [DOI] [PMC free article] [PubMed] [Google Scholar]
- 10. Kim J, McMillan E, Kim HS, et al. XPO1‐dependent nuclear export is a druggable vulnerability in KRAS‐mutant lung cancer. Nature. 2016;538:114‐117. [DOI] [PMC free article] [PubMed] [Google Scholar]
- 11. Yuen HF, Chan KK, Platt‐Higgins A, et al. Ran GTPase promotes cancer progression via Met recepto‐rmediated downstream signaling. Oncotarget. 2016;7:75854‐75864. [DOI] [PMC free article] [PubMed] [Google Scholar]
- 12. Donnelly N, Gorman AM, Gupta S, Samali A. The eIF2α kinases: Their structures and functions. Cell Mol Life Sci. 2013;70:3493‐3511. [DOI] [PMC free article] [PubMed] [Google Scholar]
- 13. Heaney JD, Michelson MV, Youngren KK, Lam MY, Nadeau JH. Deletion of eIF2beta suppresses testicular cancer incidence and causes recessive lethality in agouti‐yellow mice. Hum Mol Genet. 2009;18:1395‐1404. [DOI] [PMC free article] [PubMed] [Google Scholar]
- 14. Gatza ML, Silva GO, Parker JS, Fan C, Perou CM. An integrated genomics approach identifies drivers of proliferation in luminal‐subtype human breast cancer. Nat Genet. 2014;46:1051‐1059. [DOI] [PMC free article] [PubMed] [Google Scholar]
- 15. Ramirez RD, Sheridan S, Girard L, et al. Immortalization of human bronchial epithelial cells in the absence of viral oncoproteins. Cancer Res. 2004;64:9027‐9034. [DOI] [PubMed] [Google Scholar]
- 16. Sato M, Larsen JE, Lee W, et al. Human lung epithelial cells progressed to malignancy through specific oncogenic manipulations. Mol Cancer Res. 2013;11:638‐650. [DOI] [PMC free article] [PubMed] [Google Scholar]
- 17. Sato M, Vaughan MB, Girard L, et al. Multiple oncogenic changes (K‐RAS(V12), p53 knockdown, mutant EGFRs, p16 bypass, telomerase) are not sufficient to confer a full malignant phenotype on human bronchial epithelial cells. Cancer Res. 2006;66:2116‐2128. [DOI] [PubMed] [Google Scholar]
- 18. Forbes SA, Beare D, Boutselakis H, et al. COSMIC: Somatic cancer genetics at high‐resolution. Nucleic Acids Res. 2017;45:D777‐D783. [DOI] [PMC free article] [PubMed] [Google Scholar]
- 19. da Huang W, Sherman BT, Lempicki RA. Systematic and integrative analysis of large gene lists using DAVID bioinformatics resources. Nat Protoc. 2009;4:44‐57. [DOI] [PubMed] [Google Scholar]
- 20. da Huang W, Sherman BT, Lempicki RA. Bioinformatics enrichment tools: Paths toward the comprehensive functional analysis of large gene lists. Nucleic Acids Res. 2009;37:1‐13. [DOI] [PMC free article] [PubMed] [Google Scholar]
- 21. Yin JY, Dong Z, Liu ZQ, Zhang JT. Translational control gone awry: A new mechanism of tumorigenesis and novel targets of cancer treatments. Biosci Rep. 2011;31:1‐15. [DOI] [PubMed] [Google Scholar]
- 22. Rosenwald IB, Hutzler MJ, Wang S, Savas L, Fraire AE. Expression of eukaryotic translation initiation factors 4E and 2α is increased frequently in bronchioloalveolar but not in squamous cell carcinomas of the lung. Cancer. 2001;92:2164‐2171. [DOI] [PubMed] [Google Scholar]
- 23. Salton GD, Laurino C, Mega NO, et al. Deletion of eIF2β lysine stretches creates a dominant negative that affects the translation and proliferation in human cell line: A tool for arresting the cell growth. Cancer Biol Ther. 2017;18:560‐570. [DOI] [PMC free article] [PubMed] [Google Scholar]
Associated Data
This section collects any data citations, data availability statements, or supplementary materials included in this article.
Supplementary Materials