Abstract
Purpose
To examine repeatability and reproducibility of ellipsoid zone (EZ) width measurements in patients with retinitis pigmentosa (RP) using a longitudinal reflectivity profile (LRP) analysis.
Methods
We examined Bioptigen optical coherence tomography (OCT) scans from 48 subjects with RP or Usher syndrome. Nominal scan lengths were 6, 7, or 10 mm, and the lateral scale of each scan was calculated using axial length measurements. LRPs were generated from OCT line scans, and the peak corresponding to EZ was manually identified using ImageJ. The locations at which the EZ peak disappeared were used to calculate EZ width. Each scan was analyzed twice by each of two observers, who were masked to their previous measurements and those of the other observer.
Results
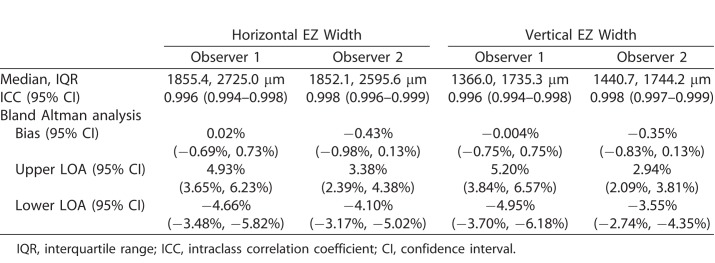
On average, horizontal width (HW) was significantly greater than vertical width (VW), and there was high interocular symmetry for both HW and VW. We observed excellent intraobserver repeatability with intraclass correlation coefficients (ICCs) ranging from 0.996 to 0.998 for HW and VW measurements. Interobserver reproducibility was also excellent for both HW (ICC = 0.989; 95% confidence interval [CI] = 0.983–0.995) and VW (ICC = 0.991; 95% CI = 0.985–0.996), with no significant bias observed between observers.
Conclusions
EZ width can be measured using LRPs with excellent repeatability and reproducibility. Our observation of greater HW than VW is consistent with previous observations in RP, though the reason for this anisotropy remains unclear.
Translational Relevance
We describe repeatability and reproducibility of a method for measuring EZ width in patients with RP or Usher syndrome. This approach could facilitate measurement of retinal band thickness and/or intensity.
Keywords: ellipsoid zone, retina, optical coherence tomography
Introduction
Retinitis pigmentosa (RP) and its syndromic forms (e.g., Usher syndrome) are inherited retinal degenerations characterized by progressive loss of rod and cone photoreceptors. Peripheral vision is lost first, and damage approaches the fovea centripetally as the disease progresses, eventually impacting central vision.1 Patients often experience night blindness and impaired dark adaptation in adolescence, followed by visual field constriction in young adulthood, commonly resulting in legal blindness by age 40.2 RP is a genetically heterogenous condition, and clinical presentation and severity of the disease varies across different modes of inheritance. Autosomal recessive RP (arRP) is the most common form2 and typically has earlier onset and more rapid progression than the autosomal dominant form (adRP).3 X-linked RP (xlRP) is the most severe form of the disease and starts earlier and progresses faster than arRP or adRP.4
Objective measurement of photoreceptor damage is critical to monitoring disease progression and outcomes in clinical trials.2,5 Optical coherence tomography (OCT) enables direct visualization of retinal layers and assessment of retinal health. One of these layers, the ellipsoid zone (EZ) (also referred to as the IS/OS junction),6,7 is a hyperreflective band in the outer retina that is used to assess the structural integrity of photoreceptors.8 In fact, it has been shown that as cone photoreceptors degenerate the EZ band diminishes in intensity.9 The width of the EZ band has been used to monitor the progression of RP10 as changes in EZ width over time reflect disease advancement and have been used as an anatomical correlate of the visual field.11–13 Examination of the EZ has also proven useful in studying the natural history of other retinal disorders including Stargardt disease,14,15 achromatopsia,16 branch retinal vein occlusion,17 retinopathy of prematurity,18 macular telangiectasia type 2,19 choroideremia,14,20 blue-cone monochromacy,21 cone-rod dystrophy,21 age-related macular degeneration,22 drug toxicity,22 and postoperative changes following macular surgery.22
Several methods for measuring EZ width have been described, such as manual identification of the EZ band boundary,4,23,24 delineation of the EZ area from an en face projection of the layer,25 and segmentation of the EZ band layer with the EZ boundary defined as the location where outer segment thickness decreases to zero.4,12,13,24,26 The accuracy of segmentation algorithms can be affected by irregularities in layer contour and/or band intensity. Indeed, segmentation errors are significantly increased in pathologic eyes when compared to normal eyes.27 Additionally, segmentation-based approaches can imply differences in layer thickness when hyperreflective bands attenuate as part of the disease process.28 Here, we used longitudinal reflectivity profile (LRP) based analysis for quantification of EZ width. Here we sought to assess the repeatability and reproducibility of this method for measuring the width of retained EZ band in patients with RP.
Methods
Subjects
All research methods followed the tenets of the Declaration of Helsinki. The study protocol was approved by the Institutional Review Board at the Medical College of Wisconsin (PRO17439 and PRO30741). Subjects provided informed written consent after the nature and possible consequences of the study were explained. Subjects with clinically diagnosed RP or Usher syndrome were eligible for inclusion. We retrospectively examined horizontal and vertical Bioptigen SD-OCT line scans acquired through the foveal center (Bioptigen, Research Triangle Park, NC) from a total of 73 subjects. Scans with inferior image quality (due to corneal defects, media opacity, high refractive errors [greater than ±10 diopters], and/or significant macular edema) were excluded. Likewise, subjects were excluded for whom their disease was advanced to a point at which no EZ was clearly discernable in their OCT images. In addition, horizontal scans in which the EZ band did not terminate prior to the nasal and/or temporal scan boundary and vertical scans in which the EZ band did not terminate prior to the inferior and/or superior scan boundary were excluded due to inability to accurately assess EZ band width. Scans from 48 subjects (22 males, 26 females; mean ± SD age = 41.6 ± 18.6 years) remained for analysis, with 23 of the 48 subjects having scans available from both eyes (total of 71 eyes). Thirty-eight subjects (55 eyes) had RP, and 10 subjects (16 eyes) had Usher syndrome. The diagnosis of RP or Usher syndrome was based on inheritance pattern, clinical symptoms, and/or genotype. A summary of subject demographics is provided in Supplementary Table S1.
SD-OCT Imaging
Scans were acquired between March 2011 and November 2015 at the Medical College of Wisconsin. Nominal scan lengths were 6, 7, or 10 mm, and each line scan comprised of 1000 A-scans/B-scan and between 80 to 120 repeated B-scans. Horizontal and vertical line scans were acquired for each imaging session. OCT line scans of both eyes were available for 23 of 48 subjects, resulting in a total of 144 line scans. The B-scans for a given line scan were registered and averaged to remove speckle noise as previously described,29 resulting in a .tif image for each line scan. Depending on eye motion and image quality, each .tif scan was an average of between 6 and 86 individual B-scans. The lateral scale of each .tif image was calculated by correcting the nominal scan length for the ratio between the assumed axial length of the OCT system (24 mm) and the actual axial length measurement for that eye (Zeiss IOL Master; Carl Zeiss Meditec, Dublin, CA).
EZ Width Measurement
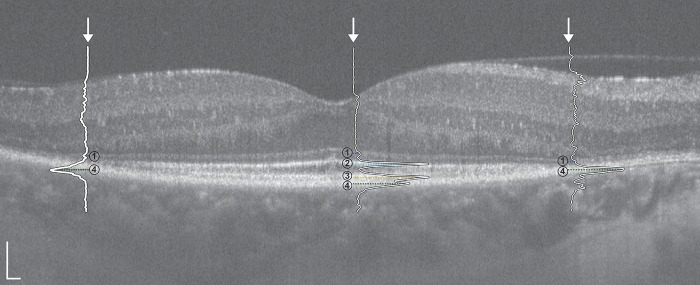
Each averaged .tif image was analyzed as follows. LRPs were generated from OCT line scans as previously described,30 and peaks corresponding to the external limiting membrane (ELM), EZ, interdigitation zone (IZ), and retinal pigment epithelium (RPE) were manually identified in ImageJ.31 Horizontal width (HW) and vertical width (VW) were calculated using the boundaries of the EZ band, defined as the locations at which the EZ peak disappeared nasally/temporally for horizontal scans and superiorly/inferiorly for vertical scans (Fig. 1; see Supplementary Video S1). For the 23 subjects for whom scans of both eyes were available, we had a single observer (M.R.S.) measure the 46 registered .tif images (23 horizontal, 23 vertical) a single time to confirm interocular symmetry. For repeatability and reproducibility analyses, one eye was chosen at random for subjects for who had images from both eyes, while images from whichever eye was available were used for the remaining 25 subjects. In these repeatability and reproducibility analyses, the EZ width was measured twice per image (96 total images; 48 horizontal, 48 vertical) by each of two observers (M.R.S. and A.L.H.), with each observer masked to their previous measurements as well as those of the other observer. The repeated measurements within each observer were separated by 1 week. The observers had different levels of experience in working with OCT images, one being a relative novice (M.R.S.) and the other being more experienced (A.L.H.).
Figure 1.
Horizontal SD-OCT line scan with superimposed LRPs from the right eye of a 50-year-old female (IE_0508) with ADRP (RHO; p.Pro23His). Numbered retinal layers correspond to the (1) ELM, (2) EZ, (3) IZ, and (4) RPE. Outer LRPs correspond to nasal (right) and temporal (left) boundaries of the EZ band. Scale bars = 100 μm.
Statistics
Unless otherwise noted, all statistical tests (including the Bland-Altman analyses) were performed using Prism version 7.0c (GraphPad, LaJolla, CA). The bias, limits of agreement (LOA), and 95% confidence intervals (CIs) for the bias and LOA were calculated following the methods of Bland and Altman.32–34 For all data sets, normality was assessed using the Shapiro-Wilk normality test. Where normality could not be confirmed, nonparametric tests were used. The specific tests used are included alongside each result, as appropriate. Intraclass correlation coefficients (ICCs) were calculated for log-transformed HW and VW measurements using R statistical software (Foundation for Statistical Computing, Vienna, Austria). Variance components models fitted separately for HW and VW data were used to evaluate the contributions of subject, observer and reading within observer (trial) to the total variance of the measurements (SAS version 9.4; SAS, Cary, NC).
Results
Interocular Symmetry
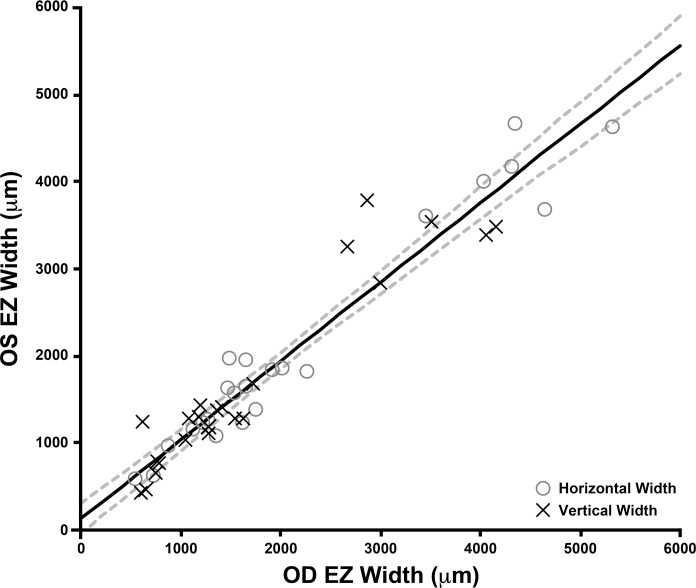
OCT line scans of both eyes were available for 23 of 48 subjects. Right and left eye EZ width measurements were highly correlated for both HW (Spearman's rank correlation coefficient = 0.915 [95% CI = 0.803–0.965]) and VW (Spearman's rank correlation coefficient = 0.887 [95% CI = 0.743–0.953]) measurements (Fig. 2). Using a Wilcoxon matched-pairs signed rank test, we found no difference between mean OD and OS EZ width measurements for both HW (P = 0.2479) and VW (P = 0.6010). These data imply a high degree of interocular symmetry of the retained EZ in patients with RP and Usher syndrome.
Figure 2.
Interocular comparison of EZ width illustrating symmetry between EZ width measurements of left (OS) and right eyes (OD). HW measurements are represented by gray open circles, while VW measurements are represented by crosses. The trend line for all EZ width measurements has a slope of 0.907 (solid line), and the dashed lines show the 95% CIs for the linear regression. No significant difference was observed between OD and OS measurements (see text).
Intraobserver Repeatability
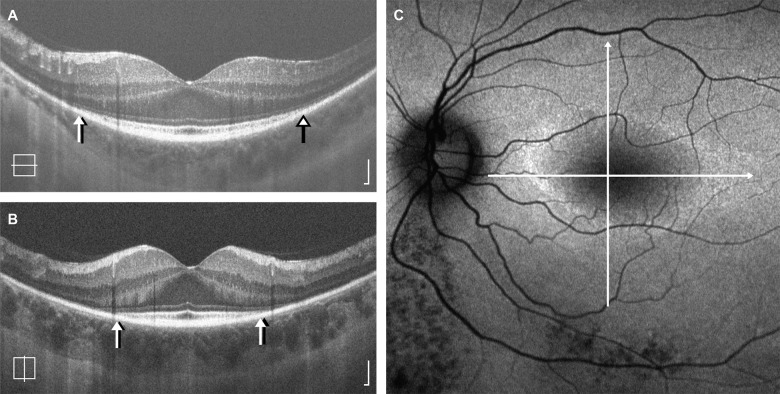
For each observer, the HW measurements were significantly greater than VW measurements (observer 1 = P < 0.0001, observer 2 = P < 0.0001; Wilcoxon matched-pairs signed rank test). The median and interquartile ranges are provided in Table 1. An example of this anisotropy is shown in Figure 3. HW and VW measurements were highly correlated (Spearman's rank coefficient observer 1 = 0.961 [95% CI = 0.929–0.9978], Spearman's rank coefficient observer 2 = 0.981 [95% CI = 0.967–0.990]). Given the difference in magnitude and variability of HW and VW, we assessed the HW and VW data separately.
Table 1.
Results and Intraobserver Repeatability of EZ Width Measurements
Figure 3.
Anisotropy in retained EZ area. Shown are horizontal (A) and vertical (B) SD-OCT line scans from the left eye of a 44-year-old female (TC_1176) with ADRP (RP1; p.R677X). Lines representing the location of each scan are superimposed on the corresponding autofluorescence image (C), which shows a horizontally elongated elliptical ring of hyperautofluorescence. The HW measurement was 1543 μm or 39% (observer 1) and 1479 μm or 37% (observer 2) greater than the VW measurement. Arrows represent the EZ boundaries identified by observer 1 (black arrows) and observer 2 (white arrows). OCT scale bars = 100 μm.
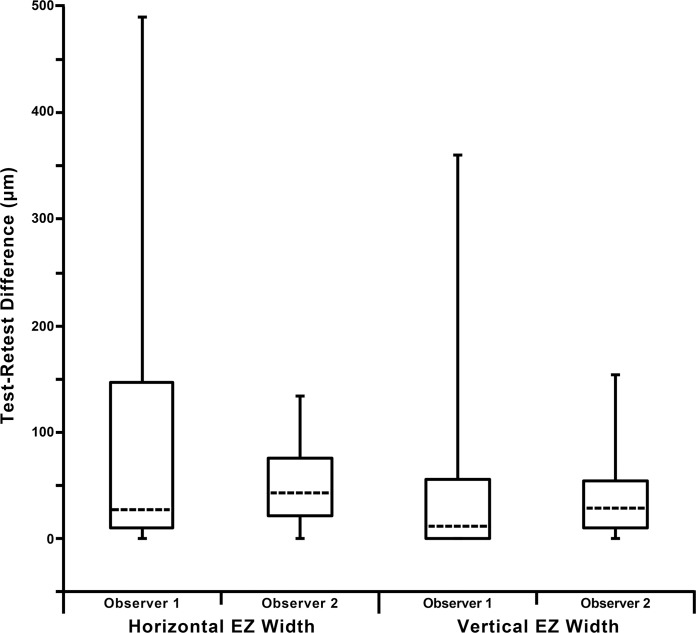
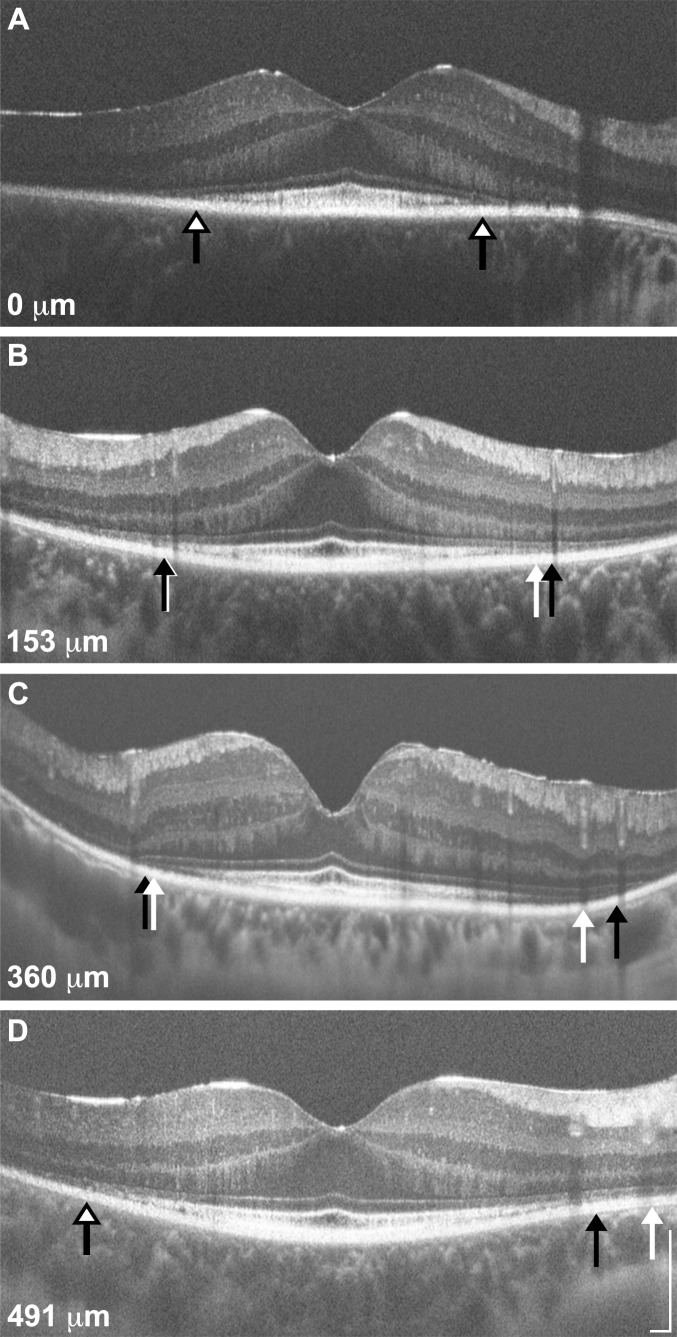
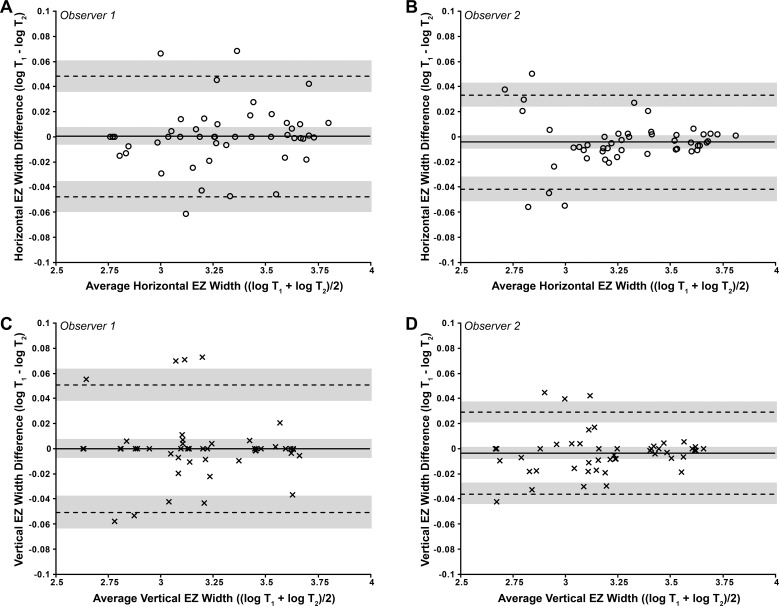
The test–retest difference was calculated from the absolute value of the differences between measurements for each observer, for both horizontal and vertical measurements (Fig. 4). The median test–retest difference was between 11 and 42 μm, though there was significant variability. Shown in Figure 5 are exemplar images illustrating variable intraobserver repeatability. As can be seen in these images, areas of discordance often occurred in proximity to blood vessel shadows projecting through the outer hyperreflective bands. As each of the eight sets of measurements (two scans, two observers, two measurements per observer) failed our normality test, the data were log transformed for the following repeatability analyses. Excellent intraobserver repeatability was observed for both HW and VW measurements, as seen by the ICC values provided in Table 1 and the Bland-Altman plots in Figure 6. Back-transforming the results of the Bland-Altman analysis provides values that relate to the ratio of the measurements from the two trials for that given observer and scan set (horizontal or vertical).33 This ratio ranged from 0.9957 to 1.0002, meaning that the bias between measurements ranged from −0.43% to 0.02%. As shown in Figure 6, no proportional bias was observed in any of the plots, and the scatter of differences was homoscedastic as a function of the mean. Individual results, along with LOA and CIs (expressed as percentages) are provided in Table 1.
Figure 4.
Test–retest differences in EZ width measurements. Shown are the median (dashed horizontal lines) for each observers HW and VW measurements. The 25th and 75th quartiles are represented by the rectangles, while the error bars extend to the minimum and maximum values for each data set. Note that the y-axis extends below 0 for clarity, as a minimum value of 0 was observed in all four data sets.
Figure 5.
Variable repeatability of EZ width measurements. Shown are four SD-OCT line scans (A, D: horizontal; B, C: vertical) representing the range of differences observed (0–491 μm). The EZ boundaries from measurement 1 are represented by white arrows, while those from measurement 2 are represented by black arrows; in cases where there was no difference between the EZ boundaries, a single white arrow with a black border is shown. Panel (A) is from a 28-year-old female (KS_10084) with Usher type II (USH2A; p.C3281F, p.C1195F, p.T5006M), panels (B, D) are from a 19-year-old female (KS_10243) with ADRP (RP1; p.R677X), and panel (C) is from a 55-year-old female (JC_1088) with Usher type III (GPR98; p.C5921R, p.L5999P). The absolute difference in EZ width is provided for each scan. Scale bars = 200 μm.
Figure 6.
Bland-Altman plots illustrating the intraobserver repeatability of EZ width measurements for (A, B) HW and (C, D) VW. HW values are represented by circles, and VW values are represented by crosses. The mean log EZ width difference (bias) is represented by the solid black line, while the dashed lines represent the 95% LOA for the bias. Shaded regions represent the confidence limits on the bias and LOA (see Methods). To assess whether repeatability was dependent on the magnitude of EZ width, we calculated the Pearson correlation coefficient (r) for each data set. (A) r = 0.117, 95% CI = −0.173 to 0.388, P = 0.43; (B) r = 0.003, 95% CI = −0.281 to 0.287, P = 0.98; (C) r = −0.032, 95% CI = −0.314 to 0.254, P = 0.83; (D) r = 0.100, 95% CI = −0.189 to 0.374, P = 0.49. These values indicate that there is no significant proportional bias. All four data sets passed the test for homoscedasticity, with P > 0.05.
Interobserver Reproducibility
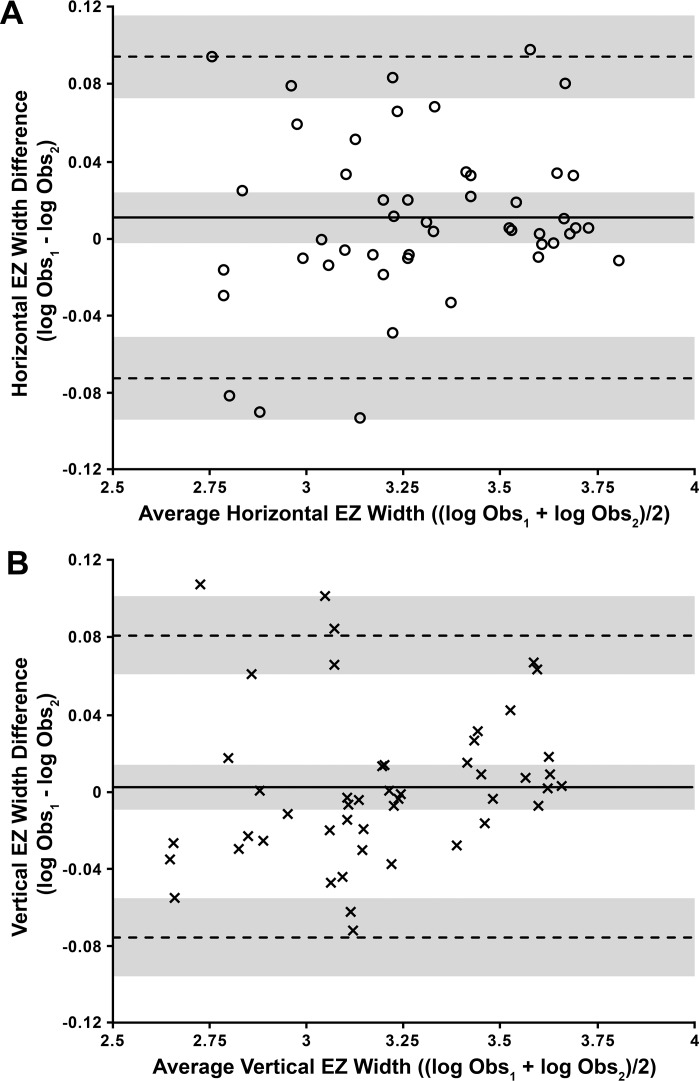
To assess interobserver reproducibility, we averaged the two trials within each observer. Again each of the four sets of measurements (two scans, two observers, one averaged measurement per observer) failed our normality test, so the data were log transformed for this analysis. There was a high interobserver agreement between observers 1 and 2 for the HW (ICC = 0.989; 95% CI = 0.983−0.995) and VW (ICC = 0.991; 95% CI = 0.985−0.996) measurements. As with the intraobserver data, back-transforming the results of the interobserver Bland-Altman analysis shown in Figure 7 provides values that relate to the ratio of the measurements from the two observers for that given scan set (horizontal or vertical).33 For HW, this ratio was 1.01, meaning that for most measurements, observer 1 exceeded observer 2 by 1.007%. However, the upper and lower LOA put the agreement between −7.07% and 9.80%, suggesting no consistent bias between the observers. For VW, this ratio was 1.002, meaning that for most measurements, observer 1 exceeded observer 2 by 0.19%. Here, the upper and lower LOA put the agreement between −7.357% and 8.35%, again suggesting no consistent bias between the observers. As with the intraobserver data no proportional bias was observed in these plots, and the scatter of differences was homoscedastic as a function of the mean (Fig. 7).
Figure 7.
Bland-Altman plots illustrating the interobserver reproducibility of EZ width measurements for (A) HW and (B) VW. HW values are represented by circles, and VW values are represented by crosses. The mean log EZ width difference (bias) is represented by the solid black line, while the dashed lines represent the 95% LOA for the bias. Shaded regions represent the confidence limits on the bias and LOA (see Methods). To assess whether repeatability was dependent on the magnitude of EZ width, we calculated the Pearson correlation coefficient (r) for each data set. (A) r = 0.156, 95% CI = −0.134 to 0.422, P = 0.29; (B) r = 0.178, 95% CI = −0.112 to 0.440, P = 0.23. These values indicate that there is no significant proportional bias. Both data sets passed the test for homoscedasticity, with P > 0.05.
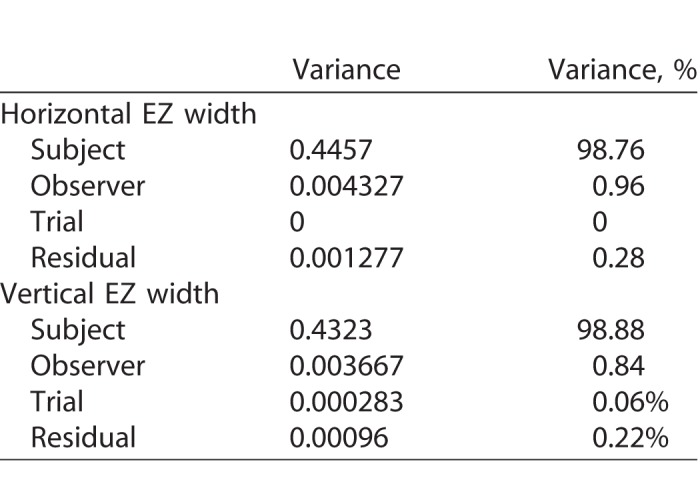
A final way to assess the variability in our EZ width data is through the analysis of variance components, which might be thought of as a generalization of ICC analysis. Table 2 provides a summary of the magnitude of variances as well as their percent values of the total variance. These data show that the variance associated with observers and readings within observer (trials) are extremely small compared to the variance associated with subjects. This suggests this method can be used to reliably measure EZ width in subjects with RP or Usher syndrome.
Table 2.
Variance Components Modeling Results
Discussion
In this study, we determined the repeatability of measurements of EZ width obtained using an LRP-based analysis in patients with RP and Usher syndrome. We observed excellent intraobserver repeatability and interobserver reproducibility. Our test–retest differences were generally comparable to those in previous studies, which have reported mean test–retest differences ranging from 10 to 110 μm when comparing first and second measurements of EZ width in RP.4,12,24–26,35 Across both observer, the average test–retest difference was 52.6 μm, with 22% of measurements having a test–retest difference of 0 μm. It should be noted, however, that our study relied on comparison of different measurements taken of the same scan by the same observer, whereas prior studies compared measurements from two different scans obtained at closely spaced visits. As such, we might expect slightly better agreement in our measurements. We observed the worst repeatability in images with low signal-to-noise ratio, extensive vessel shadowing in the parafoveal region, and blurring between outer retinal bands. Importantly, while both observers had excellent repeatability (as demonstrated by the ICC analysis), observer 1 (relative novice) had a number of test–retest differences above 200 μm, whereas observer 2 (more experienced) had no such disparate measures. This observation suggests that (1) observer training is critical with these methods and (2) development of automated and/or objective measures of EZ integrity will likely be needed.
As is seen with other OCT-based measures of retinal structure (e.g., foveal pit morphology, retinal thickness), we observed high interocular symmetry for the EZ width measurements. This is consistent with previously reported functional symmetry in patients with RP.36 Strong structural interocular symmetry was also seen in a group of 32 subjects with RPGR-associated RP, though some subjects showed interocular differences in EZ width as great as 51%.37 For the 23 subjects for whom we had right and left eye data, the largest difference in EZ width we observed was 27%, though only two of these subjects had RPGR-associated RP. Recently, Sujirakul et al.35 reported asymmetrical structural progression between right and left eyes in 19% of their patients. It would be interesting to monitor the progression rate in the few subjects in our cohort who displayed moderate interocular asymmetry.
Average HW was greater than VW, which is consistent with previous findings.4,35 The reason for this anisotropy is unclear; however, previous studies have observed higher rod and cone packing density along the horizontal meridian.38,39 Whether this bias impacts disease progression remains to be seen; however, previous studies have not reported any significant differences in the rate of progression along the vertical and horizontal meridians.4,24,35 As has been seen in measurement of the foveal avascular zone (FAZ) using OCT angiography (OCTA),40 estimates of EZ area may be inaccurate due to the anisotropy of the region. Hariri et al.25 have developed a method for measuring EZ area by segmenting its en face projection using SD-OCT, but even that may be insensitive to small changes in progression that might occur preferentially along a specific meridian. That said, Ho et al. examined EZ area in RP and reported a correlation between EZ area and the hill of vision (Ho A, et al. IOVS. 2014;55:ARVO E-Abstract 3380). Thus the importance of EZ area as a possible biomarker seems clear. Exploration of metrics currently being used to assess the FAZ in OCTA images such as acircularity and axis ratio41 may be helpful in tracking the EZ area with high sensitivity.
Limitations of our study include the fact that we utilized OCT scans from a single device. It remains to be seen whether the automated averaging techniques employed on many clinical devices permits the same examination of LRP features utilized here. In addition, we were limited to a retrospective data set, which introduced a couple of limitations. First, the scan size was variable, and this contributed to a number of scans being unanalyzable. In an extreme case, use of a scan size of 3 mm would obviate measurement of EZ width in nearly all of our subjects. While 6 mm was our smallest scan size, had we used a 10 or 12 mm scan in all subjects we likely could have included more subjects for analysis, though the lateral resolution of the resultant images would have been lower (possibly compromising the LRP analysis). A second limitation introduced by the retrospective analysis is that we could not control for disease stage (either due to different ages or different mutation subtypes), thus subanalysis of any relationship between EZ width and age or genotype was not possible. Finally, we restricted this analysis to images of sufficient quality to examine the EZ. In a clinical environment, image quality may be more variable; thus, our estimates of repeatability are likely a best-case scenario. In the future, it would be worth examining the utility of LRP-based analyses in more “realistic” data sets.
In conclusion, measuring EZ width in patients with RP and Usher syndrome using LRPs derived from freely available software is a method with excellent intraobserver repeatability and interobserver reproducibility. One advantage of this method over manual marking of the EZ band boundaries is that an LRP can also be used to measure the thickness42–44 and intensity45,46 of the EZ and other hyperreflective bands. Further improvements could be made by automating the process of LRP generation or objective peak identification using OCT Reflectivity Analytics software.47 Our group has taken an interest in elucidating the repeatability of image analysis tools in other ocular imaging modalities,48,49 and the ophthalmic imaging community has also deemed it important to accurately interpret and compare results from different studies. It is important to note that these findings should not be extrapolated to other retinal diseases that may show qualitatively similar transition zones on OCT such as choroideremia20 or Stargardt disease,14 and separate repeatability and reliability studies are likely needed for those specific patient populations.
Supplementary Material
Acknowledgments
The authors would like to thank Erin Curran, Rachel Linderman, Katie Litts, Rebecca Mastey, Emily Patterson, Hannah Russell, Benjamin Sajdak, Alexander Salmon, and Phyllis Summerfelt for their assistance.
Supported in part by the National Center for Advancing Translational Sciences of the National Institutes of Health (NIH) under award numbers UL1TR001436 and TL1TR001437, by the National Eye Institute of the NIH under award numbers R01EY017607 and P30EY001931, and by the National Institute of General Medical Sciences of the NIH under award number T32GM080202. This investigation was conducted in a facility constructed with support from the Research Facilities Improvement Program, Grant Number C06RR016511, from the National Center for Research Resources, National Institutes of Health. The content is solely the responsibility of the authors and does not necessarily represent the official views of the National Institutes of Health.
Disclosure: M.R. Strampe, None; A.L. Huckenpahler, None; B.P. Higgins, None; S. Tarima, None; A. Visotcky, None; K.E. Stepien, None; C.N. Kay, None; J. Carroll, None
References
- 1. Berson EL. . Retinitis pigmentosa: the Friedenwald lecture. Invest Ophthalmol Vis Sci. 1993; 34: 1659– 1676. [PubMed] [Google Scholar]
- 2. Hartong DT, Berson EL, Dryja TP. . Retinitis pigmentosa. Lancet. 2006; 368: 1795– 1809. [DOI] [PubMed] [Google Scholar]
- 3. Pearlman JT. . Mathematical models of retinitis pigmentosa: a study of the rate of progress in the different genetic forms. Trans Am Ophthalmol Soc. 1979; 77: 643– 656. [PMC free article] [PubMed] [Google Scholar]
- 4. Cai CX, Locke KG, Ramachandran R, Birch DG, Hood DC. . A comparison of progressive loss of the ellipsoid zone (EZ) band in autosomal dominant and X-linked retinitis pigmentosa. Invest Ophthalmol Vis Sci. 2014; 55: 7417– 7422. [DOI] [PMC free article] [PubMed] [Google Scholar]
- 5. Talcott KE, Ratnam K, Sundquist S,et al. Longitudinal study of cone photoreceptors during retinal degeneration and in response to ciliary neurotrophic factor treatment. Invest Ophthalmol Vis Sci. 2011; 52: 2219– 2226. [DOI] [PMC free article] [PubMed] [Google Scholar]
- 6. Staurenghi G, Sadda S, Chakravarthy U, Spaide RF, Panel IO. . Proposed lexicon for anatomic landmarks in normal posterior segment spectral-domain optical coherence tomography: The IN•OCT consensus. Ophthalmology. 2014; 121: 1572– 1578. [DOI] [PubMed] [Google Scholar]
- 7. Ross DH, Clark ME, Godara P,et al. RefMob, a reflectivity feature model-based automated method for measuring four outer retinal hyperreflective bands in optical coherence tomography. Invest Ophthalmol Vis Sci. 2015; 56: 4166– 4176. [DOI] [PMC free article] [PubMed] [Google Scholar]
- 8. Spaide RF, Curcio CA. . Anatomical correlates to the bands seen in the outer retina by optical coherence tomography: literature review and model. Retina. 2011; 31: 1609– 1619. [DOI] [PMC free article] [PubMed] [Google Scholar]
- 9. Hood DC, Zhang X, Ramachandran R,et al. The inner segment/outer segment border seen on optical coherence tomography is less intense in patients with diminished cone function. Invest Ophthalmol Vis Sci. 2011; 52: 9703– 9709. [DOI] [PMC free article] [PubMed] [Google Scholar]
- 10. Hoffman DR, Hughbanks-Wheaton DK, Spencer R,et al. Docosahexaenoic acid slows visual field progression in X-linked retinitis pigmentosa: ancillary outcomes of the DHAX trial. Invest Ophthalmol Vis Sci. 2015; 56: 6646– 6653. [DOI] [PMC free article] [PubMed] [Google Scholar]
- 11. Smith TB, Parker M, Steinkamp PN, Weleber RG, Smith N, Wilson DJ;. VPA Clinical Trial Study Group; EZ Working Group. Structure-function modeling of optical coherence tomography and standard automated perimetry in the retina of patients with autosomal dominant retinitis pigmentosa. PLoS One. 2016; 11: e0148022. [DOI] [PMC free article] [PubMed] [Google Scholar]
- 12. Hood DC, Ramachandran R, Holopigian K, Lazow M, Birch DG, Greenstein VC. . Method for deriving visual field boundaries from OCT scans of patients with retinitis pigmentosa. Biomed Opt Express. 2011; 2: 1106– 1114. [DOI] [PMC free article] [PubMed] [Google Scholar]
- 13. Birch DG, Locke KG, Felius J,et al. Rates of decline in regions of the visual field defined by frequency-domain optical coherence tomography in patients with RPGR-mediated X-linked retinitis pigmentosa. Ophthalmology. 2015; 122: 833– 839. [DOI] [PMC free article] [PubMed] [Google Scholar]
- 14. Lazow MA, Hood DC, Ramachandran R,et al. Transition zones between healthy and diseased retina in choroideremia (CHM) and Stargardt disease (STGD) as compared to retinitis pigmentosa (RP). Invest Ophthalmol Vis Sci. 2011; 52: 9581– 9590. [DOI] [PMC free article] [PubMed] [Google Scholar]
- 15. Light JG, Fard MA, Yaseri M, Aiyetan P, Handa JT, Ebrahimi KB. . Stargardt disease: beyond flecks and atrophy. Retina. 2017; 37: 2352– 2361. [DOI] [PubMed] [Google Scholar]
- 16. Zobor D, Werner A, Stanzial F,et al. The clinical phenotype of CNGA3-related achromatopsia: pretreatment characterization in preparation of a gene replacement therapy trial. Invest Ophthalmol Vis Sci. 2017; 58: 821– 832. [DOI] [PubMed] [Google Scholar]
- 17. Kadomoto S, Muraoka Y, Ooto S,et al. Evaluation of macular ischemia in eyes with branch retinal vein occlusion: an optical coherence tomography angiography study. Retina. 2018; 38: 272– 282. [DOI] [PubMed] [Google Scholar]
- 18. Thanos A, Yonekawa Y, Todorich B,et al. Spectral-domain optical coherence tomography in older patients with history of retinopathy of prematurity. Ophthalmic Surg Lasers Imaging. 2016; 47: 1086– 1094. [DOI] [PubMed] [Google Scholar]
- 19. Gaudric A, Krivosic V, Tadayoni R. . Outer retina capillary invasion and ellipsoid zone loss in macular telangiectasia type 2 imaged by optical coherence tomography angiography. Retina. 2015; 35: 2300– 2306. [DOI] [PubMed] [Google Scholar]
- 20. Hariri AH, Velaga SB, Girach A,et al. Natural History of the Progression of Choroideremia (NIGHT) Study Group. Measurement and reproducibility of preserved ellipsoid zone area and preserved retinal pigment epithelium area in eyes with choroideremia. Am J Ophthalmol. 2017; 179: 110– 117. [DOI] [PubMed] [Google Scholar]
- 21. Scoles D, Flatter JA, Cooper RF,et al. Assessing photoreceptor structure associated with ellipsoid zone disruptions visualized with optical coherence tomography. Retina. 2016; 36: 91– 103. [DOI] [PMC free article] [PubMed] [Google Scholar]
- 22. Itoh Y, Vasanji A, Ehlers JP. . Volumetric ellipsoid zone mapping for enhanced visualisation of outer retinal integrity with optical coherence tomography. Br J Ophthalmol. 2016; 100: 295– 299. [DOI] [PMC free article] [PubMed] [Google Scholar]
- 23. Ramachandran R, Cai CX, Lee D,et al. Reliability of a manual procedure for marking the EZ endpoint location in patients with retinitis pigmentosa. Transl Vis Sci Technol. 2016; 5: 6. [DOI] [PMC free article] [PubMed] [Google Scholar]
- 24. Ramachandran R, Zhou L, Locke KG, Birch DG, Hood DC. . A comparison of methods for tracking progression in X-linked retinitis pigmentosa using frequency domain OCT. Transl Vis Sci Technol. 2013; 2:ePub. [DOI] [PMC free article] [PubMed]
- 25. Hariri AH, Zhang HY, Ho A,et al. Trial of Oral Valproic Acid for Retinitis Pigmentosa Group. Quantification of ellipsoid zone changes in retinitis pigmentosa using en face spectral domain-optical coherence tomography. JAMA Ophthalmol. 2016; 134: 628– 635. [DOI] [PMC free article] [PubMed] [Google Scholar]
- 26. Birch DG, Locke KG, Wen Y, Locke KI, Hoffman DR, Hood DC. . Spectral-domain optical coherence tomography measures of outer segment layer progression in patients with X-linked retinitis pigmentosa. JAMA Ophthalmol. 2013; 131: 1143– 1150. [DOI] [PMC free article] [PubMed] [Google Scholar]
- 27. Giani A, Cigada M, Esmaili DD,et al. Artifacts in automatic retinal segmentation using different optical coherence tomography instruments. Retina. 2010; 30: 607– 616. [DOI] [PubMed] [Google Scholar]
- 28. Stepien KE, Kay DB, Carroll J. . Outer segment length in different best disease genotypes—reply. JAMA Ophthalmol. 2014; 132: 1153. [DOI] [PubMed] [Google Scholar]
- 29. Tanna H, Dubis AM, Ayub N,et al. Retinal imaging using commercial broadband optical coherence tomography. Br J Ophthalmol. 2010; 94: 372– 376. [DOI] [PMC free article] [PubMed] [Google Scholar]
- 30. Huang Y, Cideciyan AV, Papastergiou GI,et al. Relation of optical coherence tomography to microanatomy in normal and rd chickens. Invest Ophthalmol Vis Sci. 1998; 39: 2405– 2416. [PubMed] [Google Scholar]
- 31. Rasband WS. . ImageJ. Bethesda, MD: US National Institutes of Health; 1997–2014. [Google Scholar]
- 32. Bland JM, Altman DG. . Statistical methods for assessing agreement between two methods of clinical measurement. Lancet. 1986; 1: 307– 310. [PubMed] [Google Scholar]
- 33. Bland JM, Altman DG. . Measuring agreement in method comparison studies. Stat Methods Med Res. 1999; 8: 135– 160. [DOI] [PubMed] [Google Scholar]
- 34. Bland JM, Altman DG. . Applying the right statistics: analyses of measurement studies. Ultrasound Obstet Gynecol. 2003; 22: 85– 93. [DOI] [PubMed] [Google Scholar]
- 35. Sujirakul T, Lin MK, Duong J, Wei Y, Lopez-Pintado S, Tsang SH. . Multimodal imaging of central retinal disease progression in a 2-year mean follow-up of retinitis pigmentosa. Am J Ophthalmol. 2015; 160: 786– 798. [DOI] [PMC free article] [PubMed] [Google Scholar]
- 36. Massof RW, Finkelstein D, Starr SJ, Kenyon KR, Fleischman JA, Maumenee IH. . Bilateral symmetry of vision disorders in typical retinitis pigmentosa. Br J Ophthalmol. 1979; 63: 90– 96. [DOI] [PMC free article] [PubMed] [Google Scholar]
- 37. Tee JJ, Carroll J, Webster AR, Michaelides M. . Quantitative analysis of retinal structure using spectral domain optical coherence tomography in RPGR-associated retinopathy. Am J Ophthalmol. 2017; 178: 18– 26. [DOI] [PMC free article] [PubMed] [Google Scholar]
- 38. Curcio CA, Sloan KR, Kalina RE, Hendrickson AE. . Human photoreceptor topography. J Comp Neurol. 1990; 292: 497– 523. [DOI] [PubMed] [Google Scholar]
- 39. Chui TYP, Song HX, Burns SA. . Adaptive-optics imaging of human cone photoreceptor distribution. J Opt Soc Am A. 2008; 25: 3021– 3029. [DOI] [PMC free article] [PubMed] [Google Scholar]
- 40. Chui TYP, VanNasdale DA, Elsner AE, Burns SA. . The association between the foveal avascular zone and retinal thickness. Invest Ophthalmol Vis Sci. 2014; 55: 6870– 6877. [DOI] [PMC free article] [PubMed] [Google Scholar]
- 41. Krawitz BD, Mo S, Geyman LS,et al. Acircularity index and axis ratio of the foveal avascular zone in diabetic eyes and healthy controls measured by optical coherence tomography angiography. Vision Res. 2017; 139: 177– 186. [DOI] [PubMed] [Google Scholar]
- 42. Hansen SO, Cooper RF, Dubra A, Carroll J, Weinberg DV. . Selective cone photoreceptor injury in acute macular neuroretinopathy. Retina. 2013; 33: 1650– 1658. [DOI] [PMC free article] [PubMed] [Google Scholar]
- 43. Flatter JA, Cooper RF, Dubow MJ,et al. Outer retinal structure after closed-globe blunt ocular trauma. Retina. 2014; 34: 2133– 2146. [DOI] [PMC free article] [PubMed] [Google Scholar]
- 44. Kay DB, Land ME, Cooper RF,et al. Outer retinal structure in Best vitelliform macular dystrophy. JAMA Ophthalmol. 2013; 131: 1207– 1215. [DOI] [PMC free article] [PubMed] [Google Scholar]
- 45. Godara P, Cooper RF, Sergouniotis PI,et al. Assessing retinal structure in complete congenital stationary night blindness and Oguchi disease. Am J Ophthalmol. 2012; 154: 987– 1001. [DOI] [PMC free article] [PubMed] [Google Scholar]
- 46. Sundaram V, Wilde C, Aboshiha J,et al. Retinal structure and function in achromatopsia: Implications for gene therapy. Ophthalmology. 2014; 121: 234– 245. [DOI] [PMC free article] [PubMed] [Google Scholar]
- 47. Wilk MA, Wilk BM, Langlo CS, Cooper RF, Carroll J. . Evaluating outer segment length as a surrogate measure of peak foveal cone density. Vision Res. 2017; 130: 57– 66. [DOI] [PMC free article] [PubMed] [Google Scholar]
- 48. Liu BS, Tarima S, Visotcky A,et al. The reliability of parafoveal cone density measurements. Br J Ophthalmol. 2014; 98: 1126– 1131. [DOI] [PMC free article] [PubMed] [Google Scholar]
- 49. Garrioch R, Langlo C, Dubis AM, Cooper RF, Dubra A, Carroll J. . Repeatability of in vivo parafoveal cone density and spacing measurements. Optom Vis Sci. 2012; 89: 632– 643. [DOI] [PMC free article] [PubMed] [Google Scholar]
Associated Data
This section collects any data citations, data availability statements, or supplementary materials included in this article.


