Abstract
Background
Recently, skeletal muscle atrophy, impairment of iron metabolism, and insulin signalling have been reported in rats suffering from amyotrophic lateral sclerosis (ALS). However, the interrelationship between these changes has not been studied. We hypothesize that an impaired Akt–FOXO3a signalling pathway triggers changes in the iron metabolism in the muscles of transgenic animals.
Methods
In the present study, we used transgenic rats bearing the G93A hmSOD1 gene and their non‐transgenic littermates. The study was performed on the muscles taken from animals at three different stages of the disease: asymptomatic (ALS I), the onset of the disease (ALS II), and the terminal stage of the disease (ALS III). In order to study the molecular mechanism of changes in iron metabolism, we used SH‐SY5Y and C2C12 cell lines stably transfected with pcDNA3.1, SOD1 WT and SOD1 G93A, or FOXO3a TM‐ER.
Results
A significant decrease in P‐Akt level and changes in iron metabolism were observed even in the group of ALS I animals. This was accompanied by an increase in the active form of FOXO3a, up‐regulation of atrogin‐1, and catalase. However, significant muscle atrophy was observed in ALS II animals. An increase in ferritin L and H was accompanied by a rise in PCBP1 and APP protein levels. In SH‐SY5Y cells stably expressing SOD1 or SOD1 G93A, we observed elevated levels of ferritin L and H and non‐haem iron. Interestingly, insulin treatment significantly down‐regulated ferritin L and H proteins in the cell. Conversely, cells transfected with small interfering RNA against Akt 1, 2, 3, respectively, showed a significant increase in the ferritin and FOXO3a levels. In order to assess the role of FOXO3a in the ferritin expression, we constructed a line of SH‐SY5Y cells that expressed a fusion protein made of FOXO3a fused at the C‐terminus with the ligand‐binding domain of the oestrogen receptor (TM‐ER) being activated by 4‐hydroxytamoxifen. Treatment of the cells with 4‐hydroxytamoxifen significantly up‐regulated ferritin L and H proteins level.
Conclusions
Our data suggest that impairment of insulin signalling and iron metabolism in the skeletal muscle precedes muscle atrophy and is mediated by changes in Akt/FOXO3a signalling pathways.
Keywords: ALS, Oxidative stress, p66Shc, Ferritin, FOXO3a, Muscle iron metabolism
Introduction
There is an increasing number of studies demonstrating a role of iron in pathomechanism of various diseases. Amyotrophic lateral sclerosis (ALS) is one of the diseases in which impairment of iron metabolism has been observed. The role of iron is supported by the effects of iron chelator, which has been shown to extend the life span of transgenic animals by 5 weeks.1 In addition, iron accumulation in the central nervous system of ALS patients as well as in the skeletal muscle of transgenic animals have been reported.2, 3, 4 Iron is a transition metal participating in redox reactions. Free iron ions can stimulate the formation of reactive oxygen species (ROS). Cellular iron stored by ferritin does not participate in redox reactions and is considered a safe iron pool. However, there are some data indicating that higher iron stores correlate with DNA damage and risk of certain morbidities.5 We had previously demonstrated that activation of c‐Jun N‐terminal kinase led to ferritin degradation and an increase in iron‐dependent formation of ROS, which is a proof that iron is not completely safe even when stored within ferritin.6 Thus, it became clear that higher iron accumulation may be a factor that determines iron‐dependent ROS formation during stress condition. The mechanism of iron transport into a cell is quite well understood; however, the cause of iron accumulation, which is observed in certain tissues, is not known. Most of the cells are able to export iron by ferroportin, and we observed that the level of ferroportin protein significantly decreased during progression of ALS in rats.4 It is important to note that tissue iron accumulation is associated with several morbidities; however, it is still not clear if the phenomenon is a cause or effect of the disease process.7 There is evidence that insulin and insulin‐like growth factor 1 signalling is impaired in the skeletal muscle of transgenic animals, as well as in the animal model of ALS, and also in patients presenting with ALS or cancer patients with cachexia.8, 9 In other experimental models, it has been demonstrated that excess tissue iron accumulation is associated with impaired insulin signalling.10 Phlebotomy is known to decrease body iron stores and improve insulin sensitivity.11 Conversely, skeletal muscle immobilization induced insulin resistance and is accompanied by iron‐dependent oxidative stress.12 These and some other studies strongly indicate that there is an interrelationship between insulin signalling and iron metabolism. Insulin‐like growth factor/insulin receptor phosphorylates and activates multiple substrates with serine/threonine protein kinase‐Akt being one of them. Consistently reduced activity of Akt in the skeletal muscle of ALS patients, G93A SOD1 transgenic animals and insulin resistant patients was observed.8 Kinase Akt is involved in many processes and controls the activity of several proteins like FOXO3a, which is a forkhead transcriptional factor. In fact, is has been demonstrated that the inactivation of Akt in transgenic animals is associated with an activation of FOXO3a and increased transcription of the genes being under control of FOXO3a like superoxide dismutase, catalase, and atrogin‐1. Consistently, a study performed on Caenorhabditis elegans demonstrated that forkhead‐related transcription factor DAF‐16 regulates iron metabolism by increasing the expression of ferritin H.13 Thus, it is quite possible that iron itself or proteins involved in the iron metabolism may influence insulin/Akt/FOXO3a signalling pathway and/or vice versa. The main purpose of this study was to re‐examine the role of Akt/FOXO3a signalling pathways in terms of iron metabolism in transgenic animal model of ALS as well as in the cell culture expressing mutated SOD1 (SOD1 G93A). Here, we report that Akt inactivation and activation of FOXO3a as observed in the skeletal muscle of ALS animals are responsible for ferritin up‐regulation and iron accumulation. These changes are accompanied by an increase in amyloid precursor protein (APP) and iron chaperon PCBP1 protein in the skeletal muscle of ALS rats.
Materials and methods
Animals
Sprague Dawley rats with a human SOD1 transgene (G93A) [TgN(SOD1G93A)L26H NTac:SD, #2148] were obtained from Taconic Laboratories, under the material transfer agreement with Wyeth Co. (USA). All experiments were carried out using male Tg‐CuZnSOD1 rats and matched wild‐type littermates as controls. The rats were housed behind a sanitary barrier in a controlled environment at 23 ± 2 °C and 50–60% relative humidity, under 12‐h light–dark cycle and specific pathogen‐free status. Food and water were available ad libitum. The animals were divided into three groups according to disease progression: asymptomatic, 12 weeks of life (ALS I); disease onset with hind limb paresis, 21 weeks (ALS II); and end‐stage disease, 24 weeks (ALS III). The age of death was defined as euthanasia performed at the time of inability to right themselves when pushed on their side, also defined as tetraparesis. Animals were observed daily to assess their motor capabilities. Rats were anaesthetised with gaseous isoflurane and maintained under general anaesthesia as the tissue was collected. The tibialis anterior (TA) and extensor digitorum longus (EDL) muscles were removed from both hind limbs, dissected from fat and connective tissue, and instantly frozen in liquid nitrogen.
Weight assessment
The collected muscle of EDL was weighted to determine muscle atrophy as compared with controls. The data were normalized into milligrams of wet muscle mass per grams of rat body mass [mg/g].
Tissue homogenization
Following the dissection performed at 4 °C, the tissue samples were kept at 80 °C. For experiments, weighted pieces of tissue were homogenized using a glass Teflon homogenizer (10% wt/vol) in lysis buffer containing 50 mM Tris HCl, 1 mM EDTA, 1.15% KCl, 0.1% Triton X‐100; pH = 7.4, with inhibitor proteases (Roche, Cat No. 4693159001) and inhibitor phosphatases (Roche, Cat. No. 04906837001). The homogenates were centrifuged at 600 g for 10 min at 4 °C to pre‐clean the supernatants for the following experiments. The resulting supernatant was decanted and frozen for further measurements, and the pellets were centrifuged at 16 000 g at 4 °C for 20 min. Protein concentration was measured with the Bradford method.
Cell culture reagents
The mouse muscle myoblast C2C12 (ATCC® CRL‐1772™) and human bone marrow SH‐SY5Y (ATCC® CRL‐2266™) cells were purchased from American Type Culture Collection (Manassas, Va, USA). The Reagents for cell culture, including Dulbecco's modified Eagle's medium (DMEM) High Glucose (Sigma D6429), DMEM/F12 (Sigma 51445C), antibiotic mixture, foetal bovine serum, trypsin–EDTA, and L‐glutamine, were purchased from Sigma‐Aldrich Ltd (Poznan, Poland). The reagents to carry out small interfering RNA (siRNA) transfection were obtained from Santa Cruz Biotechnology (Dallas, USA): siRNA Control (sc‐37007), siRNA Akt 1 (m) (sc‐29196), siRNA Akt 2 (m) (sc‐38910), siRNA Akt3 (m) (sc‐38912), and siRNA Transfection Reagnet (sc‐29528). For treatment, we used insulin (Sigma I9278) or 4‐hydroxytamoxifen (4OHT) (Sigma H7904).
Cell culture
The cells were cultured in growth medium consisting of high‐glucose DMEM (Sigma‐Aldrich Ltd), 10% (vol/vol) foetal bovine serum, 100 U/mL penicillin, and 100 μg/mL streptomycin (Sigma‐Aldrich Ltd, Poznan, Poland) at 37 °C in a humidified atmosphere of 5% CO2. The cells were maintained at 37 °C in an atmosphere of 95% air and 5% CO2.
Plasmid expressing pcDNA3.1 was kindly provided by Blirt S.A (BioLab Innovative Research Technologies, Gdansk, Poland). Additional plasmids pF155 pcDNA3.1(+)SOD1 G93A (#26401), pF151 pcDNA3.1(+)SOD1 WT (#26397), and HA‐FOXO3a TM‐ER (#8353) were purchased from Addgene (Addgene, LGC Standards Teddington, UK).
Deriving of stable lines expressing SOD1 G93A, SOD1 WT, HA‐FOXO3a TM‐ER, or empty pcDNA3.1 in C2C12 as well as in SH‐SY5Y cells was conducted by Blirt S.A (BioLab Innovative Research Technologies).
SH‐SY5Y cells were electroporated with a gene plasmid using BioRad Gene Pulser Xcell electroporation under the condition of 220 V/1puls/30 ms. For C2C12 cells, PEI chemical transfection was selected under DNA conditions: PEI‐1:3 and determination of selective concentration of antibiotic G‐418 was conducted. After that, clonal selection and western blot analysis were performed to confirm protein expression in individual clones.
For treatment procedure, cells were seeded on a plate in an adequate amount and allowed to attach overnight. On the next day, the cells were transitionally transfected according to the manufacturer's procedure or treated with 200 nM insulin or 1 μM 4OHT in various combinations.
Small interfering RNA transfection
The cells were seeded at a density of 1.5 × 10⁶ per 6 cm plate and allowed to attach overnight. At 50% to 60% confluence, the mix of each siRNA duplex (siRNA control, Akt1, Akt2, and Akt3) and siRNA Transfection Reagent were administered. Five hours after transfection, the cells were supplied with the medium containing serum and antibiotics at concentrations two times higher than standard. On the following day (20 h after medium addition), media were replaced with the fresh ones. Forty‐eight hours after transfection, cells were harvested for assays.
Cell lysate
C2C12 and SHSY‐5Y stable cell lines were treated as described previously. Both floating and attached cells were collected, washed in phosphate‐buffered saline, resuspended in a lysis solution containing 50 mmol/L Tris–HCl (pH 7.5), 150 mmol/L NaCl, 1% Triton X‐100, 0.1% sodium dodecyl sulfate, and incubated for 40 min on ice with gentle shaking. The cell lysate was cleared by centrifugation at 16 000 g for 20 min and kept on ice in order to carry out the next procedure.
Immunoblotting
In order to assess protein composition, equal amounts of total protein were separated on 12%, 10%, or 7.5% polyacrylamide gels (according to molecular weight of the protein) and transferred at 260 mA for 1 h onto poly(vinylidene difluoride) membrane. Membranes were blocked in the blocking buffer 5% (w/vol) non‐fat dry milk in 1 × TBST (10 × TBST: 198.2 g NaCl, 24.2 g TRIS, 20 mL Tween 20, pH = 7) for 1 h at room temperature. Next, the membranes were washed out in 1 × TBST and incubated with primary antibodies in the blocking buffer while gently shaken, overnight at 4 °C. We used the following mouse monoclonal immunoglobulin G (IgG) antibodies: P‐p66S36 (Abcam #ab54518, 1:1000), APP (Merck Millipore Cat. #MAB348, 1:1000), Akt1 #sc‐5298, Akt2 #sc‐81436, and Akt3 #sc‐134254 (Santa Cruz Biotechnology, 1:1000); mouse polyclonal antibodies: MAFbx (Santa Cruz Biotechnology #sc166806, 1:2000). Additionally, the following rabbit polyclonal IgG antibodies were used: Ferritin L (Cell Signalling Cat. #3998, 1:1000), Ferritin H (Abcam #ab65080, 1: 1000), Ferritin L (Abcam #ab69090, 1: 1000), Ferritin H (Santa Cruz Biotechnology #sc‐25617, 1:1000), P‐Akt 1/2/3 (Ser473) (Santa Cruz Biotechnology #sc‐7985R, 1:1000), Akt 1/2/3 (Santa Cruz Biotechnology #sc‐8312, 1:2000), Shc (Santa Cruz Biotechnology #sc‐1695, 1:2000), FOXO3a (Cell Signalling #2497, 1:1000), P‐Erk 1/2 (Thr202/ Tyr204) (Cell Signalling 1:1000 #4370) Erk 1/2 (Cell Signalling 1:1000 #4695), and SOD‐1 (Santa Cruz Biotechnology #sc‐11407, 1:1000). Rabbit monoclonal IgG antibodies were used: FOXO3a (Abcam Cat#53287, 1: 1000). The following antibodies were obtained from Sigma and were incubated for 1 h at room temperature with gentle shaking: monoclonal anti‐GAPDH (Cat. #G9295, 1:50 000), anti‐β‐actin (Cat. #A3854, 1:50 000), and secondary antibodies: anti‐Rabbit IgG–Peroxidase (Cat. #A9169, 1:25 000) and anti‐Mouse IgG–Peroxidase (Cat. #A9044, 1:25 000). After washing, the membranes were incubated with secondary anti‐Rabbit IgG–Peroxidase or anti‐Mouse IgG–Peroxidase conjugated antibodies. Immunoreactive bands were visualized using enhanced chemiluminescence ECL Plus (Perkin Elmer, Cat. #NEL 103001EA) and Hyper film ECL (Amersham Bioscience, Cat. #28906837). The membranes were stripped and probed using anti‐GAPDH or anti β‐actin antibody as a loading control, or in case of the phospho‐forms, re‐probed using antibodies raised against the non‐phosphorylated forms of the proteins. Changes in protein levels were assessed by densitometry of immunoreactive bands and followed by normalization relative to the GAPDH and β‐actin as a loading control or non‐phosphorylated (for phosphorylated proteins only) protein levels.
Determination of non‐haem iron concentrations
The level of non‐haem iron was taken by a colorimetry using bathophenanthroline derivative as an iron chelator (Sigma Cat. No. #1375), which is fairly a commonly used method.14
Catalase activity
Catalase activity was measured in the mixture containing 50 mM potassium phosphate, 5 mM EDTA, and 0.01% Triton at pH 7.4. The reaction was started by the addition of H2O2. The kinetics of H2O2 decomposition was followed over time at 240 nm, and catalase activity was calculated using a molar absorption coefficient 43.6 M−1cm−1.
Data analysis
Statistical analysis was performed using Statistica software package (Statistica v. 10.0, StatSoft Inc.Tulsa, OK, USA). The results were expressed as mean ± standard error. The Shapiro–Wilk test was applied to assess the normality of data distribution. The Brown–Forsythe test was used to evaluate homogeneity of variance. For homogenous data sets, a one‐way analysis of variance and the post hoc Tukey test for equal sample sizes were performed to identify significantly different means. For heterogeneous samples, the Kruskal–Wallis test and the post hoc Dunn test were used. The significance level was set as P < 0.05.
Results
Amyotrophic lateral sclerosis progression is accompanied by Akt dephosphorylation
It has been shown previously that skeletal muscle atrophy in ALS patients was associated with Akt inactivation.15 p66Shc participates in Akt inactivation or activation under the conditions of oxidative stress depending on the kind of stressor, specifically when the protein is phosphorylated at Serine 36.16 Thus, one of the goals of the study was to establish if changes in P‐p66Shc are related to the inactivation of Akt in EDL skeletal muscle from animals at three different stages of the disease. As shown in Figure 1A, there is already a small increase in p66Shc phosphorylated at serine 36 (P‐p66Shc) in the muscles from ALS I animals. The level of P‐p66Shc further increases in the muscles from ALS II and ALS III animals. As shown in Figure 1B, there was a lower level of the active form of Akt (P‐Akt Ser473) as compared with controls in the muscle from transgenic animals. A decrease in the active form of Akt was more pronounced in the muscles from ALS II and ALS III animals compared with ALS I, which correlated with the increased level of P‐p66Shc (Figure 1B).
Figure 1.
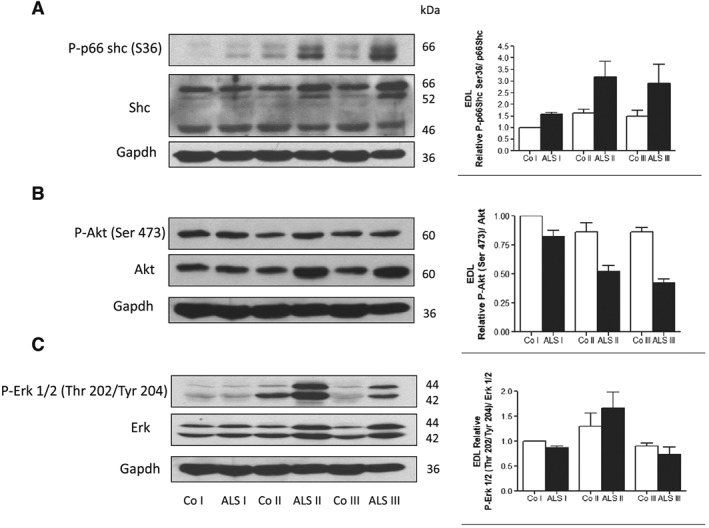
Increased p66Shc phosphorylation in extensor digitorum longus (EDL) muscle is accompanied by Akt inactivation. Representative immunoblot of (A) P‐p66Shc (Ser36) and p66Shc, (B) P‐Akt (Ser473) and Akt, and (C) P‐Erk 1/2 (Thr202/Tyr204) and Erk in EDL skeletal muscle in three stages of the disease: presymptomatic stage [amyotrophic lateral sclerosis (ALS) I], with first symptoms (ALS II) and at the terminal stage of the disease (ALS III) visualized by western blotting. Changes in all presented protein densitometry levels were normalized against GAPDH. Experiments were performed at least in six independent experiments (n = 5 rats; SOD1 G93A transgenic rats and wild‐type littermates), yielding comparable results. Bar graphs on the right panel of the figure present the mean ± SEM of six independent experiments, five animals per each studied group (SOD1 G93A transgenic rats), compared with the control group (wild‐type littermates).
Extracellular‐signal‐regulated kinases (ERK 1/2) are family members of mitogen‐activated protein kinases. The functions attributed to ERK 1/2 are as follows: modulation of cell cycle progression, senescence, cell death, and, what is worth noting, influence on protein ubiquitination.17 It has been shown that p66Shc phosphorylated at Ser36 mediates ERK 1/2 activation.18, 19 In the EDL muscle, ERK 1/2 phosphorylation increased in ALS II animals, while in ALS III group, a decrease was observed as compared with the control muscle (Figure 1C). These data indicate that modulation of ERK activity observed during progression of the disease is not strictly correlated with level of P‐p66Shc.
Amyotrophic lateral sclerosis progression is accompanied by increased activity of FOXO3a and increased level of atrogin‐1
One downstream target of the PI3K/AKT pathway is FOXO3a, which belongs to a large group of forkhead transcription factors. AKT blocks the function of FOXO3a by phosphorylation leading to its sequestration in the cytoplasm away from the target genes. One of the genes whose expression is under control of FOXO3a is atrogin‐1, which is muscle‐specific Ub‐ligase. Thus, a drop in AKT activity should lead to a decrease in FOXO3a phosphorylation and an increase in the transcriptional activity. As expected the level of the active form of FOXO3a increased in the muscle from ALS I animals as compared with control (Figure 2A). However, an increase in atrogin‐1 protein level was evident in all of the studied muscle samples from ALS I, ALS II, and ALS III animals, thus confirming an increased transcriptional activity of FOXO3a (Figure 2B). Catalase gene expression is also under control of FOXO3a. The activity of catalase was higher in TA from ALS II and ALS III muscles (Figure 2C). We have shown previously that progression of the disease was accompanied by no change in soleus (SOL) muscle mass and some decrease in TA.4 In the present study, we confirmed this observation based on EDL muscle, which is mostly built of white fibres and that is where a significant decrease of its mass was observed in ALS II and ALS III animals (Figure 2D).
Figure 2.
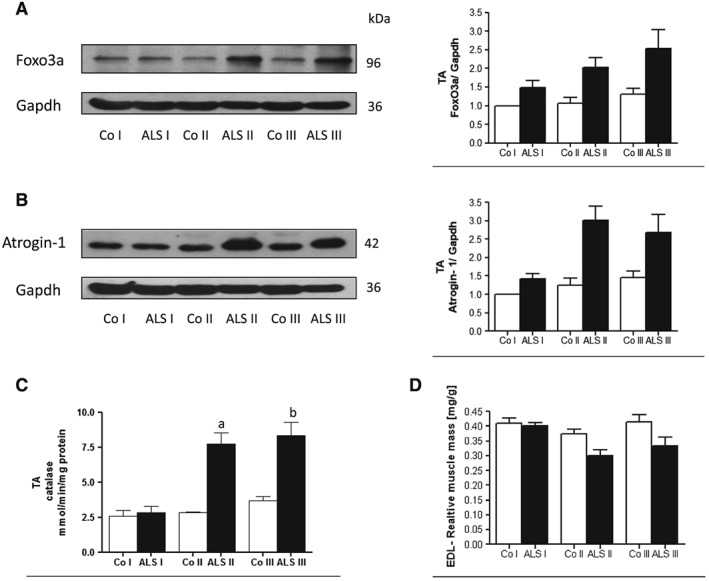
Amyotrophic lateral sclerosis (ALS) progression in tibialis anterior (TA) muscle is accompanied by increased activity of FOXO3a and increased level of atrogin‐1. Representative immunoblot of (A) FOXO3a and (B) Atrogin‐1 in TA skeletal muscle in three stages of the disease (ALS I, ALS II, and AL III) visualized by western blotting. Changes in all presented protein densitometry levels were normalized against GAPDH. Experiments were performed at least in six independent experiments (n = 5 rats; SOD1 G93A transgenic rats and wild‐type littermates), yielding comparable results. Bar graphs on the right panel of the figure present the mean ± SEM of six independent experiments, five animals per each studied group (SOD1 G93A transgenic rats), compared with the control group (wild‐type littermates). (C) ALS progression in TA muscle is accompanied by increased catalase activity. Bar graphs show an increase in catalase activity in TA muscle mass of Sprague Dawley rats bearing human mutated SOD1 gene G93A (n = 5) and non‐transgenic littermates. Bar graphs present the change in enzymatic activity as mean ± SEM. (D) Decreased muscle mass in extensor digitorum longus (EDL) is accompanied with ALS progression. Bar graphs show a decrease in EDL muscle mass of Sprague Dawley rats bearing human mutated SOD1 gene G93A (n = 15) and non‐transgenic littermates (n = 15) at three time points: presymptomatic stage (ALS I), with first symptoms (ALS II) and at the terminal stage of the disease (ALS III). The average weight of EDL muscle was expressed relative to the corresponding body weight [mg/g]. Data present results of five animals per group and are given in mg/g body weight.
Expression of G93A SOD1 influenced cellular ferritin and iron level
We have shown previously that ALS progression is accompanied by an increase in ferritin L and H and non‐haem iron in SOL and TA skeletal muscles.4 We confirmed this observation using EDL muscle. As shown in Figure 3A, ferritin L increased significantly in ALS I and remained elevated in ALS II and ALS III. Conversely, ferritin H was elevated in ALS II and further increased in ALS III. Moreover, two other proteins involved in iron metabolism were evaluated in the skeletal muscle: iron chaperon PCBP1 and APP (Figure 3C, D). The levels of PCBP1 protein significantly increased in the muscle from ALS I compared with control, while APP was elevated in ALS II and ALS III.
Figure 3.
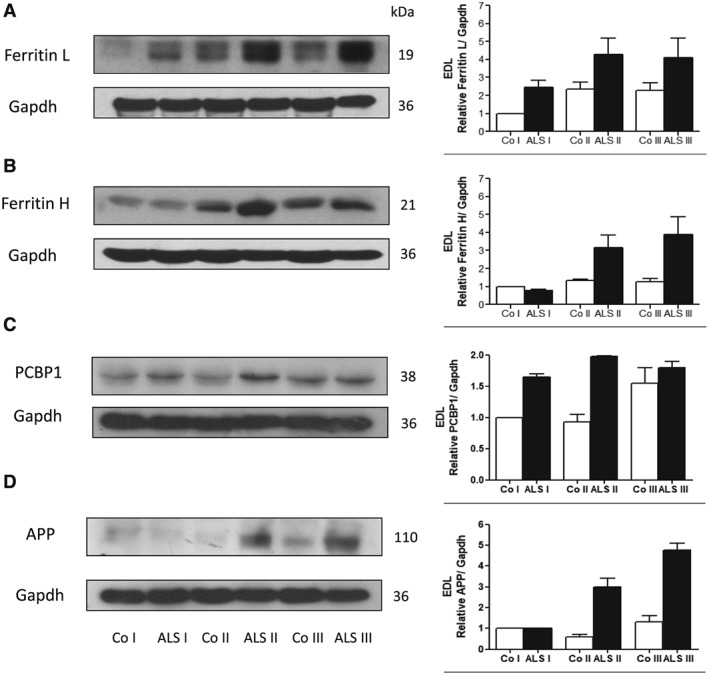
Changes in iron responsible proteins in extensor digitorum longus (EDL) skeletal muscle from transgenic rats. Representative immunoblot of (A) ferritin L, (B) ferritin H, (C) PCBP1, and (D) amyloid precursor protein (APP) in EDL skeletal muscle in three stages of the disease (ALS I, ALS II, and AL III) visualized by western blotting. Changes in all presented protein densitometry levels were normalized against GAPDH. Experiments were performed at least in seven independent experiments (n = 5 rats; SOD1 G93A transgenic rats and wild‐type littermates), yielding comparable results. Bar graphs on the right panel of the figure present the mean ± SEM of seven independent experiments, five animals per each studied group (SOD1 G93A transgenic rats), compared with the control group (wild‐type littermates).
In order to acquire an insight on the mechanism of the observed changes in iron metabolism, we performed experiments on SH‐SY5Y and C2C12 cell lines expressing G93A SOD1 or wild‐type SOD1 (Figure 4A). As shown in Figure 4A, B, SH‐SY5Y cells expressing G93A SOD1 demonstrated higher level of ferritin L and H compared with cells expressing empty vector or wild‐type SOD1. Overexpression of SOD1 is confirmed by western blot (Figure 4C). In addition, intracellular non‐haem iron determination was performed. As shown in Figure 4D, the cells expressing G93A SOD1 accumulated significantly more iron than the ones expressing wild‐type SOD1 or pcDNA3.1. In C2C12 cells expressing G93A SOD1, the changes were not so pronounced (data not shown).
Figure 4.
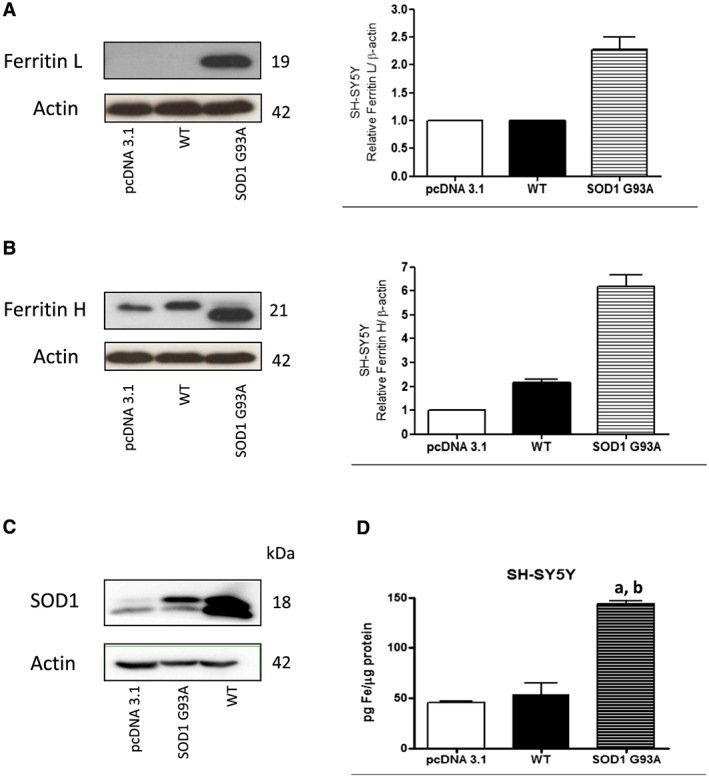
Influence of G93A hmSOD1 gene mutation on cellular level of ferritin L and H and iron in SH‐SY5Y cell line. Representative immunoblot for (A) ferritin L, (B) ferritin H, and (C) SOD1 in stable cell line SH‐SY5Y expressing pcDNA3.1, G93A SOD1, or wild‐type (WT) SOD1. Changes in ferritin L and H densitometry levels were normalized against β‐actin. Experiments were performed at least four independent times, yielding comparable results. Bar graphs on the right panel of the figure present a change in protein levels as the mean ± SEM of four independent experiments, relative to control. (D) Non‐haem iron accumulates in the cells expressing SOD1 G93A. Non‐haem iron levels in cells expressing SOD1 G93A, WT SOD1, and pcDNA3.1. Data are presented as mean ± SEM (n = 3), where a, P < 0.05 compared with the pcDNA3.1 and b, P < 0.05 compared with WT SOD1.
Akt inactivation induced changes in iron metabolism in C2C12 cells
Changes in iron metabolism in animal model of ALS have already been shown; however the mechanism of the process is not known, as yet. It has been demonstrated that insulin resistance is associated with tissue iron accumulation. Thus, we decided to test the possibility that impairment of signalling downstream the insulin receptor would induce changes in the iron metabolism. Initially, we transfected C2C12 cells with siRNA against Akt1, Akt2, and Akt3, respectively. As shown in Figure 5A, transfection led to down‐regulation of the kinases. In addition to that, down‐regulation of Akt led to an increase in the level of the active form of FOXO3a (Figure 5B). Interestingly, down‐regulation of Akt, and especially Akt2 or Akt3, led to a significant increase in ferritin L and ferritin H protein levels (Figure 5C, D).
Figure 5.
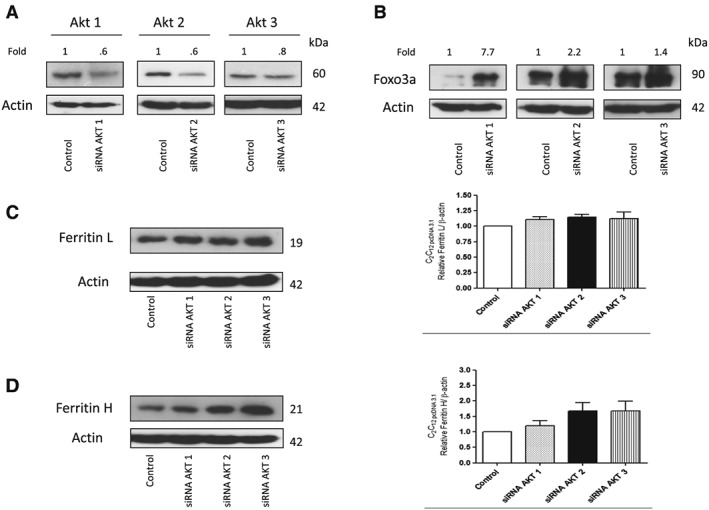
Akt inactivation induced changes in iron metabolism in C2C12 cells. Representative immunoblot for (A) Akt1, Akt2, and Akt3 and (B) FOXO3a; densitometric scanning data after correction for actin loading control are on top of Akt and FOXO3a immunoreactive bands. (C) Ferritin L and (D) ferritin H of stable cell line C2C12 expressing pcDNA3.1 transfected with siRNA against Akt1, Akt2, and Akt3, respectively. Changes in Akt1, Akt2, Akt3 and ferritin L and H densitometry levels were normalized against β‐actin. Experiments were performed at least three independent times, yielding comparable results. Bar graphs on the right panel of the figure present a change in protein levels as the mean ± SEM of eight independent experiments, relative to control.
Insulin treatment down‐regulated ferritins proteins in cells expressing G93A SOD1
To confirm the role of Akt kinases in the regulation of ferritin biosynthesis, the SH‐SY5Y cells stably expressing G93A SOD1 were treated with insulin. Interestingly, treatment with insulin significantly lowered ferritin L and H protein levels and increased P‐Akt level (Figure 6A–C). Insulin treatment also decreased ferritin L and H protein levels in the cells expressing wild‐type SOD1 (data not shown).
Figure 6.
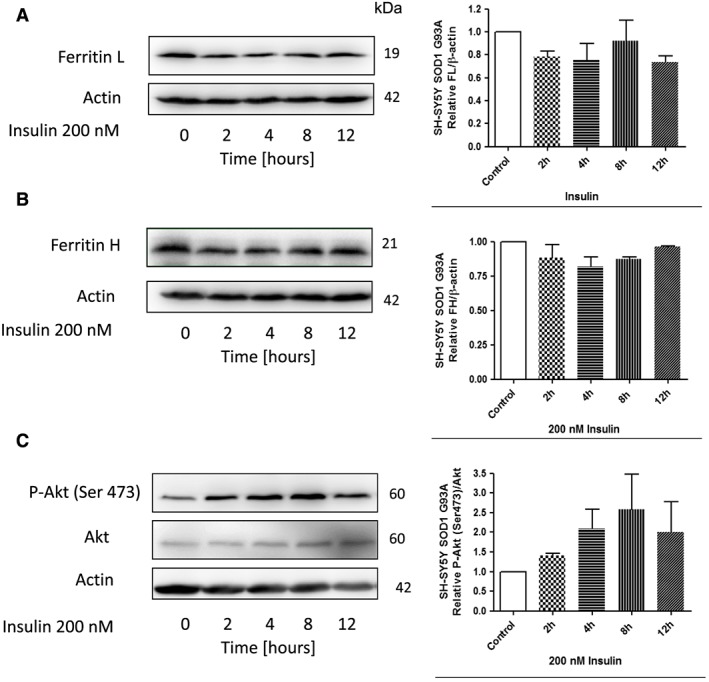
Insulin treatment down‐regulate ferritin proteins in SH‐SY5Y cells expressing G93A SOD1. Representative immunoblot for (A) ferritin L, (B) ferritin H, (C) Akt and P‐Akt (Ser473) of stable cell line SH‐SY5Y expressing G93A SOD1 following treatment with or without 200 nM insulin for the indicated time periods. Changes in all presented protein densitometry levels were normalized against β‐actin. Experiments were performed at least three independent times, yielding comparable results. Bar graphs on the right panel of the figure present a change in protein levels as the mean ± SEM of three independent experiments, relative to control.
Activation of FOXO3a leads to an increase in ferritin protein level
In order to assess the role of FOXO3a in ferritin regulation, we constructed a line of SH‐SY5Y cells that expressed a fusion protein made of FOXO3a fused at its C‐terminus to the ligand‐binding domain of the oestrogen receptor (TM‐ER). The ER portion of this fusion protein was mutated such that it specifically responded to 4OHT. The ER domain functions as a molecular switch that rapidly turns on the activity of FOXO3a protein when TM‐ER expressing cells are exposed to 4OHT. Treatment of cells with 4OHT (1 μM), led to a significant increase in ferritin L and H protein levels after 4 h (Figure 7A, B). Conversely, in cells expressing pcDNA3.1, 4OHT treatment had no significant effect on the ferritin protein level (Figure 7A, B). In addition, 4OHT treatment also increased catalase activity, which is known to be under control of FOXO3a (not shown).
Figure 7.
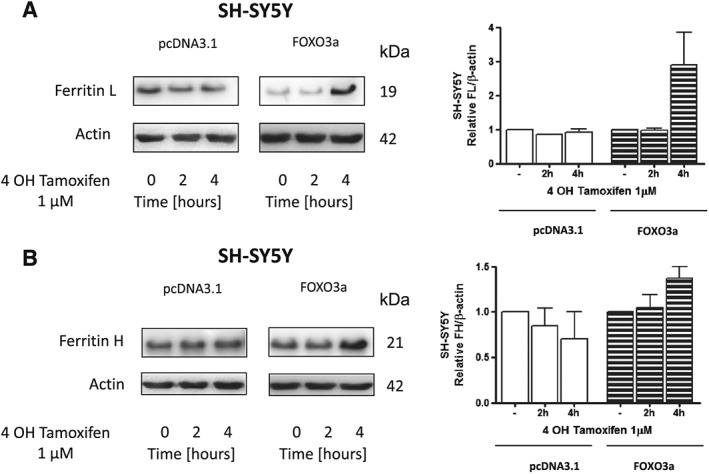
Activation of FOXO3a leads to an increase in ferritin protein level. Representative immunoblot for (A) ferritin L, (B) ferritin H of stable cell line SH‐SY5Y expressing FOXO3a or expressing pcDNA3.1 following treatment with or without 1 μM 4 OH Tamoxifen for the indicated time periods. Changes in ferritin densitometry levels were normalized against β‐actin. Experiments were performed at least three independent times, yielding comparable results. Bar graphs on the right panel of the figure present a change in protein levels as the mean ± SEM of three independent experiments, relative to control.
Discussion
In the present study, we have demonstrated for the first time that changes in Akt/FOXO3a signalling pathway lead to disturbance in iron metabolism in the skeletal muscle of transgenic animal model of ALS. These data have been confirmed on cells stably expressing SOD1 G93A, where the accumulation of ferritin and iron were observed analogously to the skeletal muscle from transgenic animals.4, 20 In order to recognize the role of Akt kinase, the cells were transfected with siRNA against Akt. Our data clearly show that in the cells with Akt down‐regulation, the level of ferritin protein increased, which confirms our observations pertaining to the skeletal muscle from transgenic animals, where a decrease in the level of P‐Akt is accompanied by a high ferritin protein level.4, 20 We consider three possible explanations for the observed changes. First of all, down‐regulation of Akt may up‐regulate ferritin by FOXO3a activation. The second possibility is that less iron can be exported by ferroportin/APP complex, and third one would suggest an increased iron import by transferrin receptor.
FOXO3a represents the mammalian counterpart of nematode DAF‐16. Previous studies have demonstrated that FOXO3a and other DAF‐16 vertebrate homologues phosphorylation by Akt result in the protein retention in the cytosol and hence, a reduction in forkhead‐dependent transcriptional activity.21 In our model, Akt is inactivated even in the muscles from ALS I animals and accompanied by decreased phosphorylation, which in turn increases activation of FOXO3a. An elevated transcriptional activity was indirectly confirmed by an increase in atrogin‐1 protein level and catalase activity in the muscle from transgenic animals, which supports our earlier observation.22 Moreover, a significant increase in FOXO3a (the active form of the transcription factor) further supported the aforementioned observations. In addition to that, cells expressing fusion protein made of FOXO3a showed an increase in ferritin L and H protein levels when activated by 4OHT. All these data strongly suggest that the ferritin protein level is under control of Akt/FOXO3a signalling pathway.
A recently published study suggests an interplay between Akt signalling pathway and APP. APP has been demonstrated to interact with ferroportin and to participate in iron export from the cells.23 In addition, PI3P kinase, which is an upstream kinase relative to Akt, stimulates APP degradation.24 Moreover, iron responding element has been identified in stem‐loops in the 5′ untranslated region of APP mRNA, and iron has been shown to stimulate APP translation.25
In the muscle from ALS animals, APP significantly increased even in the muscle from pre‐symptomatic animals. In addition to that, ferroportin also increased in the ALS muscle from transgenic animals.4 These changes can be considered as an adaptive response to an increased concentration of iron ions in the muscle. It is quite possible that an observed increase in APP and ferroportin protein was not sufficient to protect against iron accumulation and ferritin up‐regulation in the muscle. Our data on the cell culture, however, did not confirm the role of Akt in the regulation of APP expression as in the cells where Akt was down‐regulated, APP did not change significantly, while an increase in ferritin and intracellular iron was observed. Altogether, our data suggest that Akt plays an important role in iron regulation and metabolism. Kinase Akt regulates many processes like cell proliferation, apoptosis, glucose metabolism, skeletal muscle atrophy, and many others, and iron directly or indirectly can be involved in all of them.26 For example, iron is essential for DNA synthesis, oxidation processes, or may regulate cell death through ferroptosis.27 Akt activity decrease under the conditions of oxidative stress and subsequent activation of FOXO3a transcriptional factors is considered to induce an adaptive response by up‐regulation of catalase, SOD1, and other genes. Our data indicate that an increased ferritin protein level is one of the adaptive responses mediated by FOXO3a. It can be assumed that under physiological conditions, changes in Akt activity and then ferritin protein level have a transitory character, and an increase in ferritin protein level can be considered as an adaptive cellular response. For example, it has been demonstrated that overexpression of ferritin H leads to an increase in antioxidant potential of the cell and to 50% reduction of labile iron pool. Conversely, in cells overexpressing ferritin H, an iron deficient phenotype is induced, manifested by five‐fold increase of iron‐responsive element‐binding proteins (IRPs) activity, 2.5‐fold increase of transferrin receptor, and 1.8‐fold increase in iron‐transferrin uptake.28 Therefore, it is possible that increased transcriptional activity of FOXO3a, which is observed in the ALS muscle, may be responsible for an increased ferritin H level, which subsequently will lead to a rise in iron uptake by the muscle. In fact, in the skeletal muscle from transgenic animals, a significant increase in transferrin receptor was observed, which suggests an increased iron import to the muscle. Similar observations have been performed on animals where hindlimb suspension led to iron accumulation and oxidative stress generation.29 Conversely, swimming exercise has been shown to delay muscle atrophy and to increase life span in G93A transgenic mice.30 Experiments performed on cell culture and transgenic animals support this assumption. It has been demonstrated on U373 glioblastoma cell line that overexpression of SOD1 G93A leads to an increase in transferrin receptor.31 In addition, an increase in TfR1 mRNA in the cervical and thoracic regions in 12‐month‐old SOD1 G37R transgenic mice was observed.1 Thus, one can speculate that an increase in ferritin H in the long run can lead to cellular iron overload.
It is important to note that the observed changes in iron metabolism and insulin signalling are early events preceding muscle atrophy. A decrease in Akt activity, an increase in ferritin protein content, and muscle iron accumulation all take place before muscle mass has decreased. Interestingly, we observed a decrease in Akt activity and activation of atrogin‐1 in SOL and EDL; however, only EDL of G93A rats showed significant atrophy as reported by others and ourselves.4, 32
These data indicate that an increase in atrogin‐1 by itself is not sufficient to induce muscle atrophy.
Our data also indicate that a decrease in Akt activity induced changes, which allowed cells to keep the iron on the inside. What could be the biological meaning of the process is still not known. Recently, we have demonstrated that during stress condition, ferritin is degraded, and the process is mediated by stress‐activated protein kinases.6 If we consider that iron can trigger an adaptive response to stress,33 it is possible that the cell needs to accumulate certain amount of iron in order to adapt to the stress‐induced conditions.
In conclusion, our results strongly suggest that impairment of insulin/Akt signalling pathways leads to changes in iron metabolism manifested by the skeletal muscle iron accumulation (Figure 8). In addition, our data indicate that these changes precede muscle atrophy rather than being the result thereof.
Figure 8.
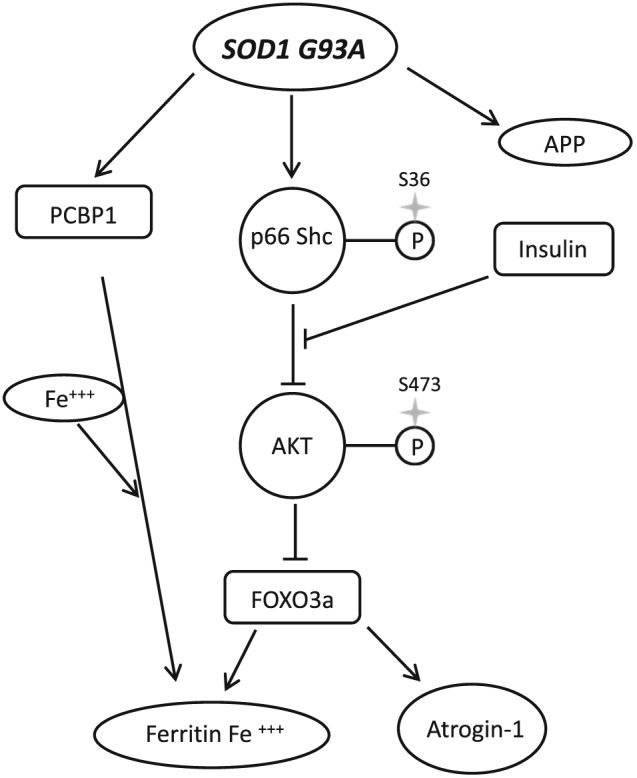
Impaired Akt signalling leads to iron accumulation. Overexpression of G93A SOD1 leads to p66Shc‐mediated Akt inactivation, FOXO3a activation, and increase level of PCBP1. FOXO3a increase ferritin gene expression what leads to increase ferritin protein level and iron accumulation, which is not overcome by increase in amyloid precursor protein (APP).
Conflict of interest
None declared.
Acknowledgements
The authors M.H‐G., A.B., J.J.K, W.Z., D.J.F., N.K., K.K., and J.A. certify that they comply with the ethical guidelines for publishing in the Journal of Cachexia, Sarcopenia and Muscle: update 201534 and declare no competing financial interests.
This study was supported by grants from the National Science Centre in Poland (2014/13/B/NZ7/02346).
Halon‐Golabek, M. , Borkowska, A. , Kaczor, J. J. , Ziolkowski, W. , Flis, D. J. , Knap, N. , Kasperuk, K. , and Antosiewicz, J. (2018) hmSOD1 gene mutation‐induced disturbance in iron metabolism is mediated by impairment of Akt signalling pathway. Journal of Cachexia, Sarcopenia and Muscle, 9: 557–569. doi: 10.1002/jcsm.12283.
References
- 1. Jeong SY, Rathore KI, Schulz K, Ponka P, Arosio P, David S. Dysregulation of iron homeostasis in the CNS contributes to disease progression in a mouse model of amyotrophic lateral sclerosis. J Neurosci 2009;29:610–619. [DOI] [PMC free article] [PubMed] [Google Scholar]
- 2. Oba H, Araki T, Ohtomo K, et al. Amyotrophic lateral sclerosis: T2 shortening in motor cortex at MR imaging. Radiology 1993;189:843–846. [DOI] [PubMed] [Google Scholar]
- 3. Kasarskis EJ, Tandon L, Lovell MA, Ehmann WD. Aluminum, calcium, and iron in the spinal cord of patients with sporadic amyotrophic lateral sclerosis using laser microprobe mass spectroscopy: a preliminary study. J Neurol Sci 1995;130:203–208. [DOI] [PubMed] [Google Scholar]
- 4. Halon M, Kaczor JJ, Ziolkowski W, et al. Changes in skeletal muscle iron metabolism outpace amyotrophic lateral sclerosis onset in transgenic rats bearing the G93A hmSOD1 gene mutation. Free Radic Res 2014;48:1363–1370. [DOI] [PubMed] [Google Scholar]
- 5. Sullivan JL. Is stored iron safe? J Lab Clin Med 2004;144:280–284. [DOI] [PubMed] [Google Scholar]
- 6. Antosiewicz J, Ziolkowski W, Kaczor JJ, Herman‐Antosiewicz A. Tumor necrosis factor‐alpha‐induced reactive oxygen species formation is mediated by JNK1‐dependent ferritin degradation and elevation of labile iron pool. Free Radic Biol Med 2007;43:265–270. [DOI] [PubMed] [Google Scholar]
- 7. Zacharski LR, Chow BK, Howes PS, et al. Decreased cancer risk after iron reduction in patients with peripheral arterial disease: results from a randomized trial. J Natl Cancer Inst 2008;100:996–1002. [DOI] [PubMed] [Google Scholar]
- 8. Honors MA, Kinzig KP. The role of insulin resistance in the development of muscle wasting during cancer cachexia. J Cachexia Sarcopenia Muscle 2012;3:5–11. [DOI] [PMC free article] [PubMed] [Google Scholar]
- 9. Steyn FJ, Ngo ST, Lee JD, et al. Impairments to the GH‐IGF‐I axis in hSOD1G93A mice give insight into possible mechanisms of GH dysregulation in patients with amyotrophic lateral sclerosis. Endocrinology 2012;153:3735–3746. [DOI] [PubMed] [Google Scholar]
- 10. Huang J, Simcox J, Mitchell TC, et al. Iron regulates glucose homeostasis in liver and muscle via AMP‐activated protein kinase in mice. FASEB J 2013;27:2845–2854. [DOI] [PMC free article] [PubMed] [Google Scholar]
- 11. Rajpathak SN, Crandall JP, Wylie‐Rosett J, Kabat GC, Rohan TE, Hu FB. The role of iron in type 2 diabetes in humans. Biochim Biophys Acta 1790;2009:671–681. [DOI] [PubMed] [Google Scholar]
- 12. Kondo H, Miura M, Kodama J, Ahmed SM, Itokawa Y. Role of iron in oxidative stress in skeletal muscle atrophied by immobilization. Pflugers Arch 1992;421:295–297. [DOI] [PubMed] [Google Scholar]
- 13. Ackerman D, Gems D. Insulin/IGF‐1 and hypoxia signaling act in concert to regulate iron homeostasis in Caenorhabditis elegans. PLoS Genet 2012;8:e1002498. [DOI] [PMC free article] [PubMed] [Google Scholar]
- 14. Grundy MA, Gorman N, Sinclair PR, Chorney MJ, Gerhard GS. High‐throughput non‐heme iron assay for animal tissues. J Biochem Biophys Methods 2004;59:195–200. [DOI] [PubMed] [Google Scholar]
- 15. Leger B, Vergani L, Soraru G, et al. Human skeletal muscle atrophy in amyotrophic lateral sclerosis reveals a reduction in Akt and an increase in atrogin‐1. FASEB J 2006;20:583–585. [DOI] [PubMed] [Google Scholar]
- 16. Nemoto S, Finkel T. Redox regulation of forkhead proteins through a p66shc‐dependent signaling pathway. Science 2002;295:2450–2452. [DOI] [PubMed] [Google Scholar]
- 17. Liu Q, Xu WG, Luo Y, et al. Cigarette smoke‐induced skeletal muscle atrophy is associated with up‐regulation of USP‐19 via p38 and ERK MAPKs. J Cell Biochem 2011;112:2307–2316. [DOI] [PubMed] [Google Scholar]
- 18. Gioeli D, Mandell JW, Petroni GR, Frierson HF Jr, Weber MJ. Activation of mitogen‐activated protein kinase associated with prostate cancer progression. Cancer Res 1999;59:279–284. [PubMed] [Google Scholar]
- 19. Borkowska A, Sielicka‐Dudzin A, Herman‐Antosiewicz A, et al. Diallyl trisulfide‐induced prostate cancer cell death is associated with Akt/PKB dephosphorylation mediated by P‐p66shc. Eur J Nutr 2012;51:817–825. [DOI] [PMC free article] [PubMed] [Google Scholar]
- 20. Halon M, Sielicka‐Dudzin A, Wozniak M, et al. Up‐regulation of ferritin ubiquitination in skeletal muscle of transgenic rats bearing the G93A hmSOD1 gene mutation. Neuromuscul Disord 2010;20:29–33. [DOI] [PubMed] [Google Scholar]
- 21. Takaishi H, Konishi H, Matsuzaki H, et al. Regulation of nuclear translocation of forkhead transcription factor AFX by protein kinase B. Proc Natl Acad Sci U S A 1999;96:11836–11841. [DOI] [PMC free article] [PubMed] [Google Scholar]
- 22. Sandri M, Sandri C, Gilbert A, et al. Foxo transcription factors induce the atrophy‐related ubiquitin ligase atrogin‐1 and cause skeletal muscle atrophy. Cell 2004;117:399–412. [DOI] [PMC free article] [PubMed] [Google Scholar]
- 23. Duce JA, Tsatsanis A, Cater MA, et al. Iron‐export ferroxidase activity of beta‐amyloid precursor protein is inhibited by zinc in Alzheimer's disease. Cell 2010;142:857–867. [DOI] [PMC free article] [PubMed] [Google Scholar]
- 24. Shineman DW, Dain AS, Kim ML, Lee VM. Constitutively active Akt inhibits trafficking of amyloid precursor protein and amyloid precursor protein metabolites through feedback inhibition of phosphoinositide 3‐kinase. Biochemistry 2009;48:3787–3794. [DOI] [PMC free article] [PubMed] [Google Scholar]
- 25. Rogers JT, Bush AI, Cho HH, et al. Iron and the translation of the amyloid precursor protein (APP) and ferritin mRNAs: riboregulation against neural oxidative damage in Alzheimer's disease. Biochem Soc Trans 2008;36:1282–1287. [DOI] [PMC free article] [PubMed] [Google Scholar]
- 26. Fanzani A, Conraads VM, Penna F, Martinet W. Molecular and cellular mechanisms of skeletal muscle atrophy: an update. J Cachexia Sarcopenia Muscle 2012;3:163–179. [DOI] [PMC free article] [PubMed] [Google Scholar]
- 27. Yu H, Guo P, Xie X, Wang Y, Chen G. Ferroptosis, a new form of cell death, and its relationships with tumourous diseases. J Cell Mol Med 2017;21:648–657. [DOI] [PMC free article] [PubMed] [Google Scholar]
- 28. Cozzi A, Corsi B, Levi S, Santambrogio P, Albertini A, Arosio P. Overexpression of wild type and mutated human ferritin H‐chain in HeLa cells: in vivo role of ferritin ferroxidase activity. J Biol Chem 2000;275:25122–25129. [DOI] [PubMed] [Google Scholar]
- 29. Xu J, Hwang JC, Lees HA, et al. Long‐term perturbation of muscle iron homeostasis following hindlimb suspension in old rats is associated with high levels of oxidative stress and impaired recovery from atrophy. Exp Gerontol 2012;47:100–108. [DOI] [PMC free article] [PubMed] [Google Scholar]
- 30. Deforges S, Branchu J, Biondi O, et al. Motoneuron survival is promoted by specific exercise in a mouse model of amyotrophic lateral sclerosis. J Physiol 2009;587:3561–3572. [DOI] [PMC free article] [PubMed] [Google Scholar]
- 31. Danzeisen R, Achsel T, Bederke U, et al. Superoxide dismutase 1 modulates expression of transferrin receptor. J Biol Inorg Chem 2006;11:489–498. [DOI] [PubMed] [Google Scholar]
- 32. Derave W, Van Den Bosch L, Lemmens G, Eijnde BO, Robberecht W, Hespel P. Skeletal muscle properties in a transgenic mouse model for amyotrophic lateral sclerosis: effects of creatine treatment. Neurobiol Dis 2003;13:264–272. [DOI] [PubMed] [Google Scholar]
- 33. Chevion M, Leibowitz S, Aye NN, et al. Heart protection by ischemic preconditioning: a novel pathway initiated by iron and mediated by ferritin. J Mol Cell Cardiol 2008;45:839–845. [DOI] [PubMed] [Google Scholar]
- 34. von Haehling S, Morley JE, Coats AJS, Anker SD. Ethical guidelines for publishing in the Journal of Cachexia, Sarcopenia and Muscle: update 2015. J Cachexia Sarcopenia Muscle 2015;6:315-316. [DOI] [PMC free article] [PubMed] [Google Scholar]


