

Abstract
Background
Muscle mass can be measured directly in vivo by isotope dilution, using Creatine‐(methyl‐d3) monohydrate (D3‐Cr) by mouth followed by measurement of the steady‐state enrichment of D3‐creatinine (D3‐Crn) in urine. Isotope dilution methods require knowledge of the amount of tracer delivered to the pool of interest. In a subset of human subjects, a small amount of orally administered D3‐Cr ‘spills’ into urine after absorption and prior to transport into skeletal muscle cells. The objectives were to develop a method to correct for spillage to compare the estimate of muscle mass by D3‐Cr dilution to other assessments of fat‐free mass.
Methods
Subjects (19 males, 23–81 years old; 20 females, 20–77 years old) ingested a single dose of 60 mg D3‐Cr and urine was collected prior to and daily for 4 days following the dose. Fasting morning urine samples was assessed for D3‐Cr, total Cr, D3‐Crn, and total Crn concentrations, as well as isotopic enrichments of D3‐Crn, by LC/MS. The 24‐h urine collections over 3 days after the dose of D3‐Cr were also performed to determine D3‐Cr spillage. Total body water, fat mass, and fat‐free mass were assessed by bioelectrical impedance spectroscopy (BIS).
Results
Spillage of D3‐Cr in the urine was greater in women than men. D3‐Crn enrichment and the ratio of Cr/Crn were used in an algorithm to calculate Cr pool size and muscle mass. Specifically, an algorithm was developed for the estimation of spillage based on the relationship between the fasting Cr/Crn ratio and the cumulative proportion of the D3‐Cr dose excreted over 3 days based on 24‐h urine collections. Muscle mass corrected using the algorithm based on fasting urine levels correlated (r = 0.9967, P < 0.0001) with that corrected by measuring D3‐Cr dose excreted. Muscle mass measured by D3‐Crn enrichment also correlated (r = 0.8579, P < 0.0001, algorithm corrected) with that measured by 24‐h Crn excretion. Muscle mass measured by D3‐Cr dilution method correlated with intracellular water by BIS, whether using spillage corrected by the algorithm (r = 0.9041, P < 0.0001) or measured by 3 day D3‐Cr losses (r = 0.91, P < 0.0001) and similarly correlated with fat‐free mass by BIA (r = 0.8857 and 0.8929, P < 0.0001, respectively).
Conclusions
The D3‐Cr dilution method is further validated here as a non‐invasive, easy‐to‐use test for measuring muscle mass. The technical issue of D3‐Cr spillage can be corrected for with a simple algorithm based on fasting spot urine samples. Muscle mass by Cr dilution potentially has broad applications in clinical and research settings.
Keywords: Muscle mass, Creatine, Creatinine, Urine, Body composition
Introduction
The accurate assessment of skeletal muscle mass in humans is important but has been problematic. The most commonly used measurements of body composition assess fat‐free mass (FFM) and fat mass, but not specifically skeletal muscle mass and include bioelectrical impedance analysis, total body water measurements, whole body plethysmography (estimate of body density), imaging [computerized tomography (CT) and magnetic resonance imaging(MRI)], and dual‐energy X‐ray absorptiometry. Because the principal component of FFM is skeletal muscle, FFM has been used as a surrogate measurement of muscle mass. While these methods may provide precise estimates of FFM (which includes extracellular body water), they do not, however, directly assess muscle mass. Changing intracellular and extracellular water volumes can add to the variability of estimates of FFM. In particular, patients with chronic diseases such as chronic heart failure, chronic obstructive pulmonary disease, chronic kidney diseases, and cancer often experience large changes in body water that are unrelated to changes in skeletal muscle mass.
More recently, a new method1, 2, 3 has been validated in rodents and humans to determine skeletal muscle mass by directly measuring total body creatine (Cr) pool size. This method measures the dilution of an oral dose of D3‐Creatine (D3‐Cr) by assessing the enrichment of D3‐creatinine (D3‐Crn), representing the ratio of administered labelled D3‐Cr to unlabeled endogenous Cr in the body, after non‐enzymatic conversion of Cr to creatinine (Crn).
The Cr dilution method is based on few assumptions but, like all dilution methods, assumes that the tracer D3‐Cr dose is absorbed and quantitatively transported into skeletal muscle cells. Intramyocellular Cr is turned over through non‐enzymatic conversion to Crn at the rate of about 1.7%/d and excreted in urine, thereby providing non‐invasive access to the intramyocellular pool of labelled (exogenous) and unlabelled (endogenous) Cr. Pre‐clinical studies by Stimpson et al.1, 2 demonstrated that in rats, the assumption of quantitative delivery of oral D3‐Cr to muscle was fulfilled, with D3‐Cr 99% bioavailable and 0.2–1.2% urinary spillage. However, the human validation study3 revealed that in some subjects, a small amount of the oral D3‐Cr dose is directly excreted (spilled) in the urine during the initial period after consumption of the dose. Young men in the study showed almost no spillage while most of the older women demonstrated some spillage (e.g.1–5% loss of administered D3‐Cr in urine).
Because the calculation of D3‐Cr dilution assumes that we know the amount of exogenous labelled Cr delivered into muscle—that is, 100% of the oral dose of D3‐Cr is transported from the blood into muscle cells after absorption from the gut—loss of label can add to variability and reduce accuracy and precision of the dilution estimate of total body Cr pool size. Clark et al.3 described a relationship between the ratio of fasting Cr/Crn concentrations in urine and the total amount of D3‐Cr spilled into urine after an oral dose, suggesting that an algorithm based on this ratio may correct for the spillage of label.
The purpose of the current study was to examine the relationship between urinary D3‐Cr excretion after an oral dose of D3‐Cr and the Cr/Crn ratio in spot fasting urine samples in the post‐absorptive state, in order to develop an algorithm that corrects for spillage of label without the need for quantitative collection of urine in the calculation of total body Cr pool size. We hypothesized that the use of an algorithm based on post‐absorptive loss of unlabeled Cr relative to unlabelled Crn will correct for spillage of labelled D3‐Cr into urine and thereby reduce variability of the method. We compared estimates of FFM by bioelectrical impedance spectroscopy (Impedimed SFB7)4 and also compared skeletal muscle mass by 24‐h urine Crn collection5 to algorithm‐corrected measurements of skeletal muscle mass by D3‐Cr dilution.
Methods
This study was performed at a single site, KineMed, Inc. (Emeryville, CA). The study protocol and informed consent form were approved by the Western Institutional Review Board and written informed consent was obtained from each subject. Recruitment was of men and women across a large range of ages (advertised eligibility as 18–100 years of age) as the study by Clark et al.3 showed little spillage of D3‐Cr among young men and greater spillage of D3‐Cr into urine in older subjects.
Each subject ingested a single 60 mg dose of D3‐Cr; all subjects consumed an ad libitum diet during this period. To insure a true fasting sample, the second void of fasting morning urine was collected prior to and for 4 days following the dose, and aliquots were stored at −20°C. In order to measure the proportion of D3‐Cr dose excreted and to measure 24‐h urine Crn excretion, all the urine excreted over a 24‐h period was collected for 3 consecutive days, the total volume for each 24‐h period was recorded, and aliquots were stored at −20°C.
Urine samples were used for measuring D3‐Cr, total Cr, D3‐Crn, and total Crn. One hundred microliter aliquots of urine were processed independently for Cr/Crn concentration and D3‐Crn enrichment. For Cr/Crn concentration determination, 100 μl of urine or standards for the standard curve was added to 100 μl internal standard and 200 μl acetonitrile. Samples were centrifuged to precipitate proteins, and aliquots of the supernatant were diluted 50‐fold using 70% acetonitrile for liquid chromatography/mass spectrometry analysis.
Samples were injected onto a Cogent Diamond Hydride column (4.0 × 75mm) using an Agilent 1260 UPLC (Agilent Technologies, Santa Clara, CA) and separated on a gradient consisting of acetonitrile with 0.1% Formic Acid (solvent A) and water with 0.1% Formic Acid (solvent B). The gradient flow rate was 0.5 mL/min and started at 30% solvent B and proceeded to 60% solvent B at 1.5 min, and continued to 95% solvent B at 5 min where it was held for one half minute before re‐equilibrating the column for 3 min. Mass spectrometry was performed on a Sciex 6500 QTRAP (AB Sciex LLC, Framingham, MA) operating in multiple reaction monitoring mode. For determining the Cr and Crn concentration from which the Cr/Crn ratio was calculated, transitions (132.1/44.1) and (114.1/44.1) were monitored. Quantitation was performed using an external standard curve using an internal standard mixture of D5 labelled Cr and Crn following transitions (137.1/47.1) and (119.1/47.1). For determining the enrichment of D3‐Crn, quantitation was performed using a standard curve for D3‐Crn and D3‐Cr enrichment that spanned from 0% to 0.168% and measured multiple reaction monitoring transitions (116.1/46.1) corresponding to the M2 peak of Crn and 117.1/47.1 which corresponds to D3‐Crn. Samples were run in duplicate and average values were reported, any sample with CVs greater than 10% were subjected to reanalysis. D3‐Crn enrichment and the ratio of Cr/Crn were used to calculate Cr pool size and muscle mass. Aliquots of 24‐h urine collections over 3 days after the oral dose of D3‐Cr were also processed to determine D3‐Cr spillage in the urine using methods described earlier. The total body Cr pool size is calculated as retained (delivered) D3‐Cr dose divided by D3‐Crn enrichment, and muscle mass is estimated from total body Cr pool size as described previously.3 Muscle mass was also estimated from average 24‐h Crn excretion over 3 days using creatinine equivalence calculations described previously (12).
Bioimpedence spectroscopy (BIS, ImpediMed SFB7, Carlsbad, CA) was used to measure total body water and provide an estimate of FFM and fat mass as described previously.4 Briefly, subjects lay in a relaxed supine position on a padded bed, arms slightly abducted from the body, forearms pronated, and legs slightly apart. Electrodes were placed on arms and legs on the same side of the body and impedance was measured using a logarithmic distribution of 256 frequencies, ranging from 4 to 1000 kHz.
Results
Subject characteristics
Thirty‐nine subjects (19 males, 23–81 years old; 20 females, 20–77 years old) enrolled and completed the study. Because of sample collection issues such as non‐fasting samples or incomplete 24‐h collections, three subjects (two males and one female) were excluded from data analysis. The detailed subject (n = 36) characteristics, body composition measurements, and muscle mass measured by D3‐Cr dilution and 24‐h Crn excretion are shown in Table 1. There was a significant gender effect, with body composition and muscle mass values being significantly lower in women compared with age‐matched men.
Table 1.
Subject characteristics, body composition, and muscle mass in female and male subjects
| Female subjects | Male subjects | |
|---|---|---|
| Number of subjects | 19 | 17 |
| Age (years), range: 20–81 years | 44 ± 16 | 51 ± 18 |
| Body weight (kg) | 61 ± 15 (*) | 84 ± 17 |
| BIS: intracellular water total body (L) | 18 ± 3 (*) | 26 ± 5 |
| BIS: total body fat‐free mass (kg) | 42 ± 7 (*) | 62 ± 10 |
| Muscle mass from D3‐Crn enrichment with spillage correction by 24 h D3‐Cr subtraction (kg) | 23 ± 4 (*) | 37 ± 10 |
| Muscle mass from D3‐Crn enrichment with spillage correction by Ln equation prediction (kg) | 23 ± 4 (*) | 37 ± 10 |
| Muscle mass from 24 h Crn collection (kg) | 22 ± 6 (*) | 37 ± 10 |
Values are means ± SD; BIS, bioimpedence spectroscopy; D3‐Crn, D3‐creatinine.
P < 0.05 female vs. male.
Spillage of D3‐Cr in the urine was directly assessed over 3 days by measuring D3‐Cr dose excreted in 24‐h urine collections. Spillage was observed in a subset of predominantly female subjects, with 12/19 female subjects spilling >1% of dose ingested and 8/19 subjects spilling >5% of dose (Figure 1A), whereas 5/17 men spilled >1% of dose and 4/17 spilled >5% of the ingested dose. There was a significant sex effect with a greater amount of spillage in women than in men (Figure 1A). However, no significant age or sex by age effect was observed (Figure 1B).
Figure 1.

Spillage of 60 mg D3‐Creatine dose measured in 24 h urine collections over 72 h in 18 female and 17 male subjects (A) and spillage of D3‐Creatine dose vs. age of subject (B) *P< 0.05 male vs. female.
An algorithm was developed for the estimation of spillage based on the relationship between the fasting Cr/Crn ratio in urine and the cumulative proportion of D3‐Cr dose excreted over 3 days directly measured in 24‐h urine collections, after transformation to the natural logarithm of these values, as shown in Figure 2. The spillage correction equation and the subsequent calculation of Cr pool size and muscle mass are as follows:
Spillage correction (mg) = (exp((1.2913 × ln(Cr/Crn ratio)) + 0.7783)) × 60;
Cr pool size (grams) = ((0.06—(spillage correction [mg]/1000) × (131.1/134.1))/percent d3‐Crn.
Total body skeletal muscle mass (kg) = Cr pool size (g)/4.3 (g/kg).
Figure 2.

Algorithm for estimation of D3‐Cr spillage from Cr/Crn ratio.
There was a very strong relationship (r = 0.9967, P < 0.0001) between muscle mass calculated by direct subtraction of spillage from 24‐h urine measurements and that calculated by using estimated spillage from the algorithm (Figure 3).
Figure 3.

Correlation between muscle mass measured by D3‐Crn enrichment, corrected for spillage either by D3‐Cr excretion or by Cr/Crn algorithm.
Muscle mass measured by the D3‐Cr dilution method was compared with estimates of lean body mass by BIS. There were significant correlations between muscle mass measured by the D3‐Cr dilution method versus intracellular water, with spillage corrected either by the algorithm (r = 0.9041, P < 0.0001, Figure 4A) or by measured 3 day D3‐Cr losses (r = 0.91, P < 0.0001, Figure 4B). Similarly, there were significant correlations between muscle mass measured by the D3‐Cr dilution method vs. FFM measured by BIS (r = 0.8857 and 0.8929, for the two correction methods, respectively, P < 0.0001, Figure 5A,B). Muscle mass measured by D3‐Crn enrichment also correlated (r = 0.8579, P < 0.0001, algorithm corrected) with that measured by 24‐h Crn excretion (Figure 6). In addition, Bland–Altman analysis was performed for the muscle mass measured by D3‐Cr dilution vs. 24‐h Crn excretion method, both of which are based on measuring Cr pool size. There was no systematic difference, with a non‐significant bias of 0.9 kg and the 95% limits of agreement from 10.53 to 12.38 kg, indicating a good agreement between the two methods.
Figure 4.

Correlation between muscle mass measured by D3‐Crn enrichment, with spillage correction either by algorithm (A) or by measured 72‐h D3‐Cr excretion (B), and intracellular water (ICW) measured by bioimpedence spectroscopy (BIS).
Figure 5.

Correlation between muscle mass measured by D3‐Crn enrichment, with spillage correction either by algorithm (A) or by measured 72‐h D3‐Cr excretion (B), and fat‐free mass measured by bioimpedence spectroscopy (BIS).
Figure 6.
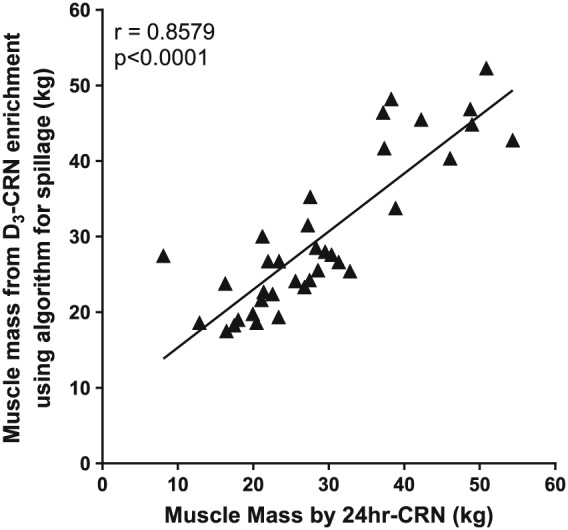
Correlation between muscle mass measured by D3‐Crn enrichment (Cr/Crn algorithm corrected) and by 24‐h Crn excretion.
Discussion
The present study confirms that some but not all men and women excrete more than 1% or 5% of an oral, tracer dose of D3‐Cr into urine over the subsequent 72 h, as we previously reported.3 We also observed here that subjects who excreted D3‐Cr into urine after ingestion of the oral 60 mg dose exhibited higher fasting ratios of unlabelled Cr/Crn in urine. This increase in urine unlabelled Cr allowed the development of a simple algorithm to correct for loss of administered D3‐Cr in urine and thereby more accurately estimate total body Cr pool size by isotope dilution.
In the post‐absorptive state, circulating Cr results from hepatic and renal biosynthesis, and in studies performed in young men and women, excretion of Cr has been reported to be negligible.6 This is explained by active transport of extracellular Cr by muscle that matches or is greater than the rate of production by liver and kidney. However, increased dietary Cr intake may increase Cr excretion in urine if the skeletal muscle uptake of Cr does not match the higher rate of appearance. Even with a large oral supplemental dose of Cr, Maganaris and Maughn7 reported recovery in urine of only 35% of a dose of 10 g/day. These data suggest that muscle has a large capacity for uptake for Cr uptake and storage, significantly greater than that of the post‐absorptive condition.
The Cr dilution method provides an estimate of total body Cr pool size,1, 2, 3 about 98% of which is found in muscle. However, the method relies on the assumption that all or a known fraction of the ingested label is incorporated into the body Cr pool. Any loss of label through excretion prior to transport into skeletal muscle therefore reduces the precision and accuracy of the estimate and could lead to overestimation of total body Cr pool size and muscle mass.
The data from the present study confirms the observation in the study by Clark et al.3 that spillage of a small oral dose of D3‐Cr (60 mg) into urine is variably observed and is different between men and women. In the previous study, young men showed no spillage with the greatest amount of spillage seen in older women. In the present study, we observed a significant sex effect with a greater amount of spillage in women than that in men (Figure 1A) but no significant age or sex by age effect was observed (Figure 1B). The cause for the sex difference in spillage is not clear, but must reflect a rate of production of Cr that exceeds the capacity for transport into muscle. Estimates of daily losses of Cr via conversion to Crn are about 14.6 and 11.7 mmol/day for young men and women, respectively, with a linear reduction in conversion rate and loss observed with advancing age, such that 70–79 years men and women lose 7.8 and 6.2 mmol/day, respectively.8 Urinary Cr present in the post‐absorptive state, in principle, reflects a chronically greater rate of synthesis than removal by transport into skeletal muscle, whereas fasting urinary Crn concentration is a reflection of the non‐enzymatic total body conversion of Cr to Crn, which occurs mostly in skeletal muscle. As a result, the fasting Cr/Crn ratio provided a possible indicator of tendency to spill D3‐Cr label into urine and an opportunity to correct the Cr dilution calculation for excreted D3‐Cr without the need for quantitative collection of urine.
We show here that using the Cr/Crn algorithm to correct for spillage significantly improves the accuracy and precision of the estimate. Figure 3 represents the relationship between measuring total Cr loss from a 24‐h urine collection after ingestion of label and estimating spillage using the algorithm. The strong and highly significant correlation of 0.9967 that fell along the line of identity is evidence that the algorithm provides an accurate estimate of loss of D3‐Cr and can, thus, be used for all subjects to improve the precision and accuracy of the estimate. This is particularly important as the spillage of D3‐Cr into urine is variable and appears to be unpredictable in an individual. As a result, any fasting sample collected in adults to determine D3‐Crn enrichment to calculate Cr pool size should also measure Cr/Crn ratio to correct for potential loss of label due to spillage. This correction does not require an additional sample or any extra effort on the part of the subject, as fasting urine is also the optimal timing for collection of samples to measure D3‐Crn enrichment, but it does add an additional analytical step.
The previous validation study by Clark et al.3 demonstrated a strong relationship along the line of unity between muscle mass determined by Cr dilution and whole body MRI, with mean values of muscle mass for both methods at approximately 40% of body weight for men (mean 44% in 19–30 year old men and 33% of body weight in 71–84 year old men by MRI, compared with 45% and 30%, respectively, by Cr dilution) and 25% of body weight for women (mean 27% for 51–62 year old women and 21% for 71–84 year old women by MRI, compared with 30% and 23%, respectively, by Cr dilution). In the present study, we report a similar relationship between estimates of muscle mass from 24‐h urine excretion of Crn and Cr dilution (r = 0.86). These findings serve as an independent support of the assumptions of the 24 h Crn collection method, specifically that there is a relatively constant and predictable rate of conversion of body Cr to Crn.5 It should be emphasized, however, that, the estimate of Cr pool size from the measurement of urinary D3‐Crn uses a single, fasting urine sample rather than requiring timed collections. Dietary Crn is not stored and is almost immediately excreted; urine collected in the post‐prandial condition will result in dilution of urine D3‐Crn that did not occur from unlabelled Cr in skeletal muscle and, as a result, an over‐estimate of Cr pool size and muscle mass. For this reason, a fasting urine sample is needed for the determination of Cr pool size from the measurement of urine D3‐Crn.3 At the present time, no algorithm exists to correct for loss of D3‐Cr in children or men and women older than 81 years.
We also demonstrated a significant relationship between the estimate of FFM by BIS and muscle mass by Cr dilution. BIS has been shown to be an estimate of total body water and has been used to measure FFM. BIA estimates of FFM are significantly associated with estimates from MRI and dual‐energy X‐ray absorptiometry.9 In the present study, the measurement of muscle mass by D3‐Cr dilution was significantly associated with the BIS estimate of FFM confirming that skeletal muscle mass is a principal but not exclusive component of FFM.
The data from this study further establishes the D3‐Cr dilution method as an easy to use and accurate assessment of whole body skeletal muscle mass. The ease of administration to subjects allows the method to be used in large clinical and cohort studies, and, potentially, as a diagnostic tool. In summary, these results further validate the D3‐Cr dilution method as a non‐invasive, easy to use test for measuring muscle mass in a wide range of subjects. The spillage of D3‐Cr into urine was found to be different between men and women and to be highly variable, but can be corrected for (in people between ages 20 and 81 years), by using the algorithm developed here. This correction algorithm does not require additional sample collection, thereby increasing the precision and accuracy of the measurement.
Conflict of interest
Although KineMed, Inc. is no longer in operation, the authors of the manuscript were employees of KineMed at the time that the study was conducted. At that time, KineMed had the exclusive license to use and develop this method for commercial development.
Acknowledgements
The authors certify that they comply with the ethical guidelines for publishing in the Journal of Cachexia, Sarcopenia, and Muscle: update 2015.10
Shankaran, M. , Czerwieniec, G. , Fessler, C. , Wong, P.‐. A. , Killion, S. , Turner, S. M. , Hellerstein, M. K. , and Evans, W. J. (2018) Dilution of oral D3‐Creatine to measure creatine pool size and estimate skeletal muscle mass: development of a correction algorithm. Journal of Cachexia, Sarcopenia and Muscle, 9: 540–546. doi: 10.1002/jcsm.12278.
References
- 1. Stimpson SA, Leonard MS, Clifton LG, Poole JC, Turner SM, Shearer TW, et al. Longitudinal changes in total body creatine pool size and skeletal muscle mass using the D3‐creatine dilution method. J Cachexia Sarcopenia Muscle 2013;4:217–223. [DOI] [PMC free article] [PubMed] [Google Scholar]
- 2. Stimpson SA, Turner SM, Clifton LG, Poole JC, Mohammed HA, Shearer TW, et al. Total‐body creatine pool size and skeletal muscle mass determination by creatine‐(methyl‐D3) dilution in rats. J Appl Physiol (1985) 2012;112:1940–1948. [DOI] [PubMed] [Google Scholar]
- 3. Clark RV, Walker AC, O'Connor‐Semmes RL, Leonard MS, Miller RR, Stimpson SA, et al. Total body skeletal muscle mass: estimation by creatine (methyl‐d3) dilution in humans. J Appl Physiol (1985) 2014;116:1605–1613. [DOI] [PMC free article] [PubMed] [Google Scholar]
- 4. Yamada Y, Watanabe Y, Ikenaga M, Yokoyama K, Yoshida T, Morimoto T, et al. Comparison of single‐or multifrequency bioelectrical impedance analysis and spectroscopy for assessment of appendicular skeletal muscle in the elderly. J Appl Physiol (1985). 2013;115:812–818. [DOI] [PubMed] [Google Scholar]
- 5. Heymsfield SB, Arteaga C, McManus C, Smith J, Moffit S. Measurement of muscle mass in humans: validity of the 24‐hour urinary creatinine method. Am J Clin Nutr 1983;37:478–494. [DOI] [PubMed] [Google Scholar]
- 6. Mudd SH, Poole JR. Labile methyl balances for normal humans on various dietary regimens. Metabolism 1975;24:721–735. [DOI] [PubMed] [Google Scholar]
- 7. Maganaris CN, Maughan RJ. Creatine supplementation enhances maximum voluntary isometric force and endurance capacity in resistance trained men. Acta Physiol Scand 1998;163:279–287. [DOI] [PubMed] [Google Scholar]
- 8. Brosnan JT, da Silva RP, Brosnan ME. The metabolic burden of creatine synthesis. Amino Acids 2011;40:1325–1331. [DOI] [PubMed] [Google Scholar]
- 9. Bosy‐Westphal A, Jensen B, Braun W, Pourhassan M, Gallagher D, Muller MJ. Quantification of whole‐body and segmental skeletal muscle mass using phase‐sensitive 8‐electrode medical bioelectrical impedance devices. Eur J Clin Nutr 2017;71:1061–1067. [DOI] [PMC free article] [PubMed] [Google Scholar]
- 10. von Haehling S, Morley JE, Coats AJS, Anker SD. Ethical guidelines for publishing in the Journal of Cachexia, Sarcopenia and Muscle: update 2015. J Cachexia Sarcopenia Muscle 2015;6:315–316. [DOI] [PMC free article] [PubMed] [Google Scholar]