

Abstract
Background
Cancer cachexia negatively impacts cancer‐related treatment options, quality of life, morbidity, and mortality, yet no established therapies exist. We investigated the anabolic properties of testosterone to limit the loss of body mass in late stage cancer patients undergoing standard of care cancer treatment.
Methods
A randomized, double‐blind, placebo‐controlled phase II clinical trial was undertaken to assess the potential therapeutic role of adjunct testosterone to limit loss of body mass in patients with squamous cell carcinoma of the cervix or head and neck undergoing standard of care treatment including chemotherapy and chemoradiation. Patients were randomly assigned in blocks to receive weekly injections of either 100 mg testosterone enanthate or placebo for 7 weeks. The primary outcome was per cent change in lean body mass, and secondary outcomes included assessment of quality of life, tests of physical performance, muscle strength, daily activity levels, resting energy expenditure, nutritional intake, and overall survival.
Results
A total of 28 patients were enrolled, 22 patients were studied to completion, and 21 patients were included in the final analysis (12 placebo, nine testosterone). Adjunct testosterone increased lean body mass by 3.2% (95% confidence interval [CI], 0–7%) whereas those receiving placebo lost 3.3% (95% CI, −7% to 1%, P = 0.015). Although testosterone patients maintained more favourable body condition, sustained daily activity levels, and showed meaningful improvements in quality of life and physical performance, overall survival was similar in both treatment groups.
Conclusions
In patients with advanced cancer undergoing the early phase of standard of care therapy, adjunct testosterone improved lean body mass and was also associated with increased quality of life, and physical activity compared with placebo.
Keywords: Testosterone, Cachexia, Cancer, Muscle, Quality of life, Female
Introduction
Cancer cachexia is a tumour‐induced, progressively debilitating loss of skeletal muscle, with or without a concurrent loss of fat, experienced by many late‐stage cancer patients.1 This degenerative body condition results from an energy imbalance associated with various combinations of decreased nutritional intake (e.g. anorexia, decreased appetite, and physical barriers to feeding) and metabolic disruption (e.g. hypermetabolism due to tumour load and/or systemic inflammation). Cachexia contributes to cancer‐related morbidity and mortality, reducing quality of life and cancer treatment options.2, 3, 4, 5 Consequently, indices of body composition such as body mass index (BMI) and weight loss are good predictors of patient prognosis and survival.6 Despite the impact on patient quality of life and treatment outcomes, weight loss is seldom monitored or managed over the course of cancer treatment.1 Although anorexia can contribute to weight loss in cancer patients, nutritional intervention alone is often inadequate to fully reverse declining body condition.7 Oncologists and nutritionists treating cachectic cancer patients seek to improve treatment options,8 and multimodal interventions that include stimulating anabolic pathways may provide a palliative intervention.9, 10, 11
Primary and secondary hypogonadism is appreciated as a complication in male cancer patients with implications on body composition, survival, and quality of life. Testosterone therapy has been proposed as potentially beneficial in some populations of cancer patients.9, 12, 13 Therapeutic testosterone replacement has been assessed to treat fatigue in hypogonadal male cancer patients14; however, it has not been thoroughly tested to manage loss of lean body mass in cancer patients. Our lab has demonstrated that women have a similar anabolic skeletal muscle response to testosterone administration as men,15 and testosterone therapy along with supplemental amino acids successfully increased lean mass during standard of care treatment in a patient with recurrent cervical cancer.10 In this randomized, double‐blind, placebo‐controlled phase II clinical trial, we sought to determine if the anabolic effects of testosterone supplementation could prevent or reverse the loss of skeletal muscle in men and women with late‐stage squamous cell carcinoma of the cervix or head and neck.
Materials and methods
Study design
This study was conducted in accordance with the principles of the Declaration of Helsinki and approved by the Institutional Review Board at the University of Texas Medical Branch. Written informed consent was obtained from all patients prior to participation. The primary endpoint was the per cent change in lean body mass over 7 weeks of testosterone therapy in cervical and head and neck cancer patients with advanced or recurrent squamous cell carcinoma staged by their treating oncologist. Preliminary data from our lab indicated that following 3 months of testosterone therapy, subjects gained on average 2 kg of lean body mass with a standard deviation of 1 kg while the placebo group had no net change. Based on these data, power analysis for a two‐sided t‐test indicated a sample size of 12 patients per group would provide >0.99 power to detect changes in lean body mass, with as few as six patients per group providing power >0.87.
Because of the infirmed study population, it was not possible to maintain a strictly regimented study schedule without interfering with patient treatment. Despite flexibility around patient treatment schedules, average study duration and testing schedules were similar between groups. Study duration averaged 47.8 ± 9.6 days in the placebo group and 47.0 ± 7.7 days in the testosterone group. Mid‐treatment measures were taken on average within 3.9 ± 3.3 days of the study midpoint, and all post‐treatment measures were taken within 8 days of the final injection. A per‐protocol pairwise deletion was used to incorporate only patients with complete pre‐treatment and post‐treatment datasets for paired sample analysis. Survival was monitored for 1 year following the end of the study, and Kaplan–Meier survival curves were assessed using GraphPad Prism 6.07 (GraphPad Software, Inc., San Diego, CA, USA). Statistical comparisons between groups were made using unequal variance t‐tests, and paired sample t‐tests were used to compare pre‐treatment and post‐treatment measures. A P < 0.05 was considered statistically significant.
Patients were considered for participation in this study if they had advanced or recurrent squamous cell carcinoma of the cervix (stages IIB, IIIA, and IIIB) and were between the ages of 18 and 65, or if they had advanced (stage III or IV) or recurrent head and neck squamous cell carcinoma and were between the ages of 18 and 75. In addition, patients were required to have lost at least 5% of body mass over the past 12 months,16 and to be ambulatory with some activity (Eastern Cooperative Oncology Group score of 0 or 1).17 Patients were deemed eligible to sign consent for study participation by scoring >23 points on the 30 point Mini Mental State Examination.18 We screened 28 patients of mixed age, race, and gender with either cervical or head and neck cancer to participate in this study (http://clinicaltrials.gov number NCT00878995) (Figure 1).
Figure 1.

History of study participation from screening through analysis for patients with cervical (C) or head and neck (H/N) cancer. In this double‐blind study, cancer patients were randomly assigned to receive weekly doses of testosterone (T) or placebo (P) for 7 weeks. Blood chemistry was monitored for safety, and hormone levels tested regularly. Nutritional intake and activity was monitored throughout. Patients with pre and post‐treatment measurements were analysed for body composition (dual‐energy X‐ray absorptiometry), resting energy expenditure (REE), physical performance (Biodex and Short Physical Performance Battery), and quality of life questionnaires (General Functional Assessment of Cancer Therapy).
Of the 28 screened patients, 24 signed consent and were randomized in blocks of 3 by the institutional pharmacy to receive weekly injections of either 100 mg of testosterone enanthate (n = 10) or placebo (n = 14). Two patients stopped participating mid‐study and were lost to follow‐up. In addition, one patient in the testosterone group had multiple primary tumours and was removed from analysis.
All study data were collected at the Institute for Translational Sciences Clinical Research Center at the University of Texas Medical Branch in Galveston, TX. Researchers had no input or restrictions on standard of care patient therapy including chemotherapy and radiation.
Testosterone treatment
A testosterone replacement paradigm commonly used to treat hypogonadal men was chosen to include weekly im injections of either 100 mg testosterone enanthate or placebo (sterile saline) over a period of 7 weeks. Testosterone and placebo injections were given by a nurse using an opaque syringe to obscure visual differences between testosterone and placebo. Because of the late stages of cancer examined in this study, we elected to treat both men and women with the same dose of testosterone as this dose and duration would not be expected to affect female secondary sexual characteristics.
Blood chemistry
Laboratory reports from blood drawn as part of patient standard of care were used to monitor blood haemoglobin concentration (Hb), total haematocrit (HCT), total cholesterol, high‐density lipoprotein (HDL), low‐density lipoprotein (LDL), C‐reactive protein, and thyroid‐stimulating hormone (TSH). Average pre‐treatment and post‐treatment values for placebo and testosterone groups are reported. Blood levels of testosterone, free testosterone, and sex hormone‐binding globulin (SHBG) were measured pre‐treatment, mid‐treatment, and post‐treatment. Because of sex‐related differences in these values, blood levels were assessed separately for men and women, resulting in four separate groups (i.e. female placebo, male placebo, female testosterone, and male testosterone). Average pre‐treatment values were compared between combined groups (men and women) and between treatment groups within each sex using unequal variance t‐tests. Because the treatment level of testosterone, free testosterone, and SHBG are directly affected by treatment, each patient's mid‐treatment and post‐treatment levels were combined to determine an average on‐treatment level. Average treatment levels were compared with pre‐treatment levels within each group to assess changes in hormone levels using paired sample t‐tests. Two of the six women in the testosterone group were not included in the analysis of free testosterone and SHBG because pre‐treatment values were not available. An additional two women in the testosterone group had only a single treatment measure of SHBG to determine average treatment level.
Body composition
Primary measures of lean mass, along with secondary measures of total body mass, fat mass, and bone mineral content, were assessed at pre‐treatment, mid‐treatment, and post‐treatment time points by dual‐energy X‐ray absorptiometry (DXA) scans using a GE Lunar iDXA (GE Healthcare; Chicago, IL, USA). BMI was calculated from total body mass and patient height. Pre‐treatment and post‐treatment DXA data were collected for all 12 placebo and nine testosterone patients; however, mid‐treatment scans were missing for one testosterone patient. Mid‐treatment values are depicted graphically but not included in statistical analysis. Average pre‐treatment DXA measures for placebo and testosterone groups were compared using unequal variance t‐tests. Paired sample t‐tests were used to determine significance of change from pre‐treatment values to post‐treatment time points within each group. The post‐treatment per cent change from baseline was determined for each patient, and the average per cent change in the placebo and testosterone groups was compared using unequal variance t‐tests.
Dynamic muscle strength
A Biodex System 4 Pro dynamometer (Biodex Medical Systems; Shirley, NY, USA) was used to assess pre‐treatment and post‐treatment peak leg extension torque and power for seven placebo and eight testosterone patients. Mid‐treatment measures were not available for two of the eight testosterone patients. Patients completed a warm‐up set of 30 leg extensions at a maximum angular velocity of 500°/s (chosen to minimize resistance during the warm‐up). Following the warm‐up period, peak isometric torque was measured during three sets of three sustained contractions of 5 s each against a fixed angle of 90°. The three sets were conducted at a patient‐determined 25% (set 1), 50% (set 2), and 100% (set 3) effort with a rest period of 15 s between sets. Following a rest period of 2 min, peak isokinetic power was similarly measured over three sets of three repetitions at an angular velocity of 90°/s, with sets at 25% (set 1), 50% (set 2), and 100% (set 3) of maximal patient‐determined effort, with repetitions within each set occurring approximately once every 5 s and a rest period of 15 s between each set. Average pre‐treatment peak power and peak torque measures for the placebo and testosterone groups were compared using unequal variance t‐tests. Mid‐treatment values are depicted graphically but not included in the statistical analysis. The per cent change for each patient over the duration of the study was compared in the placebo and testosterone groups using unequal variance t‐tests. Paired sample t‐tests were used to determine significance of change from pre‐treatment to post‐treatment time points for each group.
Physical performance
A Short Physical Performance Battery (SPPB)19 was performed at pre‐treatment and post‐treatment time points on eight placebo and five testosterone patients to assess functional measures of physical ability including balance, gait speed, and the ability to rise unassisted from a chair. Component subtests were scored based on performance and combined for an overall test score. Post‐treatment change from baseline score was determined for the total SPPB score and each subtest. A change in overall SPPB score of one point or greater was considered meaningful.19, 20, 21
Quality of life
The General Functional Assessment of Cancer Therapy (FACT‐G) questionnaire (version 4) (http://www.facit.org) was used to assess physical well‐being (PWB), social/family well‐being (SFWB), emotional well‐being (EWB), and functional well‐being (FWB) of patients at pre‐treatment and post‐treatment time points.22 Each of the 27 questions in this survey are scored on a scale of 0 to 4 and corrected so that a higher score indicates a more favourable response, for a maximum of 108 points. As established in the FACIT guidelines, the FACT‐G score was included in analysis if >80% of questions were answered in the questionnaire. Eight patients in the placebo group and eight patients in the testosterone group met the minimum requirements for both pre‐treatment and post‐treatment time points. The post‐treatment change from baseline scores was determined for the total FACT‐G score, as well as each of the four subtests, and the trial outcome index (TOI; sum of physical and function well‐being subtest scores).22 We used previously established minimal important difference (MID) criteria to determine meaningful clinical change within each group for total FACT‐G (−8.3 decrease; +4.4 increase), PWB (−2.2 decrease; +1.4 increase), SFWB (−2.9 decrease; +1.9 increase), EWB (−0.7 decrease; +0.5 increase), and FWB (−4.2 decrease; +1.4 increase) scores.23 The MID for the TOI was established by the sum of the constituent subtest MIDs (−6.4 decrease; +2.8 increase).
Resting energy expenditure and nutrition
Resting energy expenditure was measured (mREE) according to best‐practice recommendations24 at pre‐treatment and post‐treatment time points using indirect calorimetry for 10 placebo and eight testosterone patients. Following overnight fasting, patients were asked to rest quietly for 15 min in bed. A Vmax Encore 29 metabolic cart (Carefusion, San Diego, CA, USA), calibrated prior to data collection, was used to monitor oxygen consumption (VO2) and carbon dioxide production (VCO2) for 25 min while the patients rested in bed under a gas collection canopy. Values over the final 20 min of breath collection were averaged to calculate mREE using Weir's equation.25 Pre‐treatment mREE was compared between groups using unequal variance t‐tests and changes over the course of the study were assessed within each group using paired t‐tests. Predicted REE (pREE) was also determined using the Harris–Benedict equations26 based on each patient's pre‐treatment weight, age, height, and gender. Patients were considered hypometabolic if pre‐treatment REE was <90% of predicted, and hypermetabolic if pre‐treatment REE was more than 110% of predicted.27 Paired t‐tests were used to compare mREE with pREE.
Patients were asked to keep a self‐reported dietary record (SDR) of daily nutritional intake throughout the study. When patients were housed within the Clinical Research Center at UTMB, detailed daily hospital dietary records (HDR) charted the mass and caloric value of all food consumed. Nutritional intake was determined based on serving size and per‐item nutritional information using Nutrition Data System for Research software (versions 2009–2014), developed by the Nutrition Coordinating Center, University of Minnesota, Minneapolis, MN, USA. SDR were included in the analysis if the patient reported not eating or recorded at least one consumption event for the day. Days that included HDR that were known to be incomplete (i.e. days when patient was discharged, admitted, or left hospital observation) were not included in nutritional data analysis unless SDR completed the record for that day. For days with both SDR and HDR, these two sources were combined with preference of overlapping records given to HDR to provide a complete record for that day. Patients with at least 10 days of complete dietary intake records were included in the nutritional analysis, resulting in nine placebo patients averaging 26.6 days of records and seven testosterone patients averaging 30.4 days of records. The average daily energy intake for each patient was determined from all qualifying records throughout the study period.
The combination of both REE and nutritional information was available for nine placebo and seven testosterone patients allowing an assessment of the relationship between energy consumption and REE. Energy balance was calculated for each patient as
to determine the average percentage of the REE consumed daily for each group.
Activity
Patients were asked to wear an ActiGraph 3 axis accelerometry monitor (ActiGraph GT1M or GT3X; ActiGraph, LLC; Pensacola, FL, USA) on their waist throughout the 7 week study (removed only for bathing) to monitor the duration and intensity of daily activity. Activity data were recorded in 1 min epochs and assessed using ActiLife software version 6.8.2 (ActiGraph, LLC: Pensacola, FL, USA). A pre‐set ActiLife software algorithm (Troiano, 2007)28 was used to establish wear time. Similarly, default software settings (Freedson Adult, 1998)29 were used to classify accelerometer‐determined activity counts per minute (CPM) into four categories29: sedentary (0–99 CPM), light activity (100–1951 CPM), moderate activity (1952–5724 CPM), and vigorous activity (5725–9498 CPM). The average per cent of time spent in each activity category per week was determined for the placebo and testosterone groups over the 7 week study period for comparison. Only days with at least 40% wear time were included in the analysis, consistent with thresholds used in healthy populations30, 31, 32 as well as in other populations of cancer patients.33, 34, 35 Valid wear days in each week with ≥1 valid wear day were used to calculate weekly mean values.32 Patient compliance for wearing activity monitors was not complete and decreased over the duration of the study. Two placebo and three testosterone patients did not have any time points that met the minimum criteria and were excluded. The total number of placebo and testosterone patients analysed for each time point is listed below the x axis in Figure 6.
Figure 6.

Average weekly activity budget over a 7 week study period for head and neck or cervical cancer patients receiving weekly placebo (A) or testosterone (B) injections. Activity was monitored by patient worn accelerometers and categorized by the per cent of total time spent in activity categories of sedentary, light activity, moderate activity, and vigorous activity. The number and per cent of total placebo (n = 12) and testosterone (n = 9) patients that met the minimum threshold of wearing the activity monitor at least 40% of the time for each week are listed below the axis. Vigorous activity averaged <0.5% of weekly activity at all time points and is therefore not discernable in these figures.
Adverse events
Adverse events were defined as events recorded in the medical records that were not part of the patient's routine care (e.g. placement and maintenance of percutaneous endoscopic gastrostomy (PEG) tube, intravenous fluids, and brachytherapy). Fever associated with known infection was not listed as a separate adverse event; however, fever not associated with a secondary diagnosis (e.g. urinary tract infection, and pneumonia) was listed separately. Anaemia was not considered an adverse event as it routinely occurs in cancer care and was anticipated.
Results
Overall survival
Baseline demographics were similar between the two groups, with no significant differences (Table 1). Kaplan–Meier survival curves were not different between the two groups (P = 0.96) with 1 year post‐study survival of 56% for testosterone and 58% for placebo patients (Figure 2).
Table 1.
Demographics of cervical or head and neck cancer patients receiving weekly injections of testosterone or placebo for 7 weeks
| Total | Placebo | Testosterone | P | |
|---|---|---|---|---|
| (N = 21) | (N = 12) | (N = 9) | ||
| Age | 0.303 | |||
| Mean ± SD | 50.7 ± 10.5 | 48.7 ± 12.3 | 53.2 ± 8.0 | |
| Range | 33–71 | 33–71 | 35–61 | |
| Body mass (initial) | 0.310 | |||
| Mean ± SD | 65.2 ± 22.3 | 69.4 ± 24.3 | 59.6 ± 19.0 | |
| Range | 40.5–130.6 | 45.0–130.6 | 40.5–99.1 | |
| BMI (initial) | 0.420 | |||
| Mean ± SD | 22.7 ± 6.7 | 23.7 ± 6.6 | 21.3 ± 6.9 | |
| Range | 14.5–40.3 | 16.3–40.3 | 14.5–37.6 | |
| Days in study | 0.844 | |||
| Mean ± SD | 47.4 ± 8.6 | 47.8 ± 9.6 | 47.0 ± 7.7 | |
| Injections (testosterone or placebo) | 0.489 | |||
| Mean ± SD | 7.0 ± 0.9 | 7.2 ± 0.8 | 6.9 ± 0.9 | |
| Sex—no. (%) | 0.387 | |||
| Male | 10 (47.6) | 7 (58.3) | 3 (33.3) | |
| Female | 11 (52.4) | 5 (41.7) | 6 (66.6) | |
| Race—no. (%) | 0.603 | |||
| White | 16 (76.2) | 8 (66.7) | 8 (88.9) | |
| Black | 3 (14.3) | 2 (16.7) | 1 (11.1) | |
| Hispanic | 2 (9.5) | 2 (16.7) | 0 (0.0) | |
| Tumour stage—no. (%) | 0.769 | |||
| IIB | 2 (9.5) | 0 (0.0) | 2 (22.2) | |
| III | 1 (4.8) | 1 (8.3) | 0 (0.0) | |
| IIIB | 5 (23.8) | 3 (25.0) | 2 (22.2) | |
| IV | 1 (4.8) | 1 (8.3) | 0 (0.0) | |
| IVA | 9 (42.9) | 5 (41.7) | 4 (44.4) | |
| IVB | 3 (14.3) | 2 (16.7) | 1 (11.1) | |
| Cancer type—no. (%) | 1.000 | |||
| Cervical | 9 (42.9) | 5 (41.7) | 4 (44.4) | |
| Head/neck | 12 (57.1) | 7 (58.3) | 5 (55.6) | |
| PEG feeding tube—no. (%) | 0.396 | |||
| 9 (42.9) | 4 (33.3) | 5 (55.6) | ||
| Chemotherapy—no. subjects receiving chemotherapy (%) | ||||
| Cisplatin | 14 (66.7) | 7 (58.3) | 7 (77.8) | |
| Topotecan | 1 (4.8) | 1 (8.3) | 0 (0.0) | |
| Paclitaxel | 2 (9.5) | 2 (16.7) | 0 (0.0) | |
| Any | 15 (71.4) | 8 (66.7) | 7 (77.8) | 0.659 |
| Radiation—no. subjects receiving radiation (%) | 1.000 | |||
| 19 (90.5) | 11 (91.7) | 8 (88.9) | ||
| Glucocorticoids—ave. no. days treated (ave. total mg. administered)a | (0.489) | |||
| Oral | 6.2 (51.1) | 6.8 (70.3) | 5.3 (25.3) | |
| IV | 2.0 (32.9) | 1.7 (26.7) | 2.4 (41.1) | |
| Total | 8.2 (83.9) | 8.5 (97.0) | 7.8 (66.4) | |
| One year survival—no. (%) | 0.960 | |||
| 12 (57.1) | 7 (58.3) | 5 (55.6) | ||
| Adverse events—no. of events (% of patients)b | ||||
| Anaemia | 15 (38.1) | 9 (41.7) | 6 (33.3) | |
| Nausea/vomiting | 1 (4.8) | 1 (8.3) | 0 (0) | |
| Duodenal ulcer | 1 (4.8) | 1 (8.3) | 0 (0) | |
| Fever | 2 (9.5) | 2 (16.7) | 0 (0) | |
| Stroke | 1 (4.8) | 1 (8.3) | 0 (0) | |
| Anaphylaxis | 1 (4.8) | 1 (8.3) | 0 (0) | |
| Neutropenic fever | 1 (4.8) | 0 (0) | 1 (11.1) | |
| Pneumonia | 2 (9.5) | 0 (0) | 2 (22.2) | |
| Urinary tract infection | 7 (28.6) | 5 (33.3) | 2 (22.2) | |
| Thrombocytosis | 1 (4.8) | 1 (8.3) | 0 (0) | |
| Altered mental status | 1 (4.8) | 1 (8.3) | 0 (0) | |
| Metastatic bowel obstruction | 1 (4.8) | 1 (8.3) | 0 (0) | |
| Hyponatremia | 1 (4.8) | 1 (8.3) | 0 (0) | |
| DVT | 1 (4.8) | 1 (8.3) | 0 (0) | |
| Vesicovaginal fistula | 1 (4.8) | 1 (8.3) | 0 (0) | |
| Syncope | 1 (4.8) | 0 (0) | 1 (11.1) | |
| Anyc | 13 (61.9) | 7 (58.3) | 6 (66.7) | 1.000 |
Glucocorticoid dose listed as dexamethasone equivalents.
Some patients had multiple occurrences of the same adverse event. This number represents the total per cent of patients and not occurrences.
No. of patients experiencing any adverse event.
Figure 2.
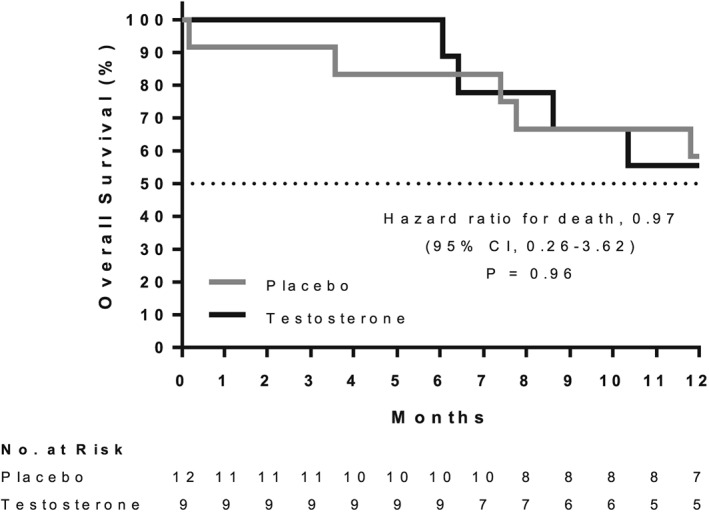
Overall survival of cervical or head and neck cancer patients for one year following 7 weeks of testosterone or placebo treatment (no patient data was censored before 12 months).
Blood chemistry
Average pre‐treatment and post‐treatment blood chemistry levels are listed in Table 2. Five of the 10 men in the study had baseline testosterone levels below 300 ng/dL, and nine of the 11 women were below 30 ng/dL (Figure 3A). There was a significant difference between men and women in pre‐treatment levels of testosterone (P < 0.001) (Figure 3B), and free testosterone (P < 0.001) (Figure 3C). Pre‐treatment levels of SHBG were highly variable and not significantly different between men and women (P = 0.12) (Figure 3D). Testosterone administration resulted in increased average levels of testosterone in men (P = 0.011) and women (P < 0.001), as well as increased free testosterone in the men (P = 0.011) and women (P = 0.019), but SHBG did not change significantly in men (P = 0.10) or women (P = 0.84) (Figure 3B–3D).
Table 2.
Average (±SD) levels of haemoglobin, haematocrit, cholesterol, high‐density lipoprotein, low‐density lipoprotein, C‐reactive protein, and thyroid‐stimulating hormone in head and neck and cervical patients before and after receiving 7 weeks of treatment with testosterone or placebo
| Placebo | Testosterone | |||||
|---|---|---|---|---|---|---|
| Pre‐treatment | Post‐treatment | P | Pre‐treatment | Post‐treatment | P | |
| Testosterone (ng/dL)a | ||||||
| Male | 323.9 ± 191.3 | 318.4 ± 177.3 | 0.908 | 281.0 ± 156.5 | 889.7 ± 104.3 | 0.011 |
| Female | 25.4 ± 34.5 | 19.0 ± 14.5 | 0.573 | 16.8 ± 15.6 | 606.5 ± 184.3 | <0.001 |
| Free testosterone (pg/mL)a | ||||||
| Male | 63.1 ± 41.8 | 48.7 ± 31.6 | 0.116 | 55.0 ± 30.8 | 133.0 ± 38.2 | 0.011 |
| Female | 3.7 ± 5.2 | 2.0 ± 1.6 | 0.397 | 1.9 ± 0.9 | 79.1 ± 43.0 | 0.019 |
| SHBG (nmol/L)a | ||||||
| Male | 42.3 ± 39.9 | 60.8 ± 53.1 | 0.032 | 29.7 ± 11.2 | 61.7 ± 24.7 | 0.103 |
| Female | 47.2 ± 12.7 | 80.3 ± 40.4 | 0.137 | 79.25 ± 34.0 | 73.25 ± 43.0 | 0.836 |
| Hb (g/dL) | ||||||
| Male | 10.8 ± 1.6 | 10.8 ± 1.0 | 0.962 | 11.6 ± 1.5 | 10.5 ± 0.7 | INS |
| Female | 9.4 ± 1.0 | 9.4 ± 1.0 | 0.951 | 10.4 ± 0.4 | 9.4 ± 0.7 | 0.066 |
| HCT (%) | ||||||
| Male | 33.2 ± 3.8 | 32.4 ± 1.7 | 0.741 | 35.1 ± 1.8 | 32.0 ± 2.3 | INS |
| Female | 29.3 ± 3.0 | 28.5 ± 2.8 | 0.350 | 31.1 ± 1.6 | 28.1 ± 1.5 | 0.209 |
| Cholesterol (mg/dL) | 139.9 ± 32.1 | 155.0 ± 28.6 | 0.092 | 175.0 ± 33.9 | 151.1 ± 46.4 | 0.179 |
| HDL (mg/dL) | 39.1 ± 16.5 | 43.2 ± 11.9 | 0.573 | 45.0 ± 13.0 | 41.2 ± 12.7 | 0.339 |
| LDL (mg/dL) | 76.0 ± 27.0 | 88.1 ± 20.7 | 0.010 | 106.9 ± 26.1 | 86.7 ± 37.0 | 0.133 |
| C‐reactive protein (mg/dL) | 7.2 ± 8.7 | 4.3 ± 5.4 | 0.623 | 6.7 ± 7.6 | 4.8 ± 7.9 | 0.973 |
| TSH (μIU/mL) | 2.1 ± 2.0 | 1.1 ± 1.1 | 0.143 | 2.1 ± 2.2 | 1.8 ± 2.1 | 0.135 |
Post‐treatment levels of testosterone, free testosterone, and sex hormone‐binding globulin (SHBG) are an average of mid and post‐treatment values.
INS means insufficient subgroup sample size for this measure.
Hb, haemoglobin; HCT, haematocrit; HDL, high‐density lipoprotein; LDL, low‐density lipoprotein; TSH, thyroid‐stimulating hormone.
Figure 3.

Baseline blood testosterone levels (A) for cervical and head and neck cancer patients. Horizontal line depicts a threshold of 300 ng/dL for men36 and 30 ng/dL for women.37 Average blood levels (±SD) of testosterone (B), free testosterone (C), and sex hormone‐binding globulin (D) for patients with head and neck or cervical cancer before and during 7 weeks of testosterone or placebo. Pre‐treatment levels were measured before beginning injections and treatment levels were the average of mid‐treatment and final measures.
Throughout the study, both groups maintained an average total cholesterol level between 120 and 200 mg/dL. Both groups also maintained average HDL levels above 35 mg/dL and average LDL levels below 160 mg/dL. Average measures of blood Hb and Hct were below anaemic threshold levels throughout the study for both men (Hb < 13; Hct < 39) and women (Hb < 12; Hct < 36)38 and tended to decline over time in both groups. Average TSH levels were between 0.45 and 4.7 ulU/mL throughout the study in both the placebo and testosterone groups. C‐reactive protein levels were variable and did not change significantly over the course of the study for either group. No secondary sexual characteristics (e.g. hair growth) were reported or observed for women receiving 7 weeks of supplemental testosterone.
Body composition
Body mass decreased significantly in the placebo group by an average of 7.0% (95% CI, −9.5% to −4.5%, P < 0.001) and was virtually unchanged in the testosterone group (−0.6%, 95% CI, −3.8% to 2.6%, P = 0.64). The average per cent loss of body mass was significantly greater in the placebo group than the testosterone group (P = 0.002) (Figure 4A). The average per cent change in bone mineral content was not significantly different between the placebo and testosterone groups (P = 0.583) (Figure 4B). Lean body mass decreased in the placebo group by an average of 2.0 kg or 3.3% (95% CI, −7.3% to 0.7%, P = 0.09), and increased in the testosterone group by an average of 1.3 kg or 3.2% (95% CI, −0.5% to 6.7%, P = 0.06). The per cent change in lean body mass was significantly different between treatment groups (P = 0.015) (Figure 4C). The loss of body mass in both the placebo and testosterone groups occurred primarily from fat loss over the duration of the study. Fat mass decreased significantly in the placebo group by an average of 17.1% (P < 0.001) and decreased significantly in the testosterone group by an average of 10.7% (P = 0.004). Although the mean per cent fat lost in the placebo group was greater than the testosterone group, this difference was not statistically significant (P = 0.092) (Figure 4D). Over the duration of the study, BMI decreased significantly in the placebo group by an average of 6.4% (P < 0.001) and was unchanged in the testosterone group (−0.05%, P = 0.809). The per cent decrease in BMI was significantly greater in the placebo group than the testosterone group (P = 0.004) (Figure 4E).
Figure 4.

Per cent change (±SD) in (A) total body mass, (B) bone mineral content, (C) lean body mass, (D) fat mass, and (E) body mass index at pre‐treatment, mid‐treatment, and post‐treatment intervals over 7 weeks for patients with cervical or head and neck cancer receiving testosterone or placebo. Significant difference in pairwise comparison with pre‐treatment values is denoted with ‘*’. Significant difference in per cent change between testosterone and placebo groups at mid‐treatment and post‐treatment time points are denoted with ‘‡’.
Dynamic muscle strength
Over the duration of the study, there was no significant change in average peak torque in the placebo group (+2.9%, P = 0.76) or the testosterone group (+6.3%, P = 0.77). The average per cent change in peak torque was not significantly different between the placebo and testosterone groups (P = 0.73) (Figure 5A). Average peak power also did not change significantly in the placebo (+3.8%, P = 0.29), or testosterone group (+7.0%, P = 0.78). The average per cent change in peak power was not significantly different between the placebo and testosterone groups (P = 0.83) (Figure 5B).
Figure 5.

Peak torque (A) and peak power (B) generated by leg extension for head and neck or cervical cancer patients before during and after 7 weeks of testosterone or placebo treatment.
Physical performance
Based on previously established criteria for grading SPPB scores,19, 20, 21 there was no meaningful change from baseline physical performance scores in the placebo group (+0.3; Table 3). The testosterone group had a clinically meaningful increase in total SPPB score of 1.4 points following treatment due primarily to an increased average chair rise score.
Table 3.
Average baseline score and post‐treatment score change for tests of quality of life (General Functional Assessment of Cancer Therapy) and physical performance (Short Physical Performance Battery) for patients with cervical and head and neck cancer before and after 7 weeks of treatment with testosterone or placebo
| Baseline score (95% CI) | Post‐treatment absolute change from baseline score (95% CI) | |||
|---|---|---|---|---|
| Placebo | Testosterone | Placebo | Testosterone | |
| SPPB total score | 9.6 (7.7 to 11.6) | 7.4 (5.0 to 9.8) | 0.3 (−0.6 to 1.1) | 1.4 a (−2.6 to 5.4) |
| Gait speed | 3.8 (3.4 to 4.1) | 3.2 (1.8 to 4.6) | −0.1 (−.4 to 0.2) | 0.2 (−1.6 to 2.0) |
| Chair rise | 2.6 (1.4 to 3.8) | 2.0 (0.8 to 3.2) | 0 (−0.4 to 0.4) | 1.2 (0.2 to 2.2) |
| Balance | 3.2 (2.5 to 4.0) | 2.2 (1.2 to 3.2) | 0.4 (−0.1 to 0.8) | 0 (−2.0 to 2.0) |
| FACT‐G total score | 68.4 (47.5 to 89.4) | 61.7 (48.5 to 74.8) | −3.1 (−14.3 to 8.1) | 4.5 a (−10.7 to 19.6) |
| PWB | 15.9 (8.2 to 23.5) | 16.2 (11.4 to 21.0) | −2.5 a (−9.8 to 4.7) | −2.6 a (−10.1 to 4.8) |
| SFWB | 22.6 (19.5 to 25.7) | 18.1 (14.0 to 22.2) | −0.4 (−2.0 to 1.2) | 3.6 a (−0.3 to 7.4) |
| EWB | 16.6 (11.4 to 21.8) | 15.0 (11.5 to 18.5) | 1.8 (−1.3 to 5.0) | 2.4 (−1.7 to 6.4) |
| FWB | 13.4 (6.0 to 20.7) | 12.4 (8.0 to 16.7) | −2.0 (−5.9 to 1.9) | 1.2 (−4.6 to 7.0) |
| TOI | 29.3 (14.4 to 44.1) | 28.6 (20.0 to 37.2) | −4.5 (−13.9 to 4.9) | −1.5 (−14.1 to 11.2) |
The General Functional Assessment of Cancer Therapy (FACT‐G) quality of life questionnaire is composed of questions regarding physical well‐being (PWB), social/family well‐being (SFWB), emotional well‐being (EWB), and functional well‐being (FWB). Trial outcome index (TOI, PWB + FWB) is also assessed. The Short Physical Performance Battery (SPPB) includes tests of walking speed, rising from a chair unassisted, and standing balance. Both tests are rated so that a higher score indicates better quality of life (FACT‐G) or physical performance (SPPB).
Quality of life
Based on previously established criteria for minimally important difference (MID)23 the testosterone group showed clinically meaningful improvement in total FACT‐G quality of life score (+4.5) with no meaningful change in the placebo group (−3.1) (Tables 3 and 4). Physical well‐being declined meaningfully and to a similar extent in both the placebo (−2.5) and testosterone (−2.6) groups. Social well‐being improved meaningfully in the testosterone group (+3.6) and had no meaningful change in the placebo group (−0.4).
Table 4.
Average change in questionnaire responses for General Functional Assessment of Cancer Therapy questionnaire from patients with cervical and head and neck cancer before and after 7 weeks of testosterone or placebo
| Placebo | Testosterone | P | ||
|---|---|---|---|---|
| Physical well‐being (28 max score) | −2.5 ± 8.7 | −2.6 ± 8.9 | 0.980 | |
| GP1 | Lack energy | −0.1 ± 1.5 | −0.5 ± 1.6 | |
| GP2 | Nausea | −0.6 ± 2.1 | −0.4 ± 1.6 | |
| GP3 | Trouble meeting family needs | −0.1 ± 0.8 | −0.1 ± 1.9 | |
| GP4 | Pain | 0.4 ± 1.3 | 0.0 ± 1.4 | |
| GP5 | Treatment side effects | −1.4 ± 2.1 | −0.9 ± 2.2 | |
| GP6 | Feel ill | −0.4 ± 1.3 | −0.1 ± 2.5 | |
| GP7 | Time in bed | −0.4 ± 1.2 | −0.1 ± 1.7 | |
| Social/family well‐being (28 max score) | −0.4 ± 1.9 | 3.6 ± 4.6 | 0.050* | |
| GS1 | Close to friends | 0.3 ± 1.0 | 1.0 ± 1.9 | |
| GS2 | Emotional support from family | −0.1 ± 0.4 | 0.5 ± 0.5 | |
| GS3 | Support from friends | 0.1 ± 0.8 | 1.4 ± 1.3 | |
| GS4 | Family accepts illness | −0.3 ± 0.7 | 0.9 ± 0.8 | |
| GS5 | Family communication about illness | 0.1 ± 0.4 | 0.0 ± 1.6 | |
| GS6 | Close to partner | −0.5 ± 1.1 | −0.1 ± 0.6 | |
| GS7 | Satisfying sex life | 0.0 ± 1.1 | −0.8 ± 1.8 | |
| Emotional well‐being (24 max score) | 1.8 ± 3.8 | 2.4 ± 4.9 | 0.800 | |
| GE1 | Sadness | −0.5 ± 1.4 | 0.5 ± 2.1 | |
| GE2 | Coping with illness | 0.6 ± 1.2 | 0.4 ± 1.3 | |
| GE3 | Losing hope | 0.3 ± 0.8 | 0.0 ± 1.1 | |
| GE4 | Nervous | 0.6 ± 1.3 | 0.6 ± 1.5 | |
| GE5 | Worry about dying | 0.3 ± 1.2 | 0.3 ± 0.9 | |
| GE6 | Worry about worsening condition | 0.5 ± 0.8 | 0.3 ± 1.2 | |
| Functional well‐being (28 max score) | −2.0 ± 4.6 | 1.2 ± 7.0 | 0.307 | |
| GF1 | Able to work | −0.5 ± 0.8 | −0.4 ± 1.3 | |
| GF2 | Work is fulfilling | −0.4 ± 0.5 | 0.3 ± 2.0 | |
| GF3 | Enjoy life | −0.6 ± 0.7 | −0.5 ± 1.3 | |
| GF4 | Accept illness | 0.4 ± 0.5 | 0.3 ± 0.9 | |
| GF5 | Sleeping well | 0.0 ± 1.5 | 0.4 ± 1.5 | |
| GF6 | Enjoying usual activities | −0.5 ± 1.2 | 0.0 ± 1.1 | |
| GF7 | Content with quality of life | −0.4 ± 1.4 | 0.6 ± 1.4 | |
| Total score (108 max score) | −3.1 ± 13.4 | 4.5 ± 18.1 | 0.361 | |
| TOI (56 max score) | −4.5 ± 11.2 | −1.5 ± 15.1 | 0.655 | |
The group average (± SD) is included for each question, as well as each of the four subtests, total score, and average trial outcome index (TOI). General Functional Assessment of Cancer Therapy questions are rated on a scale of 0 to 4 and corrected so that a higher score indicates a more favourable response. Statistical significance is denoted by ‘*’.
Resting energy expenditure and nutrition
At baseline REE testing, three testosterone and two placebo patients were hypermetabolic with REE values more than 110% of predicted, and two testosterone and two placebo patients were hypometabolic with REE values <90% of predicted.27 Average baseline REE was not significantly different from predicted REE based on body weight, age, height, and gender for the placebo (1409 kcal/day, P = 0.55) or testosterone (1286 kcal/day, P = 0.80) groups (Table 5). Over the duration of the study, mean REE did not change significantly in the testosterone (post‐treatment REE = 1260 kcal/day, P > 0.99), or the placebo groups (post‐treatment REE = 1324 kcal/day, P = 0.11).
Table 5.
Resting energy expenditure and nutritional intake (kcal/day) along with overall energy balance (pre‐treatment mREE/nutritional intake) in patients with cervical or head and neck cancer before and after 7 weeks of treatment with testosterone or placebo
| Placebo | Testosterone | P value | |
|---|---|---|---|
| Pre‐treatment mREEa | 1457 ± 308 | 1259 ± 427 | 0.271 |
| Post‐treatment mREEa | 1325 ± 282 | 1260 ± 231 | 0.607 |
| Harris–Benedict pREEa | 1409 ± 252 | 1286 ± 192 | 0.273 |
| Nutritional intakeb | 1374 ± 441 | 1345 ± 387 | 0.891 |
| Energy balanceb | 0.96 ± 0.23 | 1.04 ± 0.42 | 0.656 |
Data collected from 10 placebo and eight testosterone patients.
Data collected from nine placebo and seven testosterone patients.
Resting energy expenditure was measured using indirect respirometry (mREE) before and after treatment and compared to Harris–Benedict predicted REE (pREE) based on pre‐treatment body weight, age, height, and gender. Nutritional intake was determined from combined self‐reported and hospital dietary records. Energy balance was calculated as the daily nutritional intake/pre‐treatment mREE.
Based on combined self‐reported and hospital dietary intake records, the average daily energy intake for the placebo (1374 kcal/day) and testosterone (1345 kcal/day) groups were not significantly different (P = 0.89) (Table 5). The energy balance (caloric intake/baseline REE) assessment revealed that placebo patients consumed on average 96% of the calories required by their REE, and testosterone patients consumed 104% of their REE requirements. While the average energy balance was more positive in the testosterone group than placebo, the values were variable and not significantly different (P = 0.63).
Activity
The average time spent in vigorous activity remained consistently low (below 0.5%) in both the placebo and testosterone groups throughout the study (Figure 6A and 6B). Within the testosterone group, the average time over the 7 week study period spent in moderate activity (1.3%), light activity (21.8%), and sedentary (76.7%) remained relatively stable (Figure 6B). Within the placebo group, sedentary time increased by 10.8 percentage points from a baseline of 72.5–83.3% over the 7 week study period (Figure 6A). This increased sedentary behaviour resulted from a 2.8% point decrease in moderate activity, and a 7.7% point decrease in light activity.
Adverse events
Table 1 reveals that urinary tract infections occurred in five (33%) placebo and two (22%) testosterone patients and occurred exclusively in cervical cancer patients. Pneumonia occurred in two (22%) testosterone patients and did not occur in the placebo group. Fever with unreported cause occurred in two (17%) placebo patients and was not reported in the testosterone group. One placebo patient suffered a stroke following a deep vein thrombosis (DVT) associated with blockage in a central catheter.
Discussion
Our rationale for conducting this study was based on our ongoing mechanistic studies on the effects of testosterone on skeletal muscle. Although not sufficiently studied, researchers recognize the potential of testosterone therapy to treat inflammation and lean body mass loss associated with cancer, cirrhosis, and heart failure.9, 12, 13, 39, 40 While many studies have focused on the ability of testosterone to stimulate muscle protein synthesis,41, 42, 43, 44 we have recently shown that testosterone also has significant effects on skeletal muscle wasting through its ability to inhibit expression of NF‐kB inducing kinase, a key kinase in the catabolic NF‐kB signalling pathway.45 Therefore, we hypothesized that testosterone therapy could significantly impact cachexia in late stage cancer patients by both stimulating anabolic and suppressing catabolic skeletal muscle pathways. We elected to study late stage cancer patients to test this hypothesis in the most severe of cachexia conditions. Here, we report novel findings that testosterone therapy prevented loss of body mass in patients with cervical or head and neck cancer undergoing standard of care treatment, by selectively increasing lean mass. Moreover, this increase in lean mass resulted in positive functional outcomes of improved quality of life and preserved activity.
Seven weeks of testosterone supplementation preserved body mass (Figure 4A) and BMI (Figure 4E) at near baseline measures, while both declined significantly in the placebo group. Both treatment groups had similar declines in fat mass over the study period (Figure 4D), and the preservation of body condition was selectively due to the differential changes in lean body mass between the two groups (Figure 4C). While the placebo group experienced a loss of lean body mass typically seen in cancer cachexia, patients receiving supplemental testosterone increased lean mass by over 3%. The similar loss of fat mass in both groups suggests that testosterone administration neither moderated nor exacerbated fat loss.
The increase in lean mass in the testosterone group was associated with functional improvements in physical performance with an increase in SPPB score of 1.4 points (Table 3) and was also associated with patients maintaining daily activity levels (Figure 6). This preservation of activity occurred without discernable differences in the patient perception of fatigue as assessed by FACT‐G questionnaire scores (Table 4). Questionnaire‐based subjective assessment of perceived fatigue may be an inadequate measure of treatment effectiveness if it is accompanied by unrecognized changes in physical activity.
The SFWB subtest was the most improved by testosterone on the FACT‐G questionnaire (Table 4), and specifically questions that examine the patient's subjective interpretation of other's behaviours towards them (i.e. I get emotional support from my family; I get support from my friends; my family has accepted my illness). As a socially relevant hormone, testosterone levels and exogenous administration affect social interactions including interpretation of the emotions and intentions of others.46 Because testosterone has both androgenic and psychological effects, supplemental administration to patients suffering from cancer cachexia may positively affect social well‐being independently from its effect on body condition.
Although the cachexia associated with some forms of cancer is sometimes attributed to a hypermetabolic state,47 our study did not show direct evidence of hypermetabolism (Table 5). Testosterone therapy has been shown to preferentially preserve lean mass in hypogonadal obese men undergoing weight loss in a restricted energy diet48 and may help to maintain a more favourable body composition despite anorexia and weight loss often associated with late stage cancer. In the testosterone group, a stable body mass corresponded to stable REE measurements over the study period; however, a 7.0% decrease in body mass in the placebo group corresponded to a 9% decrease in mREE. This reduced post‐treatment mREE in the placebo group is similar to the value predicted by the Harris–Benedict equation based on the post‐treatment reduction in body mass.
The persistent anaemia seen throughout the study in both treatment groups was anticipated because of bleeding commonly associated with both cervical and head and neck cancers as well as the standard of care chemotherapy and radiation therapy patients underwent.49, 50 In older men and women, low testosterone levels are associated with anaemia,51 and testosterone supplementation typically results in increased Hct and Hb.52, 53, 54 Testosterone administration effectively increases Hb in anaemic dialysis patients.55 While not examined in this study, the erythropoetic stimulation by testosterone therapy has potential secondary benefit for cancer patients at increased risk of blood loss and anaemia.
The body condition of cancer patients undergoing standard of care treatment may be degraded by factors beyond a strict definition of cancer cachexia including glucocorticoid treatment, chemotherapy, anorexia, and tumour progression. While these additional factors are not controlled for in this study, adjunct testosterone therapy had a significant effect on lean body mass and is a promising, readily available intervention that could have a profound clinical impact. Future larger studies are required to discern potential confounding factors for change in lean mass including inflammatory load, cancer progression, and the effect of treatment. Although testosterone administration preserved lean and total body mass and improved measures of quality of life in our study, this short‐duration treatment with limited sample size did not have a discernable effect on 1 year survival (Table 1; Figure 2). Because cachectic weight loss is a good predictor of lifespan,6 the anabolic effects of testosterone administration have the potential to extend life in cachectic cancer patients. Future studies of testosterone administration with greater numbers of patients treated at earlier stages of cancer therapy are warranted to confirm the profound beneficial effects on lean body mass, ensure patient safety, and properly assess potential benefit for patient survival and other secondary measures.
Conclusions
Seven weeks of testosterone supplementation ameliorated weight loss in late stage cancer patients by preferentially increasing lean body mass. The significant improvement in lean body mass with testosterone administration was associated with clinically meaningful improvements in patient quality of life and physical performance but did not increase survival. In the current study, 7 weeks of testosterone therapy was not associated with adverse events or safety concerns that could be attributed to testosterone administration in either men or women.
This study was funded by a National Cancer Institute grant to M.S.‐M. (RO1CA127971) and was conducted with the support of the Institute for Translational Sciences at the University of Texas Medical Branch, supported in part by a Clinical and Translational Science Award (UL1TR000071) from the National Center for Advancing Translational Sciences, National Institutes of Health.
Conflict of interest
All authors declare that they have no conflicts of interest in the publication of this manuscript.
Acknowledgements
We thank all the wonderful patients for their selfless participation in this trial. This study was conducted with the support of the Institute for Translational Sciences at the University of Texas Medical Branch, supported in part by a Clinical and Translational Science Award (UL1TR001439) from the National Center for Advancing Translational Sciences, National Institutes of Health. We also thank the many nurses and research staff from the Institute for Translational Sciences Clinical Research Center for their tireless effort. In particular, we thank Shay Robertson and Glenda Blaskey for their assistance with the nutritional data analysis and Dr Don Powell for assisting us in our times of need. We thank the following researchers who helped with our patients along the way including Greg White, MD; Van Hoang, MD; Debbie Majchel, MD; Matt Kohlnhofer, MD; Michael Kinsky, MD; Lee Weiderhold, MD; Lyuba Levine, MD; Michael Underbrink, MD; James Lynch, FNP; and Shanon Casperson, PhD. We also thank the UTMB IDS Pharmacy for their invaluable help including Masoomeh Ehsani, RPh, and Lisa Garcia, CPhT. Finally, we thank Concepcion Diaz Arrastia, MD, for helping conceive this study and inspiring us to find a way to help her patients.
The authors attest that they are in compliance with the ethical guidelines as outlined for publication in the Journal of Cachexia, Sarcopenia and Muscle.56
Wright, T. J. , Dillon, E. L. , Durham, W. J. , Chamberlain, A. , Randolph, K. M. , Danesi, C. , Horstman, A. M. , Gilkison, C. R. , Willis, M. , Richardson, G. , Hatch, S. S. , Jupiter, D. C. , McCammon, S. , Urban, R. J. , and Sheffield‐Moore, M. (2018) A randomized trial of adjunct testosterone for cancer‐related muscle loss in men and women. Journal of Cachexia, Sarcopenia and Muscle, 9: 482–496. doi: 10.1002/jcsm.12295.
References
- 1. Fearon K, Strasser F, Anker SD, Bosaeus I, Bruera E, Fainsinger RL, et al. Definition and classification of cancer cachexia: an international consensus. Lancet Oncol 2011;12:489–495. [DOI] [PubMed] [Google Scholar]
- 2. Tisdale MJ. Cachexia in cancer patients. Nat Rev Cancer 2002;2:862–871. [DOI] [PubMed] [Google Scholar]
- 3. Gordon JN, Green SR, Goggin PM. Cancer cachexia. QJM 2005;98:779–788. [DOI] [PubMed] [Google Scholar]
- 4. Skipworth RJ, Stewart GD, Dejong CH, Preston T, Fearon KC. Pathophysiology of cancer cachexia: much more than host‐tumour interaction? Clin Nutr 2007;26:667–676. [DOI] [PubMed] [Google Scholar]
- 5. Warren S. The immediate causes of death in cancer. Am J Med Sci 1932;184:610–615. [Google Scholar]
- 6. Martin L. Diagnostic criteria for cancer cachexia: data versus dogma. Curr Opin Clin Nutr Metab Care 2016;19:188–198. [DOI] [PubMed] [Google Scholar]
- 7. Nasrah R, Kanbalian M, Van Der Borch C, Swinton N, Wing S, Jagoe R. Defining the role of dietary intake in determining weight change in patients with cancer cachexia. Clin Nutr 2016. [DOI] [PubMed] [Google Scholar]
- 8. Muscaritoli M, Fanelli FR, Molfino A. Perspectives of health care professionals on cancer cachexia: results from three global surveys. Ann Oncol 2016;mdw420. [DOI] [PMC free article] [PubMed] [Google Scholar]
- 9. Fearon K. Cancer cachexia: developing multimodal therapy for a multidimensional problem. Eur J Cancer 2008;44:1124–1132. [DOI] [PubMed] [Google Scholar]
- 10. Dillon EL, Basra G, Horstman AM, Casperson SL, Randolph KM, Durham WJ, et al. Cancer cachexia and anabolic interventions: a case report. J Cachexia Sarcopenia Muscle 2012;3:253–263. [DOI] [PMC free article] [PubMed] [Google Scholar]
- 11. Anderson LJ, Albrecht ED, Garcia JM. Update on management of cancer‐related cachexia. Curr Oncol Rep 2017;19:3. [DOI] [PubMed] [Google Scholar]
- 12. Dev R, Bruera E, Del Fabbro E. When and when not to use testosterone for palliation in cancer care. Curr Oncol Rep 2014;16:378. [DOI] [PubMed] [Google Scholar]
- 13. Burney BO, Hayes TG, Smiechowska J, Cardwell G, Papusha V, Bhargava P, et al. Low testosterone levels and increased inflammatory markers in patients with cancer and relationship with cachexia. J Clin Endocrinol Metabol 2012;97:E700–E709. [DOI] [PubMed] [Google Scholar]
- 14. Del Fabbro E, Garcia J, Dev R, Hui D, Williams J, Engineer D, et al. Testosterone replacement for fatigue in hypogonadal ambulatory males with advanced cancer: a preliminary double‐blind placebo‐controlled trial. Support Care Cancer 2013;21:2599. [DOI] [PubMed] [Google Scholar]
- 15. Sheffield‐Moore M, Paddon‐Jones D, Casperson SL, Gilkison C, Volpi E, Wolf SE, et al. Androgen therapy induces muscle protein anabolism in older women. J Clin Endocrinol Metabol 2006;91:3844–3849. [DOI] [PubMed] [Google Scholar]
- 16. Evans WJ, Morley JE, Argilés J, Bales C, Baracos V, Guttridge D, et al. Cachexia: a new definition. Clin Nutr 2008;27:793–799. [DOI] [PubMed] [Google Scholar]
- 17. Oken MM, Creech RH, Tormey DC, Horton J, Davis TE, McFadden ET, et al. Toxicity and response criteria of the eastern cooperative oncology group. Am J Clin Oncol 1982;5:649–655. [PubMed] [Google Scholar]
- 18. Folstein MF, Folstein SE, McHugh PR. “Mini‐mental state”. A practical method for grading the cognitive state of patients for the clinician. J Psychiatr Res 1975;12:189–198. [DOI] [PubMed] [Google Scholar]
- 19. Guralnik JM, Simonsick EM, Ferrucci L, Glynn RJ, Berkman LF, Blazer DG, et al. A Short Physical Performance Battery assessing lower extremity function: association with self‐reported disability and prediction of mortality and nursing home admission. J Gerontol 1994;49:M85–M94. [DOI] [PubMed] [Google Scholar]
- 20. Perera S, Mody SH, Woodman RC, Studenski SA. Meaningful change and responsiveness in common physical performance measures in older adults. J Am Geriatr Soc 2006;54:743–749. [DOI] [PubMed] [Google Scholar]
- 21. Puthoff ML. Research corner outcome measures in cardiopulmonary physical therapy: Short Physical Performance Battery. Cardiopulm Phys Ther J 2008;19:17–22. [PMC free article] [PubMed] [Google Scholar]
- 22. Webster K, Cella D, Yost K. The functional assessment of chronic illness therapy (FACIT) measurement system: properties, applications, and interpretation. Health Qual Life Outcomes 2003;1:79. [DOI] [PMC free article] [PubMed] [Google Scholar]
- 23. Ringash J, Bezjak A, O'Sullivan B, Redelmeier DA. Interpreting differences in quality of life: the FACT‐H&N in laryngeal cancer patients. Qual Life Res 2004;13:725–733. [DOI] [PubMed] [Google Scholar]
- 24. Compher C, Frankenfield D, Keim N, Roth‐Yousey L, Evidence Analysis Working Group. Best practice methods to apply to measurement of resting metabolic rate in adults: a systematic review. J Am Diet Assoc 2006;106:881–903. [DOI] [PubMed] [Google Scholar]
- 25. Weir JB. New methods for calculating metabolic rate with special reference to protein metabolism. J Physiol 1949;109:1–9. [DOI] [PMC free article] [PubMed] [Google Scholar]
- 26. Harris JA, Benedict FG. A biometric study of human basal metabolism. Proc Natl Acad Sci 1918;4:370–373. [DOI] [PMC free article] [PubMed] [Google Scholar]
- 27. Vazeille C, Jouinot A, Durand J‐P, Neveux N, Boudou‐Rouquette P, Huillard O, et al. Relation between hypermetabolism, cachexia, and survival in cancer patients: a prospective study in 390 cancer patients before initiation of anticancer therapy. Am J Clin Nutr 2017; ajcn140434. [DOI] [PubMed] [Google Scholar]
- 28. Institute, N.C . Risk factor monitoring and methods: SAS programs for analysing NHANES 2003–2004 accelerometer data. 2007; Available from: http://riskfactor.cancer.gov/tools/nhanes_pam.
- 29. Freedson PS, Melanson E, Sirard J. Calibration of the Computer Science and Applications, Inc. accelerometer. Med Sci Sports Exerc 1998;30:777–781. [DOI] [PubMed] [Google Scholar]
- 30. Kerr J, Marinac CR, Ellis K, Godbole S, Hipp A, Glanz K, et al. Comparison of accelerometry methods for estimating physical activity. Med Sci Sports Exerc 2016. [DOI] [PMC free article] [PubMed] [Google Scholar]
- 31. Matthews CE, Keadle SK, Troiano RP, Kahle L, Koster A, Brychta R, et al. Accelerometer‐measured dose–response for physical activity, sedentary time, and mortality in US adults. Am J Clin Nutr 2016. [DOI] [PMC free article] [PubMed] [Google Scholar]
- 32. Wolff‐Hughes DL, McClain JJ, Dodd KW, Berrigan D, Troiano RP. Number of accelerometer monitoring days needed for stable group‐level estimates of activity. Physiol Meas 2016;37:1447–1455. [DOI] [PubMed] [Google Scholar]
- 33. Phillips SM, Dodd KW, Steeves J, McClain J, Alfano CM, McAuley E. Physical activity and sedentary behavior in breast cancer survivors: new insight into activity patterns and potential intervention targets. Gynecol Oncol 2015;138:398–404. [DOI] [PMC free article] [PubMed] [Google Scholar]
- 34. Skender S, Schrotz‐King P, Bohm J, Abbenhardt C, Gigic B, Chang‐Claude J, et al. Repeat physical activity measurement by accelerometry among colorectal cancer patients—feasibility and minimal number of days of monitoring. BMC Res Notes 2015;8:222. [DOI] [PMC free article] [PubMed] [Google Scholar]
- 35. Timmerman JG, Dekker‐van Weering MG, Tonis TM, Hermens HJ, Vollenbroek‐Hutten MM. Relationship between patterns of daily physical activity and fatigue in cancer survivors. Eur J Oncol Nurs 2015;19:162–168. [DOI] [PubMed] [Google Scholar]
- 36. Tajar A, Forti G, O'neill TW, Lee DM, Silman AJ, Finn JD, et al. Characteristics of secondary, primary, and compensated hypogonadism in aging men: evidence from the European Male Ageing Study. J Clin Endocrinol Metabol 2010;95:1810–1818. [DOI] [PubMed] [Google Scholar]
- 37. Sinha‐Hikim I, Arver S, Beall G, Shen R, Guerrero M, Sattler F, et al. The use of a sensitive equilibrium dialysis method for the measurement of free testosterone levels in healthy, cycling women and in human immunodeficiency virus‐infected women 1. J Clin Endocrinol Metabol 1998;83:1312–1318. [DOI] [PubMed] [Google Scholar]
- 38. Nutritional anaemias. Report of a WHO scientific group. World Health Organ Tech Rep Ser 1968;405:5–37. [PubMed] [Google Scholar]
- 39. Von Haehling S, Steinbeck L, Doehner W, Springer J, Anker SD. Muscle wasting in heart failure: an overview. Int J Biochem Cell Biol 2013;45:2257–2265. [DOI] [PubMed] [Google Scholar]
- 40. Sinclair M, Grossmann M, Hoermann R, Angus PW, Gow PJ. Testosterone therapy increases muscle mass in men with cirrhosis and low testosterone: a randomized controlled trial. J Hepatol 2016;65:906–913. [DOI] [PubMed] [Google Scholar]
- 41. Sheffield‐Moore M, Dillon EL, Casperson SL, Gilkison CR, Paddon‐Jones D, Durham WJ, et al. A randomized pilot study of monthly cycled testosterone replacement or continuous testosterone replacement versus placebo in older men. J Clin Endocrinol Metabol 2011;96:E1831–E1837. [DOI] [PMC free article] [PubMed] [Google Scholar]
- 42. Brodsky IG, Balagopal P, Nair KS. Effects of testosterone replacement on muscle mass and muscle protein synthesis in hypogonadal men—a clinical research center study. J Clin Endocrinol Metabol 1996;81:3469–3475. [DOI] [PubMed] [Google Scholar]
- 43. Urban RJ, Bodenburg YH, Gilkison C, Foxworth J, Coggan AR, Wolfe RR, et al. Testosterone administration to elderly men increases skeletal muscle strength and protein synthesis. Am J Physiol‐Endocrinol Metab 1995;269:E820–E826. [DOI] [PubMed] [Google Scholar]
- 44. Ferrando AA, Sheffield‐Moore M, Yeckel CW, Gilkison C, Jiang J, Achacosa A, et al. Testosterone administration to older men improves muscle function: molecular and physiological mechanisms. Am J Physiol‐Endocrinol Metab 2002;282:E601–E607. [DOI] [PubMed] [Google Scholar]
- 45. Urban RJ, Dillon E, Choudhary S, Zhao Y, Horstman A, Tilton R, et al. Translational studies in older men using testosterone to treat sarcopenia. Trans Am Clin Climatol Assoc 2014;125:27. [PMC free article] [PubMed] [Google Scholar]
- 46. Eisenegger C, Haushofer J, Fehr E. The role of testosterone in social interaction. Trends Cogn Sci 2011;15:263–271. [DOI] [PubMed] [Google Scholar]
- 47. Tisdale MJ. Cancer cachexia: metabolic alterations and clinical manifestations. Nutrition 1997;13:1–7. [DOI] [PubMed] [Google Scholar]
- 48. Fui MNT, Prendergast LA, Dupuis P, Raval M, Strauss BJ, Zajac JD, et al. Effects of testosterone treatment on body fat and lean mass in obese men on a hypocaloric diet: a randomized controlled trial. BMC Med 2016;14:153. [DOI] [PMC free article] [PubMed] [Google Scholar]
- 49. Cornes P, Boiangiu I. The role of epoetin beta in the treatment of anaemia in patients with gynaecological malignancies. Anticancer Res 2007;27:513–522. [PubMed] [Google Scholar]
- 50. Rodgers GM, Becker PS, Blinder M, Cella D, Chanan‐Khan A, Cleeland C, et al. Cancer‐and chemotherapy‐induced anaemia. J Natl Compr Canc Netw 2012;10:628–653. [DOI] [PubMed] [Google Scholar]
- 51. Ferrucci L, Maggio M, Bandinelli S, Basaria S, Lauretani F, Ble A, et al. Low testosterone levels and the risk of anaemia in older men and women. Arch Intern Med 2006;166:1380–1388. [DOI] [PMC free article] [PubMed] [Google Scholar]
- 52. Calof OM, Singh AB, Lee ML, Kenny AM, Urban RJ, Tenover JL, et al. Adverse events associated with testosterone replacement in middle‐aged and older men: a meta‐analysis of randomized, placebo‐controlled trials. J Gerontol A Biol Sci Med Sci 2005;60:1451–1457. [DOI] [PubMed] [Google Scholar]
- 53. Coviello AD, Kaplan B, Lakshman KM, Chen T, Singh AB, Bhasin S. Effects of graded doses of testosterone on erythropoiesis in healthy young and older men. J Clin Endocrinol Metabol 2008;93:914–919. [DOI] [PMC free article] [PubMed] [Google Scholar]
- 54. Rhoden EL, Morgentaler A. Risks of testosterone‐replacement therapy and recommendations for monitoring. N Engl J Med 2004;350:482–492. [DOI] [PubMed] [Google Scholar]
- 55. Shaldon S, Koch KM, Oppermann F, Patyna WD, Schoeppe W. Testosterone therapy for anaemia in maintenance dialysis. Br Med J 1971;3:212–215. [DOI] [PMC free article] [PubMed] [Google Scholar]
- 56. von Haehling S, Morley JE, Coats AJS, Anker SD. Ethical guidelines for publishing in the Journal of Cachexia, Sarcopenia and Muscle: update 2015. J Cachexia Sarcopenia Muscle 2015;6:315–316. [DOI] [PMC free article] [PubMed] [Google Scholar]