

Abstract
Alternative pre‐mRNA splicing plays important roles in regulating self‐renewal and differentiation of embryonic stem cells (ESCs). However, how specific alternative splicing programs are established in ESCs remains elusive. Here, we show that a subset of alternative splicing events in ESCs is dependent on miR‐294 expression. Remarkably, roughly 60% of these splicing events are affected by the depletion of Muscleblind‐Like Splicing Regulator 1 and 2 (Mbnl1/2). Distinct from canonical miRNA function, miR‐294 represses Mbnl1/2 through both posttranscriptional and epigenetic mechanisms. Furthermore, we uncover non‐canonical functions of MBNL proteins that bind and promote the expression of miR‐294 targets, including Cdkn1a and Tgfbr2, thereby opposing the role of miR‐294 in regulating cell proliferation, apoptosis, and epithelial–mesenchymal transition (EMT). Our study reveals extensive interactions between miRNAs and splicing factors, highlighting their roles in regulating cell type‐specific alternative splicing and defining gene expression programs during development and cellular differentiation.
Keywords: alternative splicing, embryonic stem cells, miR‐290, muscleblind‐like proteins, posttranscriptional regulation
Subject Categories: Chromatin, Epigenetics, Genomics & Functional Genomics; RNA Biology; Stem Cells
Introduction
Alternative pre‐mRNA splicing is a ubiquitous posttranscriptional regulatory mechanism that controls gene expression level and protein diversity in metazoan 1. It has been well documented that alternative splicing of specific genes contributes to cell differentiation, organ development, and tissue identity 2, 3, 4, 5. Moreover, a large number of human diseases including congenital myotonic dystrophy and spinal muscular atrophy are caused by aberrant splicing regulation 6, 7, 8, 9, 10. Alternative splicing is majorly regulated by cis‐regulatory sequences in pre‐mRNAs and the expression level of trans‐acting factors including numerous RNA binding proteins (RBPs) 1. Depending on the relative binding positions in pre‐mRNAs, a splicing factor can either promote or inhibit the recognition of specific splice sites to generate different mature mRNA isoforms 1, 11, 12, 13, 14. During development and cellular differentiation, the expression of specific splicing factors is finely tuned to coordinate a specific alternative splicing program tailored for a specific cell or tissue type 2, 15, 16. Furthermore, different splicing factors may compete or cooperate with each other to decide the choice of splice sites 11, 17, 18. How the expression of splicing factors is coordinated to enable a cell type‐specific splicing code is largely unknown.
In embryonic stem cells (ESCs), ESC‐specific splicing isoforms of Foxp1 19 and Mbd2 20 promote, while their differentiation‐associated splicing isoforms inhibit self‐renewal and pluripotency. Consistently, these isoforms also opposingly regulate the induction of pluripotency during reprogramming 19, 20. Recent studies begin to reveal an ESC‐specific splicing code at a genome‐wide level based on high‐throughput sequencing or microarray analysis 14, 21, 22. The ESC‐specific splicing program is at least partially explained by the differential expression of several known splicing regulators in ESCs and somatic cells. In particular, Mbnl1 and Mbnl2 repress ESC‐specific alternative splicing of dozens of genes including Foxp1 14. Consistently, the expression of Mbnl1/2 is largely suppressed in ESCs and during reprogramming of induced pluripotent stem cells (iPSCs), although the regulatory mechanism behind this repression remains elusive. These studies demonstrate the extent and functional importance of alternative splicing in ESCs and during reprogramming. However, the underlying mechanisms controlling alternative splicing program in ESCs and how alternative splicing interplays with other pluripotency regulators such as transcription factors, epigenetic modifiers, and miRNAs are yet unexplored.
In addition to alternative splicing, microRNA (miRNA) regulation is another ubiquitous posttranscriptional regulatory mechanism that mainly represses gene expression by destabilizing or inhibiting the translation of their mRNA targets 23, 24, 25. Specific miRNAs are associated with and contribute to specific cell differentiation status and disease stages. Pluripotent stem cells (PSCs) including ESCs and iPSCs express extremely high levels of ESCC miRNAs with a seed sequence “AAGUGCU” which include six members from miR‐290 and miR‐302 clusters 26, 27. miR‐290/302 family of miRNAs have been shown to promote ESC self‐renewal and reprogramming by positively regulating the glycolysis 28, G1/S transition of cell cycle progression 29, and survival of ESCs under stress or differentiation conditions 30, 31. In addition, miR‐290/302 family of miRNAs are required for the naive to primed pluripotency transition 32 and modulate global distribution of PRC2 binding and H3K27 tri‐methylation 33, 34. Previous mechanistic studies on miRNAs have mainly focused on the repression of specific targets. In contrast, the regulation of proteomic diversity by miRNAs is largely unexplored.
In this study, we show that miRNAs control a large number of alternative splicing events in ESCs. Knockout of Dgcr8, an essential gene for miRNA biogenesis, led to 578 aberrant alternative splicing events with different patterns including cassette exon, retained intron, alternative 5′/3′ splice sites, and mutually exclusive exons. Furthermore, 70% of the differential splicing events were rescued by the reintroduction of miR‐294 in Dgcr8 KO ESCs. Interestingly, for splicing factors and RBPs, although many of predicted targets were downregulated by miR‐294, the overall expression level was globally upregulated. Mechanistically, ~60% of miR‐294‐dependent alternative splicing events were at least partially caused by the repression of its direct targets Mbnl1 and Mbnl2. Surprisingly, we found that miR‐294 also promotes transcriptional repression of Mbnl1/2 through enhancing PRC2 binding to their promoters. In addition, miR‐294 represses while Mbnl1/2 promotes the production of Mbd2_L, another mRNA target of miR‐294, through modulating the alternative last exon usage. Unexpectedly, we found that MBNL proteins bind and promote the expression of many key miR‐294 targets, therefore counteracting miR‐294's function in regulating proliferation, apoptosis, and epithelial–mesenchymal transition (EMT). Together, our study reveals extensive crosstalk between miRNAs and splicing factors in regulating alternative splicing and gene expression program for cell fate determination and has important implications for studying miRNA regulation, development, and diseases.
Results
miR‐290/302 family is a master regulator of alternative splicing in embryonic stem cells
The members of miR‐290/302 family share the same seed sequence and represent a class of extremely abundant miRNAs in ESCs. To identify miR‐290/302 cluster‐regulated splicing events at the genome level, we performed high‐throughput RNA sequencing on wild‐type, mock‐, and miR‐294‐transfected Dgcr8 knockout (KO) ESCs. We used MISO 35 program to determine splicing changes first between wild‐type and Dgcr8 KO ESCs, with comparable portions of exons > 15% more included or excluded in one cell type over the other. We found 578 differentially regulated splicing events including alternative splicing types of cassette exon (291), retained intron (79), alternative 5′/3′ splice sites (160), and mutually exclusive exons (48) (Fig 1A and Table EV1). Previously, Han et al 14 reported 103 ESC‐specific cassette exon type of alternative splicing events. Our RNA‐seq analysis detected 70 of these events (Table EV2), of which 21 were differentially regulated (absolute differences of percent spliced in value ≥ 15, i.e., ∣ΔPSI∣≥ 15) in wild‐type over Dgcr8 KO ESCs (Fig 1B). We chose three differentially regulated exons (Add3, Mta1, and Numa1) and confirmed PSI changes for all of them by RT–PCR (Fig 1C and D). RT–PCR also confirmed the change of PSI for a cassette exon of Ssbp3 which has a ΔPSI~10 by MISO analysis (Fig 1C and D). In addition, although our MISO analysis did not identify alternative splicing of Foxp1, RT–PCR showed that the ESC‐specific alternative splicing form of Foxp1 is repressed in Dgcr8 KO ESCs (Fig 1C and D). Notably, 19 of 21 differentially regulated cassette exons adopted similar splicing pattern in Dgcr8 KO ESCs as in differentiated tissues 14 (Fig EV1A), suggesting that miRNAs mainly promote the inclusion of ESC‐specific cassette exons. Interestingly, the introduction of miR‐294 in Dgcr8 KO ESCs rescued 403 (70%) of differentially regulated alternative splicing events including 16 ESC‐specific events by at least 1/3 (Fig 1C–E). Consistently, unbiased cluster analysis 36 for PSI values of differentially regulated alternative splicing events showed that miR‐294‐transfected Dgcr8 KO ESCs clustered closer to wild‐type over Dgcr8 KO ESCs (Fig 1A and B). Correlation analysis also showed high association between differences in PSI of miR‐294‐transfected versus mock‐transfected Dgcr8 KO ESCs and differences in PSI of wild‐type versus Dgcr8 KO ESCs (Fig EV1B). These data indicate that miR‐290/302 family of miRNAs are important regulators of alternative splicing program of ESCs.
Figure 1. miR‐294 controls alternative splicing program of ESCs.
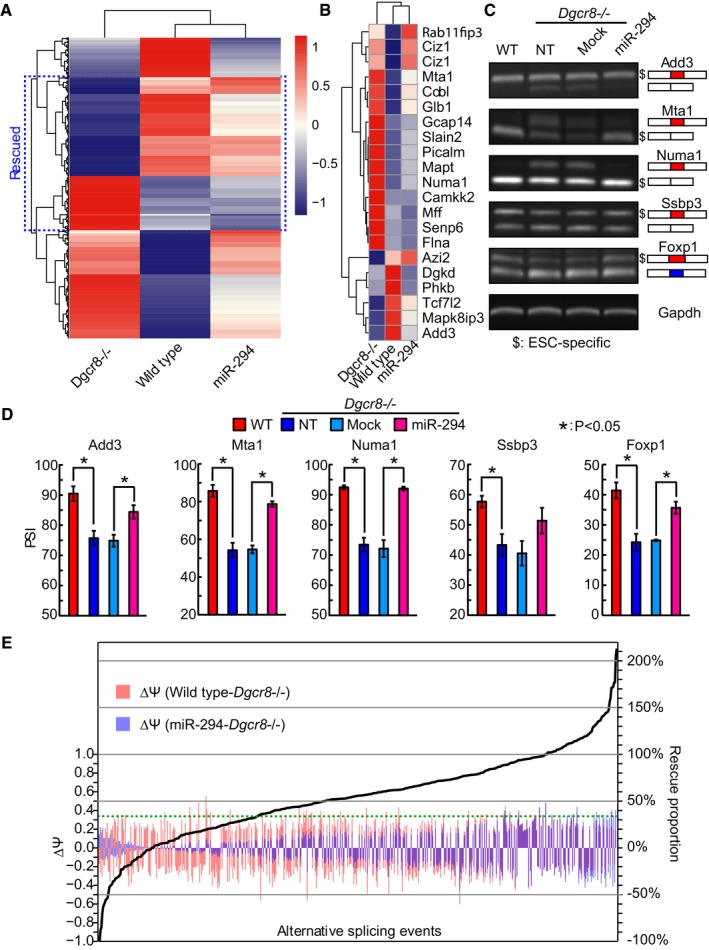
- Heatmap of percent spliced in (PSI) values of differential alternative splicing events between wild‐type and Dgcr8 KO ESCs.
- Heatmap of PSI values of differential ESC‐specific alternative splicing events between wild‐type and Dgcr8 KO ESCs.
- Representative gel images from RT–PCR for ESC‐specific alternative splicing events.
- Quantification of PSI for ESC‐specific alternative splicing events from RT–PCR. Shown are mean ± SD, n = 3. P values are as indicated. Unpaired two‐tailed Student's t‐test.
- Rescue of DGCR8‐mediated alternative splicing events by miR‐294.
Figure EV1. miR‐290/302 family of miRNAs regulate alternative splicing program of ESCs.

- Scatter plot of differences in PSIs of ESCs versus differentiated cells/tissues, and differences in PSIs of wild‐type ESCs versus Dgcr8 KO ESCs. High association is found between Dgcr8 KO ESCs and differentiated cells/tissues. P value was calculated by one‐sided binomial test between quadrants.
- Scatter plot of differences in PSIs of wild‐type versus Dgcr8 KO ESCs, and differences in PSIs of miR‐294 versus mock‐transfected Dgcr8 KO ESCs. High association is found between wild‐type ESCs and miR‐294‐transfected Dgcr8 KO ESCs. P value was calculated by one‐sided binomial test between quadrants.
miR‐294 globally upregulates the expression of RBPs and splicing factors in ESCs
To understand how miR‐290/302 family of miRNAs modulate alternative splicing program of ESCs, we surveyed the expression profiling of 1441 RNA binding proteins (RBPs) 37 and 198 splicing factors (SFs) 14 in wild‐type, mock‐, and miR‐294‐transfected Dgcr8 KO ESCs (Fig EV2A–C and Table EV3). We found that 447 RBPs and 40 SFs were downregulated, while only 106 RBPs and 17 SFs were upregulated for > 1.5‐fold in Dgcr8 KO versus wild‐type ESCs (Fig EV2D and E and Table EV3). Furthermore, cluster and correlation analyses confirmed that miR‐294 essentially rescued the expression changes of most RBPs and SFs (Fig EV2A–C, F and G). Consistent with these results, cumulative density function plot showed that the expression of RBPs and SFs was globally downregulated in Dgcr8 KO ESCs and rescued by the introduction of miR‐294 (Fig 2A and B). Similarly, the global upregulation trend of RBPs and SFs by miR‐294 was reflected in median fold change values of gene expression (Fig 2C). In contrast, for both RBPs and SFs, predicted targets of miR‐294 are still enriched in genes downregulated by miR‐294 (Figs 2C and EV2F and G). These data show that although many of the predicted miR‐294 targets are downregulated by miR‐294, the overall expression levels of RBPs and SFs are upregulated by miR‐294.
Figure EV2. miR‐294 globally promotes the expression of RBPs and SFs.

-
A, BHeatmap showing mRNA expression changes of RBPs and SFs in wild‐type, Dgcr8 KO, and miR‐294‐transfected Dgcr8 KO ESCs.
-
CqRT–PCR analysis confirming differences in the expression of selected RBPs and SFs in wild‐type, Dgcr8 KO, and miR‐294‐transfected Dgcr8 KO ESCs. The β‐actin gene was used as a control. Data were normalized to the mRNA level of wild‐type ESCs. Shown are mean ± SD, n = 2. P values are as indicated. Unpaired two‐tailed Student's t‐test.
-
D, EBar plots of log2 fold change of RBPs (D) and SFs (E) between Dgcr8 KO and wild‐type ESCs.
-
F, GScatter plot of fold changes between wild‐type ESCs versus Dgcr8 KO ESCs (WT/KO) and fold changes between miR‐294‐ versus mock‐transfected Dgcr8 KO ESCs (KO_294/KO) for RBPs (F) and SFs (G). High association is found between miR‐294‐transfected Dgcr8 KO and wild‐type ESCs. P values were calculated by one‐tailed binomial test. Red dots represent predicted miR‐294 targets. The fold change value of KO_294/KO is also projected to the bar plot at the right side of each panel. Each line represents a gene. Genes that are downregulated 20% by miR‐294 are enriched with predicted miR‐294 targets; for RBP, fold of enrichment: 2.9, P value: 0.000002; for SF, fold of enrichment: 2.7, P value: 0.059. P values were calculated by chi‐square test.
Figure 2. miRNAs globally upregulate the expression of RBPs and SFs in ESCs.

-
ACumulative distribution functions of log2FPKM of RBPs in wild‐type, Dgcr8 KO, and miR‐294 rescued Dgcr8 KO ESCs. P value was calculated by two‐sided Wilcoxon rank‐sum test.
-
BCumulative distribution functions of log2FPKM of SFs in wild‐type, Dgcr8 KO, and miR‐294 rescued Dgcr8 KO ESCs. P value was calculated by two‐sided Wilcoxon rank‐sum test.
-
CQuantitative analyses of expression changes for all genes, RBPs, SFs, and RBPs and SFs that are predicted as miR‐294 targets in Dgcr8 KO versus wild‐type ESCs (filled boxes) and in miR‐294 versus mock‐transfected Dgcr8 KO ESCs (open boxes). Boxes indicate the 25th to 75th percentiles, and the central bar represents the median. Error bars indicate SD.
-
DCumulative distribution functions of log2FPKM of RBPs in wild‐type and Dicer1 KO ESCs. Data were reanalyzed from a previously published study by Sharp. P value was calculated by two‐sided Wilcoxon rank‐sum test.
-
ECumulative distribution functions of log2FPKM of SFs in wild‐type and Dicer1 KO ESCs. Data were reanalyzed from a previously published study by Sharp. P value was calculated by two‐sided Wilcoxon rank‐sum test.
-
F, GAverage signal intensity of H3K4me3 and H3K36me3 across RBPs and SFs in wild‐type (red) and Dicer1 KO (blue) mESCs. Y‐axis represents average value of normalized reads. P values indicate the significance of the area difference between wild‐type and Dicer1 KO signals within the dotted line (two‐sided Wilcoxon rank‐sum test, n = 100 data points). The gray box at bottom represents the beginning and the end of an average RBP or SF gene. The signals were also plotted for 50% up‐ and downstream of each gene.
DICER1 is another essential protein for miRNA biogenesis. Like Dgcr8 KO ESCs, Dicer1 KO ESCs lack mature miRNAs. Using previously published Dicer1 KO ESC data 38, we verified that RBPs and SFs are also globally downregulated in Dicer1 KO ESCs (Fig 2D and E). More interestingly, chromatin state analysis using ChIP‐Seq data of H3K4me3 and H3K36me3 in Dicer1 KO and wild‐type ESCs 39 showed that while the average level of H3K4me3 was not significantly different for RBPs and SFs, the average level of H3K36me3 was significantly downregulated for RBPs and SFs in Dicer1 KO versus wild‐type ESCs (Figs 2F and G, and EV3A and B). In addition, for both RBPs and SFs that were upregulated by miR‐294 and those that were downregulated by miR‐294, H3K36me3 occupancy on the gene body was decreased in Dicer1 KO versus wild‐type ESCs, although the level of change was much higher for upregulated RBPs and SFs (Fig EV3A and B). H3K4me3 and H3K36me3 are associated with transcriptional initiation and elongation, respectively. Therefore, these data suggest that miRNAs may indirectly upregulate the expression of RBPs and SFs through a transcription elongation‐related mechanism.
Figure EV3. H3K4me3 and H3K36me3 occupancy on RBPs and SFs.

- Average signal intensity of H3K4me3 and H3K36me3 on RBPs that are upregulated (left) or downregulated (right) for > 1.5‐fold by miR‐294 in wild‐type and Dicer1 KO mESCs.
- Average signal intensity of H3K4me3 and H3K36me3 on SFs that are upregulated (left) or downregulated (right) for > 1.5‐fold by miR‐294 in wild‐type and Dicer1 KO mESCs.
Tissue‐specific splicing regulators Mbnl1 and Mbnl2 are direct targets of miR‐294 in ESCs
Previously, Han et al 40 performed a high‐throughput screening in ESCs for factors regulating any of “52 evolutionarily conserved (i.e., between human and mouse) alternative splicing events that are associated with ESC pluripotency, neural differentiation, and somatic cell reprogramming”. The results from this screening make it possible for us to check whether any genes differentially expressed between Dgcr8 KO and wild‐type ESCs are responsible for changes in alternative splicing observed in this study. There are eight ESC‐specific alternative splicing events examined in Han's study that were differentially regulated between Dgcr8 KO and wild‐type ESCs (Appendix Fig S1). For seven of eight splicing events analyzed, there were at least one regulator up‐ or downregulated for more than 1.5‐fold in Dgcr8 KO versus wild‐type ESCs with expected consequences. Even more hits were found when the cutoff for fold change of expression was lower to 1.25‐fold (Appendix Fig S1). In particular, five splicing events were found to be regulated by Mbnl1 and Mbnl2, both of which are predicted miR‐294 targets by Targetscan. Furthermore, the expression of 72% of these hits including Mbnl1 and Mbnl2 was rescued by miR‐294 (Table EV3). Taken together, these data suggest that miR‐294 targets Mbnl1 and Mbnl2 to regulate the alternative splicing program of ESCs.
In the next, we determined whether Mbnl1 and Mbnl2 are direct targets of miR‐294. Mbnl1 and Mbnl2 were upregulated in Dgcr8 KO versus wild‐type ESCs and downregulated by miR‐294 (Fig 3A and B). Western analysis also confirmed that miR‐294 repressed the expression of MBNL1 and MBNL2 proteins (Fig 3C and D). Furthermore, the 3′UTRs of Mbnl1 and Mbnl2 are predicted to harbor conserved binding sites of miR‐294 by Targetscan (Fig 3E). We then cloned the 3′UTRs of Mbnl1 and Mbnl2 downstream to a luciferase reporter and confirmed that the 3′UTRs of Mbnl1 and Mbnl2 were indeed repressed in wild‐type ESCs and upon the transfection of miR‐294 (Fig 3F and G). Furthermore, mutation of the predicted miR‐294 binding sites restored the activity of luciferase reporters bearing Mbnl1 and Mbnl2 3′UTRs (Fig 3F and G). Together, these data demonstrate that Mbnl1 and Mbnl2 are direct mRNA targets of miR‐294.
Figure 3. miR‐294 represses Mbnl1 and Mbnl2 through both posttranscriptional and epigenetic mechanisms.

-
ART–qPCR analysis of Mbnl1 and Mbnl2 in wild‐type and Dgcr8 KO ESCs. The β‐actin gene was used as a control. For each gene, data were normalized to the mRNA level of Dgcr8 KO ESCs. Shown are mean ± SD, n = 3. P values are as indicated. Unpaired two‐tailed Student's t‐test.
-
BRT–qPCR analysis of Mbnl1 and Mbnl2 in mock‐ and miR‐294‐transfected Dgcr8 KO ESCs. The β‐actin gene was used as a control. For each gene, data were normalized to the mRNA level of mock‐transfected Dgcr8 KO ESCs. Shown are mean ± SD, n = 3. P values are as indicated. Unpaired two‐tailed Student's t‐test.
-
C, DWestern blotting analysis of MBNL1 and MBNL2 in wild‐type and Dgcr8 KO ESCs or mock‐ and miR‐294‐transfected Dgcr8 KO ESCs. TUBULIN was used as a loading control. Data were normalized to the protein level of mock‐transfected Dgcr8 KO ESCs.
-
ESequences of predicted miR‐294 targeting sites and corresponding mutations in 3′UTRs of Mbnl1 and Mbnl2.
-
FLuciferase reporter assay in wild‐type and Dgcr8 KO ESCs. Data were normalized to renilla and then to control vectors. Shown are mean ± SD, n = 4. P values are as indicated. Unpaired two‐tailed Student's t‐test.
-
GLuciferase reporter assay in mock‐ and miR‐294‐transfected Dgcr8 KO ESCs. Data were normalized to renilla and then to control vectors. Shown are mean ± SD, n = 4. P values are as indicated. Unpaired two‐tailed Student's t‐test.
-
HChIP‐qPCR analysis of EZH2 at Mbnl1 and Mbnl2 promoters in wild‐type, Dgcr8 KO, and miR‐294‐transfected Dgcr8 KO ESCs. Nr2f2 and Hoxa1 as positive controls. Oct4 as a negative control. Data were normalized to input and then to Dgcr8 KO ESCs. Shown are mean ± SD, n = 4. P values are as indicated. Unpaired two‐tailed Student's t‐test.
-
IRT–qPCR analysis of Mbnl1 and Mbnl2 in wild‐type and Eed knockout ESCs. The β‐actin gene was used as a control. For each gene, data were normalized to the mRNA level of wild‐type ESCs. Shown are mean ± SD, n = 3. P values are as indicated. Unpaired two‐tailed Student's t‐test.
Source data are available online for this figure.
miR‐294 epigenetically represses Mbnl1 and Mbnl2 through promoting the binding of PRC2 at their promoters
Noticeably, the repression of luciferase reporters bearing 3′UTRs of Mbnl1 and Mbnl2 was not as severe as the repression of mRNAs of Mbnl1 and Mbnl2 in wild‐type ESCs or by miR‐294. We therefore checked whether miR‐294 represses Mbnl1 and Mbnl2 through additional mechanisms. Previous studies show that miR‐290 family is required for efficient PRC2 binding to transcriptional start sites genome‐wide 33, 34. To check whether miR‐294 regulates PRC2 binding to the promoters of Mbnl1 and Mbnl2, we performed ChIP‐qPCR to determine the binding of EZH2 at these sites. Interestingly, EZH2 binding at the promoters of both Mbnl1 and Mbnl2 was diminished in Dgcr8 KO versus wild‐type ESCs (Fig 3H). Furthermore, miR‐294 rescued the binding of EZH2 to the promoters of Mbnl1 and Mbnl2 (Fig 3H). To understand the functional consequence of PRC2 binding, we analyzed the expression of Mbnl1 and Mbnl2 in ESCs knocking out Eed, an essential component of PRC2. Consistent with gene silencing function of PRC2, we found that Mbnl1 and Mbnl2 were significantly upregulated in Eed knockout ESCs (Fig 3I). In addition, we analyzed H3K4me3 and H3K36me3 occupancy at Mbnl1/2 locus in WT and Dicer1 KO ESCs. Consistent with lower transcription and higher binding of EZH2, H3K4me3 occupancy at Mbnl1/2 promoter is lower in WT versus Dicer1 KO ESCs (Appendix Fig S2). Consistent with the global trend of H3K36me3 occupancy on the gene body of RBPs and SFs (Fig 2F and G), H3K36me3 occupancy on the gene body of Mbnl1/2 is higher in WT versus Dicer1 KO ESCs (Appendix Fig S2). Together, these data show that miR‐294 represses the expression of Mbnl1 and Mbnl2 through both posttranscriptional and epigenetic mechanisms.
miR‐294 regulates a large number of alternative splicing events through the repression of Mbnl1 and Mbnl2
To understand to what extent miR‐294 regulates alternative splicing in ESCs through Mbnl1 and Mbnl2, we performed high‐throughput RNA‐seq on Dgcr8 KO ESCs transfected with a mixture of siRNAs 14 against Mbnl1 and Mbnl2. The siRNA mixture successfully knocked down both Mbnl1 and Mbnl2 (Appendix Fig S3A). Unbiased cluster analysis for PSI values of differentially regulated splicing events between Dgcr8 KO and wild‐type ESCs demonstrated that Mbnl1/2 siRNAs‐transfected Dgcr8 KO ESCs clustered closer to miR‐294‐transfected over mock‐transfected Dgcr8 KO ESCs (Fig 4A and B). RT–PCR confirmed all PSI changes upon knocking down Mbnl1 and Mbnl2 (Fig 4C and D). For 403 miR‐294‐dependent alternative splicing events, 241 of them were rescued more than 1/3 by the transfection of siRNAs to Mbnl1/2 (Fig 4E and Table EV1). Consistently, overexpression of Mbnl1 or Mbnl2 repressed the inclusion of all 5 ESC‐specific cassette exons in ESCs (Appendix Fig S3B). Furthermore, there were still 162 miR‐294‐dependent alternative splicing events that were not rescued by siMbnl1/2 (Fig 4E and Table EV1), suggesting that miR‐294 regulates alternative splicing through both MBNL‐dependent and independent mechanisms. Together, these data demonstrate that a large portion of miR‐294‐dependent alternative splicing events is regulated through the downregulation of Mbnl1/2 by miR‐294.
Figure 4. miR‐294 controls alternative splicing through repressing Mbnl1 and Mbnl2 in ESCs.

- Heatmap of PSI values of miR‐294 rescued splicing events.
- Heatmap of PSI values of differential ESC‐specific splicing events between wild‐type and Dgcr8 KO ESCs.
- Representative gel images from RT–PCR for ESC‐specific alternative splicing events.
- Quantification of PSI for ESC‐specific alternative splicing events from RT–PCR. Shown are mean ± SD, n = 2. P values are as indicated. Unpaired two‐tailed Student's t‐test.
- Rescue of differential splicing events by Mbnl1 and Mbnl2. Shown are differential splicing events between wild‐type and Dgcr8 KO ESCs that are rescued at least 1/3 by miR‐294.
miR‐294 and Mbnl1/2 opposingly regulate the selection of alternative last exons of Mbd2
Mbd2 is a transcriptional repressor binding to methylated DNA region and plays important roles in ESCs and during reprogramming 20, 28. Interestingly, Mbd2 has two different isoforms with alternative last exons 41, a phenomenon also known as alternative polyadenylation. We have previously shown that the long isoform is a direct target of miR‐294 in the regulation of glycolysis in ESCs and during reprogramming 28. Since MISO analysis does not include the selection of alternative last exons, we checked the expression of two Mbd2 isoforms manually. High‐throughput RNA sequencing detected both isoforms of Mbd2 in mouse ESCs (Mbd2_S and Mbd2_L, Fig 5A). RT–qPCR analysis revealed that approximately 9.0 copies of Mbd2_S and 7.8 copies of Mbd2_L per cell were expressed in wild‐type ESCs (Figs 5B and EV4A). Furthermore, Mbd2_S was significantly downregulated, while Mbd2_L was significantly upregulated in Dgcr8 KO versus wild‐type ESCs (Fig 5B and C). Interestingly, both miR‐294 and siMbnl1/2 rescued these changes (Fig 5C). Consistently, overexpression of Mbnl1 or Mbnl2 downregulated Mbd2_S and upregulated Mbd2_L in wild‐type ESCs (Fig EV4B). To check whether Mbnl1/2 regulates the alternative polyadenylation of Mbd2 during development, we performed embryoid body differentiation which mimics early embryo development. We found that the ratio of Mbd2_L/Mbd2_S is significantly increased during differentiation, correlating with the increased expression of Mbnl1 and Mbnl2 (Fig 5D and E). In the next, we transfected siRNAs against Mbnl1/2 in NIH 3T3 fibroblasts. Consistently, knocking down Mbn1/2 led to the downregulation of Mbd2_L and the upregulation of Mbd2_S as expected (Fig 5F and G). Furthermore, CLIP‐seq data from C2C12 cells 42 showed that Mbnl1/2 directly bind the upstream of the last exon of Mbd2_S, suggesting that MBNL proteins directly regulate the selection of last exon of Mbd2. Consistent with the CLIP‐seq analysis, RIP‐qPCR confirmed that Mbd2 is bound by MBNL1 and MBNL2 in ESCs (Fig EV4C). Altogether, these data show that miR‐294 and MBNL proteins opposingly regulate the selection of alternative last exons of Mbd2 (Fig 5H). Together with our previous results 28 showing that Mbd2_L is a direct target of miR‐294, these data demonstrate that miR‐294 can decrease the level of Mbd2_L through indirectly affecting alternative polyadenylation process in addition to posttranscriptional repression by directly targeting 3′UTR.
Figure 5. miR‐294 and Mbnl1/2 opposingly regulate the alternative last exon usage of Mbd2.

- Sequencing tracks of Mbd2. The y‐axis represents number of reads per million. The gene structures of short and long isoforms of Mbd2 are shown at the bottom in black, with the exons as black boxes.
- Estimated copy numbers per cell for Mbd2_S and Mbd2_L in wild‐type and Dgcr8 KO ESCs. Shown are mean ± SD, n = 3. P values are as indicated. Unpaired two‐tailed Student's t‐test.
- RT–qPCR analysis of Mbd2_S and Mbd2_L in wild‐type, Dgcr8 KO, miR‐294, and Mbnl1/2 siRNA mixtures transfected Dgcr8 KO ESCs. The β‐actin gene was used as a control. Data were normalized to the mRNA level of wild‐type ESCs. Shown are mean ± SD, n = 3. P values are as indicated. Unpaired two‐tailed Student's t‐test.
- RT–qPCR analysis of Mbnl1, Mbnl2, Mbd2_S, and Mbd2_L at different timepoints of embryoid body differentiation. The β‐actin gene was used as a control. Data were normalized to the mRNA level of wild‐type ESCs. Shown are mean ± SD, n = 3. P values are as indicated. Unpaired two‐tailed Student's t‐test.
- Relative ratios of Mbd2_L/Mbd2_S. Shown are mean ± SD, n = 3. P values are as indicated. Unpaired two‐tailed Student's t‐test.
- Western blotting analysis of MBNL1/2 proteins in NIH 3T3 cells transfected with Mbnl1/2 siRNA mixtures. Data were normalized to TUBULIN and then to control transfected 3T3 cells.
- RT–qPCR analysis of Mbnl1, Mbnl2, Mbd2_S, and Mbd2_L in NIH 3T3 cells transfected with Mbnl1/2 siRNA mixtures. Data were normalized to β‐actin and then to control transfected NIH 3T3 cells. Shown are mean ± SD, n = 3. P values are as indicated. Unpaired two‐tailed Student's t‐test.
- Summary graph showing opposing regulation of Mbd2 isoforms by miR‐294 and Mbnl1/2. Mbnl1/2 repress and promote the splicing of Mbd2_S and Mbd2_L, respectively, while miR‐294 directly represses the expression of Mbnl1 and Mbnl2. In addition, miR‐294 represses the expression of Mbd2_L through targeting its 3′UTR.
Source data are available online for this figure.
Figure EV4. miR‐294 and Mbnl1/2 opposingly regulate the alternative usage of last exons of Mbd2.

- Schematic design for quantifying relative level of Mbd2_S and L. Amplicons for both Mbd2 isoforms were cloned in tandem into the same plasmid. Seven different dilutions were made for qPCR to make the standard curve. The amount of each isoforms was calculated by fitting the Ct value into the respective standard curve. Shown are representative standard curves.
- qRT–PCR analysis of Mbd2_S and Mbd2_L in GFP, Mbnl1, Mbnl2 overexpressing ESCs. The β‐actin gene was used as a control. Data were normalized to the mRNA level of GFP overexpressing ESCs. Shown are mean ± SD, n = 2. P values are as indicated. Unpaired two‐tailed Student's t‐test.
- RIP–qPCR analysis of Mbd2 bound to MBNL proteins. Data were normalized to Rpl7 and then to RNA pulled down in GFP overexpressing ESCs. Fip1l1 served as a negative control. Shown are mean ± SD, n = 2. P value is as indicated. Unpaired two‐tailed Student's t‐test.
Mbnl1/2 counteracts the function of miR‐294 by binding and upregulating the expression of key miR‐294 targets
As shown in Fig 5D, Mbnl1/2 were significantly increased during ESC differentiation. To understand the impact of increased level of Mbnl1/2, we ectopically expressed Mbnl1/2 in ESCs to a similar level in 3T3 cells (Fig EV5A) and checked the expression of pluripotency genes. Overexpression of Mbnl1/2 led to a slight downregulation of Nanog, Klf4, and Esrrb but not core pluripotency genes Oct4 and Sox2 (Fig EV5B). Interestingly, Mbnl1/2 overexpression significantly decreased the proliferation rate of ESCs (Fig 6A), accompanied with a slight accumulation of cells in G0/G1 phase (Fig 6B) and increased apoptosis (Fig 6C). Moreover, ESCs overexpressing Mbnl1/2 showed a more elongated and irregular shape suggesting a gain of mesenchymal properties (Fig 6D). Consistent with cellular phenotypes, RT–qPCR analysis verified that mesenchymal marker Cdh2 and key transcription factors promoting epithelial‐to‐mesenchymal transition (EMT) are upregulated in Mbnl1/2 overexpressing ESCs (Fig 6E). We and others have previously shown that miR‐294 promotes ESC proliferation and G1/S transition, and inhibits apoptosis and epithelial‐to‐mesenchymal transition 29, 30, 31, 43. Therefore, these data suggest that Mbnl1/2 counteract the function of miR‐294 in these processes.
Figure EV5. Mbnl1 and Mbnl2 overexpression slightly represses the pluripotency of ESCs.

- qRT–PCR of Mbnl1 and Mbnl2 in 3T3 and ESCs. Data were normalized to β‐actin gene. Shown are mean ± SD, n = 3. P values are as indicated. Unpaired two‐tailed Student's t‐test.
- RT–PCR analysis of pluripotency genes in GFP, Mbnl1, Mbnl2 overexpressing ESCs. The β‐actin gene was used as a control. Data were normalized to the mRNA level of GFP overexpressing ESCs. ESCs were harvested ˜48 h after overexpressing Mbnl1/2. Shown are mean ± SD, n = 2. P values are as indicated. Unpaired two‐tailed Student's t‐test.
Figure 6. Mbnl1/2 counteract miR‐294's function in regulating proliferation, apoptosis, and EMT.

- Proliferation index for GFP, Mbnl1, and Mbnl2 overexpressing ESCs. Transgenes were induced by 1 μM doxycycline during plating at day 0. Cells were counted at day 2. Data were normalized to GFP overexpressing ESCs. Shown are mean ± SD, n = 3. P values are as indicated. Unpaired two‐tailed Student's t‐test.
- Cell cycle analysis of GFP, Mbnl1, and Mbnl2 overexpressing ESCs. Shown are mean ± SD, n = 3.
- Apoptosis analysis of GFP, Mbnl1, and Mbnl2 overexpressing ESCs. Shown are mean ± SD, n = 3. P values are as indicated. Unpaired two‐tailed Student's t‐test.
- Representative images of GFP, Mbnl1, and Mbnl2 overexpressing ESCs. Images were taken ˜48 h after overexpression. Scale bars: 25 μm.
- RT–qPCR analysis of EMT markers. Cells were harvested ˜48 h after overexpression. The β‐actin gene was used as a control. Data were normalized to the mRNA level of wild‐type ESCs. Shown are mean ± SD, n = 3. P values are as indicated. Unpaired two‐tailed Student's t‐test.
To understand how Mbnl1/2 oppose the function of miR‐294, we used RIP–qPCR to check whether MBNL proteins directly bind to mRNAs of key miR‐294 targets in ESCs that are responsible for cell cycle and proliferation (Cdkn1a, Lats2, Rbl1, and Rbl2) 29, 43, for apoptosis (Casp2 and Ei24) 30, and for epithelial‐to‐mesenchymal transition (Vim, Arhgef3, Arhgap12, Mmp23, Zeb1, Zeb2, Fndc3a, Rhoc, Tgfbr2) 31, 44. The results showed that Mbnl1/2 binding was enriched in 9 of 15 selected miR‐294 targets in ESCs (Fig 7A). For these nine Mbnl1/2 binding targets, RT–qPCR analysis showed that eight of them are significantly upregulated in Mbnl1/2 overexpressing ESCs (Fig 7B). In contrast, only one of other six targets that are not bound by Mbnl1/2 was upregulated (Fig 7B). Furthermore, we tested whether Mbnl1/2 can promote the expression of their targets through 3′UTR. We previously constructed luciferase reporters bearing 3′UTR of Vim, Rhoc, Tgfbr2, Cdkn1a, and Lats2 31, 43. Luciferase assay showed that MBNL proteins promoted the activity of luciferase reporters bearing 3′UTR of Tgfbr2, Cdkn1a, and Lats2 (Fig 7C and D). In addition, even when miR‐294 binding sites are mutated in the 3′UTR of Tgfbr2, the luciferase activity was still significantly increased upon Mbnl1/2 overexpression (Fig 7E), suggesting Mbnl1/2 promoting the expression of these genes independent of miRNA regulation. Consistently, in 3T3 cells which do not express miR‐290/302 family of miRNAs, knocking down Mbnl1/2 downregulated six out of eight miR‐294 targets that were bound and upregulated by Mbnl1/2 in ESCs (Fig 7F). Together, these data demonstrate that MBNL proteins bound mRNAs of many miR‐294 targets and promoted their expression to counteract miR‐294's function in regulating proliferation, apoptosis, and EMT.
Figure 7. Mbnl1/2 bind and promote the expression of key miR‐294 targets.

- RIP‐qPCR analysis of key miR‐294 targets in regulating proliferation, apoptosis, and EMT. ESCs were harvested ˜48 h after overexpression. Data were normalized to β‐actin and then to RNA pulled down in GFP overexpressing ESCs. Shown are mean ± SD, n = 3. P values are as indicated. Unpaired two‐tailed Student's t‐test.
- RT‐qPCR analysis of key miR‐294 targets in regulating proliferation, apoptosis, and EMT. ESCs were harvested ˜48 h after overexpression. Data were normalized to β‐actin and then to GFP overexpressing ESCs. Shown are mean ± SD, n = 3. P values are as indicated. Unpaired two‐tailed Student's t‐test.
- Luciferase assay for 3′UTRs of Cdkn1a and Lats2. The 3′UTRs of Cdkn1a and Lats2 were cloned in pGL3‐basic vectors. Renilla was used as transfection control. Data were normalized to empty vectors and then to GFP overexpressing ESCs. Shown are mean ± SD, n = 4. P values are as indicated. Unpaired two‐tailed Student's t‐test.
- Luciferase assay for 3′UTRs of Rhoc, Tgfbr2, and Vim. The 3′UTRs of Rhoc, Tgfbr2, and Vim were cloned into pSicheck2 vectors. Renilla was used as transfection control. Data were normalized to empty vectors and then to GFP overexpressing ESCs. Shown are mean ± SD, n = 4. P values are as indicated. Unpaired two‐tailed Student's t‐test.
- Luciferase assay for 3′UTR of Tgfbr2 with miR‐294 targeting sites mutated. Renilla was used as transfection control. Data were normalized to empty vectors and then to wild‐type 3′UTR reporter in GFP overexpressing ESCs. Shown are mean ± SD, n = 4. P values are as indicated. Unpaired two‐tailed Student's t‐test.
- RT–PCR analysis of selected key miR‐294 targets in control or siMbnl1/2 transfected 3T3 cells. The β‐actin gene was used as a control. Data were normalized to the mRNA level of control‐transfected 3T3 cells. Data are presented as mean ± SD, n = 3. P values are as indicated. Unpaired two‐tailed Student's t‐test.
Discussion
How different layers of posttranscriptional regulation are coordinated to achieve cell type‐specific gene expression program is not well understood. Here we show that miR‐290/302 family of miRNAs and their targets MBNL splicing factors crosstalk with each other to achieve ESC‐specific splicing and gene expression program (Fig 8A and B). Through high‐throughput sequencing and bioinformatics analysis, we identified 578 differentially regulated alternative splicing events between Dgcr8 KO and wild‐type ESCs. Around 70% of these differentially regulated events were restored by the introduction of miR‐290/302 family of miRNAs in Dgcr8 KO ESCs. Interestingly, we found miR‐290/302 family of miRNAs shape the expression landscape of RBPs and SFs through both indirect mechanism to globally promote the transcription of RBPs and SFs and direct mechanism to repress a small number of predicted targets including Mbnl1 and Mbnl2. We further showed that around 60% of miR‐290/302‐dependent alternative splicing events are at least partially caused by the repression of Mbnl1 and Mbnl2. Interestingly, miR‐290/302 repressed the expression of Mbnl1/2 through both posttranscriptional and epigenetic (i.e., PRC2 binding) mechanisms. In addition, miR‐290/302 suppressed the expression of Mbd2_L by modulating the alternative last exon usage, which is opposed by Mbnl1/2. Surprisingly, we found that overexpressing Mbnl1 or Mbnl2 promotes the expression of many key targets of miR‐294, therefore counteracting miR‐294's function in regulating proliferation, apoptosis, and EMT. Mechanistically, we discovered that MBNL proteins bind the majority of selected key targets of miR‐294 and upregulate the expression of these targets through miRNA independent function. Altogether, our study reveals extensive and complex crosstalk between miRNAs and splicing factors in regulating alternative splicing and gene expression program for cell fate determination and has important implications for studying miRNA regulation, development, and diseases.
Figure 8. Summary graph for opposing regulation of alternative splicing and cellular functions by miR‐294 and Mbnl1/2 in ESCs.

- Regulation of alternative splicing program by MBNL and miR‐294 in ESCs.
- MBNL proteins upregulate the expression of key miR‐294 targets to repress proliferation and promote apoptosis and EMT.
The knockout of Dgcr8 or Dicer1 led to global downregulation of RBPs and SFs in ESCs. This phenomenon is reminiscent of global decrease of lincRNAs in Dicer1 KO ESCs 39. In that study, Zheng et al found that the expression of lincRNAs is mainly regulated through Dicer1/miR‐290/cMyc axis. MYC is known to promote transcription elongation by stimulating the recruitment of elongation factor P‐TEFb at actively transcribed genes 45, 46. However, our analysis showed that RBPs and SFs were not globally downregulated in Myc knockout ESCs (data not shown), therefore strongly arguing for the existence of other mechanism by miR‐294 to promote transcription elongation. Future work is warranted to identify direct targets of miR‐294 that regulate transcription elongation of RBPs and SFs. Identifying these targets will provide insights for both transcriptional and alternative splicing regulation.
Our study reveals two interesting examples of miRNA–mRNA target repression models. miRNAs are known to posttranscriptionally repress the expression and translation of their mRNA targets. However, we found that miR‐294 also inhibits the transcription of Mbnl1/2 through promoting the binding of PRC2 to their promoter regions. In addition, we found that miR‐294 represses the production of long isoform of Mbd2 through affecting alternative polyadenylation process. Therefore, on top of posttranscriptional mechanisms, miRNAs may achieve a high degree of repression for specific targets through coordinating additional mechanisms. Whether these are just anecdotic examples or represent a general phenomenon for many other miRNAs and their target genes are interesting questions to address in future.
Around 30% alternative splicing events differentially regulated between wild‐type and Dgcr8 KO ESCs were not rescued by miR‐290/302. How these splicing events are regulated is an open question. It could be through other ESC expressed miRNAs or non‐canonical function of DGCR8 protein binding to pre‐mRNAs 47. In addition, among hundreds of RBPs and SFs that are directly or indirectly regulated by miR‐294, our study only dissected the function of Mbnl1/2. Since a large number of alternative splicing events were not fully rescued by knocking down Mbnl1/2, future work should investigate the role of other RBPs and SFs in regulating alternative splicing mediated by miR‐294. More importantly, how alternative splicing contributes to the function of miR‐290/302 in the self‐renewal and pluripotency of ESCs warrants further investigation. Some of alternative splicing events have been previously shown to be functional in ESCs; for example, different splicing isoforms of Mbd2 and Foxp1 opposingly regulate ESC self‐renewal and reprogramming 19, 20. Future work should elucidate the function of different isoforms of other important genes in ESCs and during reprogramming. More interestingly, our study demonstrates that MBNL proteins directly bind mRNAs of many key miR‐294 targets to promote their expression through alternative splicing‐independent function. Early differentiation of ESCs is accompanied with the decrease in proliferation 48 and the increase in apoptosis 49 and EMT 50. These processes are also actively involved in the induction of pluripotency during reprogramming 51. The function of these processes and related factors in ESC differentiation is only beginning to be revealed. miR‐294 family of miRNAs promotes proliferation and inhibits apoptosis and EMT by repressing corresponding targets. By opposing miR‐294's repression on these targets, Mbnl1/2 might fine tunely modulate the differentiation kinetics and/or even the direction of differentiation, which could be important for the establishment of certain lineages. How extensive this type of regulation by MBNL and its functional roles in development, reprogramming, and diseases (e.g., myotonic dystrophy) are worthy of future investigation. To answer these important questions, we propose to identify cofactors of Mbnl1/2 in regulating mRNA level versus regulating mRNA splicing. Knocking out their cofactors specific for regulating mRNA level during ESC differentiation may reveal the importance of this regulation and identify specific lineages requiring this type of regulation by Mbnl1/2. Furthermore, the similar cross‐regulation between miRNAs, miRNA targets, and other alternative splicing regulators should also be examined in development, disease, and reprogramming. These studies will provide novel insights on the control of alternative splicing and non‐canonical function of splicing regulators in general and may lead to the invention of innovative means to manipulate stem cells and treat diseases.
Materials and Methods
Cell culture and transfection of small RNAs
Mouse ESCs were grown on gelatin‐coated plates or irradiated mouse embryonic fibroblast feeder cells (MEFs) in 15% FBS as previously described. NIH 3T3 cells were grown in DMEM supplemented with 10% FBS. siRNAs or miRNA mimics (Dharmacon, ThermoFisher) were transfected at 25 or 50 nM using the DharmaFECT1 transfection reagent (Dharmacon, ThermoFisher) following the manufacturer's protocol. Sequences of siRNAs and miRNAs are listed in Appendix Table S1. On day 3 after transfection, cells were processed for RT–PCR, Western blot analysis, or luciferase assay.
RNA extraction, RT–qPCR, and semi‐quantitative PCR
Total RNA was extracted following standard Trizol protocol (Invitrogen). Samples were centrifuged at > 12,000 g instead of 7,500 g to preserve small RNAs. RT–PCR was performed using SYBR Green mix (Vazyme Biotech, Nanjing). To analyze alternative splicing by semi‐quantitative PCR, the number of amplification cycles was 22 for Gapdh, and 27–32 for all other transcripts analyzed. Reaction products were separated on 1% agarose gels. Isoform abundance was quantified by ImageJ. Sequences for PCR primers are shown in Appendix Table S2–S4.
Western blot analysis
Proteins were extracted using lysis buffer (Kangweishiji, Beijing) containing 1× protease inhibitor usually 48 h after transfection or plating. Antibodies against Mbnl1 (sc‐47740) and Mbnl2 (sc‐136167) were from Santa Cruz Biotechnology, and antibodies against tubulin (T6557) were from Sigma.
Cell cycle and apoptosis analyses
For cell cycle analysis, around 0.8 million cells were plated in ESC media containing 1 μM doxycycline in a 6‐cm dish, cells were collected and fixed by 90% ethanol after growing for ~24 h. For apoptosis analysis, around 0.2 million cells were plated in ESC media containing 1 μM doxycycline in a well of six‐well plates and grown for ~48 h. Cell cycle analysis was performed as previously described 29. For apoptosis assay, cells were trypsinized and labeled with DAPI and FITC‐Annexin V (Annexin) and analyzed by flow cytometry. The fraction of DAPI‐negative and Annexin V‐positive cells in the total population was calculated to quantify the early stage of apoptosis.
UV crosslink RIP
The cells grown in a 10‐cm dish were crosslinked with 254 nm UV (400 mJ/cm2). Cells were collected and lysed by lysis buffer (50 mM Tris–HCl, pH 7.4, with 150 mM NaCl, and 1% Triton X‐100, 5% glycerol, supplemented with 1 mM DTT, 1 mM PMSF, 1:500 PI cocktail, and 400 U/ml RNase inhibitor). The lysate was treated with DNase I at 37°C for 10 min, then was centrifuged at 13,800 g for 20 min at 4°C. The supernatant was incubated with 20 μl protein A/G Dynabeads (Invitrogen) at 4°C for 1 hr to avoid non‐specific binding proteins. Meanwhile, 5 μg Flag antibody (F1804, Sigma) was incubated with 30 μl protein G Dynabeads at room temperature for 30 min in the dilution buffer (50 mM Tris–Cl, pH 7.4, 150 mM NaCl, 1 mM EDTA, 0.1% Triton X‐100); 100 ng yeast total extract was then added to block beads for at least 1 h before use. Pre‐cleared lysate was added to the clean Flag‐beads complex, and mixed gently overnight at 4°C on a shaker. After incubation, samples were washed five times with 0.5 ml of IP200 buffer (20 mM Tris–Cl pH7.4, 200 mM NaCl, 1 mM EDTA, 0.3 Triton X‐100, 5% glycerol), followed by digestion with Proteinase K for 1 h. RNAs were then extracted with Trizol and processed for RT–qPCR analysis as described above.
Luciferase reporter assay
Plasmid transfection and luciferase assay were performed essentially as described previously 31. Plasmids were transfected approximately 16 h after Mbnl1/2 overexpression. ESCs were then lysed approximately 52–56 h after Mbnl1/2 overexpression. The 3′UTRs for Mbnl1 and Mbnl2 were amplified from genomic DNA and cloned into the NotI and XhoI sites in psiCheck‐2 vector (Promega). All other luciferase constructs were from our previous studies 31, 43. Sequences of cloning and mutation primers are listed in Appendix Table S5.
RNA‐seq and bioinformatics analysis
Total RNA was subjected to two rounds of purification using poly‐T oligo‐attached magnetic beads before the synthesis of double‐stranded (ds) cDNA. RNA from RIP experiment was directly used for the synthesis of ds cDNA. The ds cDNA was ligated to adaptors and sequenced using Illumina Genome Analyzer (Novogene). Desktop Application. R 3.1.1 and in‐house perl scripts were used for the generation of graphs and related analysis.
Statistical analysis
The data were presented as mean ± SD except where indicated otherwise. We performed two‐tailed unpaired Student's t‐test to determine statistical significance except for analysis shown in the boxplot graph, for which we performed two‐tailed Wilcoxon signed‐rank test. P value < 0.05 was considered as statistically significant. Statistic tests are also indicated in figure legends.
Availability of data and materials
All data generated or analyzed during this study are included in the manuscript and its supplementary information files. Original sequencing data used and/or analyzed during the current study are available from the corresponding author on reasonable request. RNA‐seq data have been deposited in the GEO database repository with the data set identifier GSE111739.
Author contributions
D‐RW performed all the experiments with help from other authors. K‐LG and XF performed bioinformatics analyses. X‐WW, L‐QL, and X‐SZ helped with Eed knockout experiments. W‐TG helped with RNA‐seq experiments. J‐CY and HZ helped with MBNL1/2 Western blotting experiments. All authors were involved in the interpretation of data. YW and JH conceived and supervised the project, and YW wrote the manuscript with help from JH, D‐RW, and K‐LG.
Conflict of interest
The authors declare that they have no conflict of interest.
Supporting information
Appendix
Expanded View Figures PDF
Table EV1
Table EV2
Table EV3
Review Process File
Source Data Figure 3
Source Data Figure 5
Acknowledgements
We would like to thank members of Wang laboratory for critical reading and discussion of the manuscript. This study was supported by The National Key Research and Development Program of China [2016YFA0100701 and 2017YFA0504400] and the National Natural Science Foundation of China [31471222, 31622033, and 91640116] to YW and JH.
EMBO Reports (2018) 19: e45657
Contributor Information
Jingyi Hui, Email: jyhui@sibcb.ac.cn.
Yangming Wang, Email: yangming.wang@pku.edu.cn.
References
- 1. Lee Y, Rio DC (2015) Mechanisms and regulation of alternative pre‐mRNA splicing. Annu Rev Biochem 84: 291–323 [DOI] [PMC free article] [PubMed] [Google Scholar]
- 2. Baralle FE, Giudice J (2017) Alternative splicing as a regulator of development and tissue identity. Nat Rev Mol Cell Biol 18: 437–451 [DOI] [PMC free article] [PubMed] [Google Scholar]
- 3. Jangi M, Sharp PA (2014) Building robust transcriptomes with master splicing factors. Cell 159: 487–498 [DOI] [PMC free article] [PubMed] [Google Scholar]
- 4. Fiszbein A, Kornblihtt AR (2017) Alternative splicing switches: important players in cell differentiation. BioEssays 39: 1600157 [DOI] [PubMed] [Google Scholar]
- 5. Kalsotra A, Cooper TA (2011) Functional consequences of developmentally regulated alternative splicing. Nat Rev Genet 12: 715–729 [DOI] [PMC free article] [PubMed] [Google Scholar]
- 6. Dvinge H, Kim E, Abdel‐Wahab O, Bradley RK (2016) RNA splicing factors as oncoproteins and tumour suppressors. Nat Rev Cancer 16: 413–430 [DOI] [PMC free article] [PubMed] [Google Scholar]
- 7. Chabot B, Shkreta L (2016) Defective control of pre‐messenger RNA splicing in human disease. J Cell Biol 212: 13–27 [DOI] [PMC free article] [PubMed] [Google Scholar]
- 8. Raj B, Blencowe BJ (2015) Alternative splicing in the mammalian nervous system: recent insights into mechanisms and functional roles. Neuron 87: 14–27 [DOI] [PubMed] [Google Scholar]
- 9. Scotti MM, Swanson MS (2016) RNA mis‐splicing in disease. Nat Rev Genet 17: 19–32 [DOI] [PMC free article] [PubMed] [Google Scholar]
- 10. Cooper TA, Wan L, Dreyfuss G (2009) RNA and disease. Cell 136: 777–793 [DOI] [PMC free article] [PubMed] [Google Scholar]
- 11. Fu XD, Ares M Jr (2014) Context‐dependent control of alternative splicing by RNA‐binding proteins. Nat Rev Genet 15: 689–701 [DOI] [PMC free article] [PubMed] [Google Scholar]
- 12. Sun S, Zhang Z, Fregoso O, Krainer AR (2012) Mechanisms of activation and repression by the alternative splicing factors RBFOX1/2. RNA 18: 274–283 [DOI] [PMC free article] [PubMed] [Google Scholar]
- 13. Licatalosi DD, Mele A, Fak JJ, Ule J, Kayikci M, Chi SW, Clark TA, Schweitzer AC, Blume JE, Wang X et al (2008) HITS‐CLIP yields genome‐wide insights into brain alternative RNA processing. Nature 456: 464–469 [DOI] [PMC free article] [PubMed] [Google Scholar]
- 14. Han H, Irimia M, Ross PJ, Sung HK, Alipanahi B, David L, Golipour A, Gabut M, Michael IP, Nachman EN et al (2013) MBNL proteins repress ES‐cell‐specific alternative splicing and reprogramming. Nature 498: 241–245 [DOI] [PMC free article] [PubMed] [Google Scholar]
- 15. Grosso AR, Gomes AQ, Barbosa‐Morais NL, Caldeira S, Thorne NP, Grech G, von Lindern M, Carmo‐Fonseca M (2008) Tissue‐specific splicing factor gene expression signatures. Nucleic Acids Res 36: 4823–4832 [DOI] [PMC free article] [PubMed] [Google Scholar]
- 16. Yeo G, Holste D, Kreiman G, Burge CB (2004) Variation in alternative splicing across human tissues. Genome Biol 5: R74 [DOI] [PMC free article] [PubMed] [Google Scholar]
- 17. Wang ET, Ward AJ, Cherone JM, Giudice J, Wang TT, Treacy DJ, Lambert NJ, Freese P, Saxena T, Cooper TA et al (2015) Antagonistic regulation of mRNA expression and splicing by CELF and MBNL proteins. Genome Res 25: 858–871 [DOI] [PMC free article] [PubMed] [Google Scholar]
- 18. Zhang C, Frias MA, Mele A, Ruggiu M, Eom T, Marney CB, Wang H, Licatalosi DD, Fak JJ, Darnell RB (2010) Integrative modeling defines the Nova splicing‐regulatory network and its combinatorial controls. Science 329: 439–443 [DOI] [PMC free article] [PubMed] [Google Scholar]
- 19. Gabut M, Samavarchi‐Tehrani P, Wang X, Slobodeniuc V, O'Hanlon D, Sung HK, Alvarez M, Talukder S, Pan Q, Mazzoni EO et al (2011) An alternative splicing switch regulates embryonic stem cell pluripotency and reprogramming. Cell 147: 132–146 [DOI] [PubMed] [Google Scholar]
- 20. Lu Y, Loh YH, Li H, Cesana M, Ficarro SB, Parikh JR, Salomonis N, Toh CX, Andreadis ST, Luckey CJ et al (2014) Alternative splicing of MBD2 supports self‐renewal in human pluripotent stem cells. Cell Stem Cell 15: 92–101 [DOI] [PMC free article] [PubMed] [Google Scholar]
- 21. Pritsker M, Doniger TT, Kramer LC, Westcot SE, Lemischka IR (2005) Diversification of stem cell molecular repertoire by alternative splicing. Proc Natl Acad Sci USA 102: 14290–14295 [DOI] [PMC free article] [PubMed] [Google Scholar]
- 22. Salomonis N, Schlieve CR, Pereira L, Wahlquist C, Colas A, Zambon AC, Vranizan K, Spindler MJ, Pico AR, Cline MS et al (2010) Alternative splicing regulates mouse embryonic stem cell pluripotency and differentiation. Proc Natl Acad Sci USA 107: 10514–10519 [DOI] [PMC free article] [PubMed] [Google Scholar]
- 23. Ha M, Kim VN (2014) Regulation of microRNA biogenesis. Nat Rev Mol Cell Biol 15: 509–524 [DOI] [PubMed] [Google Scholar]
- 24. Jonas S, Izaurralde E (2015) Towards a molecular understanding of microRNA‐mediated gene silencing. Nat Rev Genet 16: 421–433 [DOI] [PubMed] [Google Scholar]
- 25. Bartel DP (2009) MicroRNAs: target recognition and regulatory functions. Cell 136: 215–233 [DOI] [PMC free article] [PubMed] [Google Scholar]
- 26. Marson A, Levine SS, Cole MF, Frampton GM, Brambrink T, Johnstone S, Guenther MG, Johnston WK, Wernig M, Newman J et al (2008) Connecting microRNA genes to the core transcriptional regulatory circuitry of embryonic stem cells. Cell 134: 521–533 [DOI] [PMC free article] [PubMed] [Google Scholar]
- 27. Babiarz JE, Ruby JG, Wang Y, Bartel DP, Blelloch R (2008) Mouse ES cells express endogenous shRNAs, siRNAs, and other microprocessor‐independent, Dicer‐dependent small RNAs. Genes Dev 22: 2773–2785 [DOI] [PMC free article] [PubMed] [Google Scholar]
- 28. Cao Y, Guo WT, Tian S, He X, Wang XW, Liu X, Gu KL, Ma X, Huang D, Hu L et al (2015) miR‐290/371‐Mbd2‐Myc circuit regulates glycolytic metabolism to promote pluripotency. EMBO J 34: 609–623 [DOI] [PMC free article] [PubMed] [Google Scholar]
- 29. Wang Y, Melton C, Li YP, Shenoy A, Zhang XX, Subramanyam D, Blelloch R (2013) miR‐294/miR‐302 promotes proliferation, suppresses G1‐S restriction point, and inhibits ESC differentiation through separable mechanisms. Cell Rep 4: 99–109 [DOI] [PMC free article] [PubMed] [Google Scholar]
- 30. Zheng GX, Ravi A, Calabrese JM, Medeiros LA, Kirak O, Dennis LM, Jaenisch R, Burge CB, Sharp PA (2011) A latent pro‐survival function for the mir‐290‐295 cluster in mouse embryonic stem cells. PLoS Genet 7: e1002054 [DOI] [PMC free article] [PubMed] [Google Scholar]
- 31. Guo WT, Wang XW, Yan YL, Li YP, Yin X, Zhang Q, Melton C, Shenoy A, Reyes NA, Oakes SA et al (2015) Suppression of epithelial‐mesenchymal transition and apoptotic pathways by miR‐294/302 family synergistically blocks let‐7‐induced silencing of self‐renewal in embryonic stem cells. Cell Death Differ 22: 1158–1169 [DOI] [PMC free article] [PubMed] [Google Scholar]
- 32. Gu KL, Zhang Q, Yan Y, Li TT, Duan FF, Hao J, Wang XW, Shi M, Wu DR, Guo WT et al (2016) Pluripotency‐associated miR‐290/302 family of microRNAs promote the dismantling of naive pluripotency. Cell Res 26: 350–366 [DOI] [PMC free article] [PubMed] [Google Scholar]
- 33. Graham B, Marcais A, Dharmalingam G, Carroll T, Kanellopoulou C, Graumann J, Nesterova TB, Bermange A, Brazauskas P, Xella B et al (2016) MicroRNAs of the miR‐290‐295 family maintain bivalency in mouse embryonic stem cells. Stem Cell Rep 6: 635–642 [DOI] [PMC free article] [PubMed] [Google Scholar]
- 34. Kanellopoulou C, Gilpatrick T, Kilaru G, Burr P, Nguyen CK, Morawski A, Lenardo MJ, Muljo SA (2015) Reprogramming of polycomb‐mediated gene silencing in embryonic stem cells by the miR‐290 family and the methyltransferase Ash1l. Stem Cell Rep 5: 971–978 [DOI] [PMC free article] [PubMed] [Google Scholar]
- 35. Katz Y, Wang ET, Airoldi EM, Burge CB (2010) Analysis and design of RNA sequencing experiments for identifying isoform regulation. Nat Methods 7: 1009–1015 [DOI] [PMC free article] [PubMed] [Google Scholar]
- 36. Eisen MB, Spellman PT, Brown PO, Botstein D (1998) Cluster analysis and display of genome‐wide expression patterns. Proc Natl Acad Sci USA 95: 14863–14868 [DOI] [PMC free article] [PubMed] [Google Scholar]
- 37. Gerstberger S, Hafner M, Tuschl T (2014) A census of human RNA‐binding proteins. Nat Rev Genet 15: 829–845 [DOI] [PMC free article] [PubMed] [Google Scholar]
- 38. Calabrese JM, Seila AC, Yeo GW, Sharp PA (2007) RNA sequence analysis defines Dicer's role in mouse embryonic stem cells. Proc Natl Acad Sci USA 104: 18097–18102 [DOI] [PMC free article] [PubMed] [Google Scholar]
- 39. Zheng GX, Do BT, Webster DE, Khavari PA, Chang HY (2014) Dicer‐microRNA‐Myc circuit promotes transcription of hundreds of long noncoding RNAs. Nat Struct Mol Biol 21: 585–590 [DOI] [PMC free article] [PubMed] [Google Scholar]
- 40. Han H, Braunschweig U, Gonatopoulos‐Pournatzis T, Weatheritt RJ, Hirsch CL, Ha KC, Radovani E, Nabeel‐Shah S, Sterne‐Weiler T, Wang J et al (2017) Multilayered control of alternative splicing regulatory networks by transcription factors. Mol Cell 65: 539–553 e537 [DOI] [PubMed] [Google Scholar]
- 41. Hendrich B, Bird A (1998) Identification and characterization of a family of mammalian methyl‐CpG binding proteins. Mol Cell Biol 18: 6538–6547 [DOI] [PMC free article] [PubMed] [Google Scholar]
- 42. Wang ET, Cody NA, Jog S, Biancolella M, Wang TT, Treacy DJ, Luo S, Schroth GP, Housman DE, Reddy S et al (2012) Transcriptome‐wide regulation of pre‐mRNA splicing and mRNA localization by muscleblind proteins. Cell 150: 710–724 [DOI] [PMC free article] [PubMed] [Google Scholar]
- 43. Wang Y, Baskerville S, Shenoy A, Babiarz JE, Baehner L, Blelloch R (2008) Embryonic stem cell‐specific microRNAs regulate the G1‐S transition and promote rapid proliferation. Nat Genet 40: 1478–1483 [DOI] [PMC free article] [PubMed] [Google Scholar]
- 44. Subramanyam D, Lamouille S, Judson RL, Liu JY, Bucay N, Derynck R, Blelloch R (2011) Multiple targets of miR‐302 and miR‐372 promote reprogramming of human fibroblasts to induced pluripotent stem cells. Nat Biotechnol 29: 443–448 [DOI] [PMC free article] [PubMed] [Google Scholar]
- 45. Nie Z, Hu G, Wei G, Cui K, Yamane A, Resch W, Wang R, Green DR, Tessarollo L, Casellas R et al (2012) c‐Myc is a universal amplifier of expressed genes in lymphocytes and embryonic stem cells. Cell 151: 68–79 [DOI] [PMC free article] [PubMed] [Google Scholar]
- 46. Lin CY, Loven J, Rahl PB, Paranal RM, Burge CB, Bradner JE, Lee TI, Young RA (2012) Transcriptional amplification in tumor cells with elevated c‐Myc. Cell 151: 56–67 [DOI] [PMC free article] [PubMed] [Google Scholar]
- 47. Macias S, Plass M, Stajuda A, Michlewski G, Eyras E, Caceres JF (2012) DGCR8 HITS‐CLIP reveals novel functions for the microprocessor. Nat Struct Mol Biol 19: 760–766 [DOI] [PMC free article] [PubMed] [Google Scholar]
- 48. Li VC, Kirschner MW (2014) Molecular ties between the cell cycle and differentiation in embryonic stem cells. Proc Natl Acad Sci USA 111: 9503–9508 [DOI] [PMC free article] [PubMed] [Google Scholar]
- 49. Wang ES, Reyes NA, Melton C, Huskey NE, Momcilovic O, Goga A, Blelloch R, Oakes SA (2015) Fas‐activated mitochondrial apoptosis culls stalled embryonic stem cells to promote differentiation. Curr Biol 25: 3110–3118 [DOI] [PMC free article] [PubMed] [Google Scholar]
- 50. Gill JG, Langer EM, Lindsley RC, Cai M, Murphy TL, Kyba M, Murphy KM (2011) Snail and the microRNA‐200 family act in opposition to regulate epithelial‐to‐mesenchymal transition and germ layer fate restriction in differentiating ESCs. Stem Cells 29: 764–776 [DOI] [PMC free article] [PubMed] [Google Scholar]
- 51. Buganim Y, Faddah DA, Jaenisch R (2013) Mechanisms and models of somatic cell reprogramming. Nat Rev Genet 14: 427–439 [DOI] [PMC free article] [PubMed] [Google Scholar]
Associated Data
This section collects any data citations, data availability statements, or supplementary materials included in this article.
Supplementary Materials
Appendix
Expanded View Figures PDF
Table EV1
Table EV2
Table EV3
Review Process File
Source Data Figure 3
Source Data Figure 5
Data Availability Statement
All data generated or analyzed during this study are included in the manuscript and its supplementary information files. Original sequencing data used and/or analyzed during the current study are available from the corresponding author on reasonable request. RNA‐seq data have been deposited in the GEO database repository with the data set identifier GSE111739.