

Abstract
Mitochondria are double‐membrane‐bound organelles that constantly change shape through membrane fusion and fission. Outer mitochondrial membrane fusion is controlled by Mitofusin, whose molecular architecture consists of an N‐terminal GTPase domain, a first heptad repeat domain (HR1), two transmembrane domains, and a second heptad repeat domain (HR2). The mode of action of Mitofusin and the specific roles played by each of these functional domains in mitochondrial fusion are not fully understood. Here, using a combination of in situ and in vitro fusion assays, we show that HR1 induces membrane fusion and possesses a conserved amphipathic helix that folds upon interaction with the lipid bilayer surface. Our results strongly suggest that HR1 facilitates membrane fusion by destabilizing the lipid bilayer structure, notably in membrane regions presenting lipid packing defects. This mechanism for fusion is thus distinct from that described for the heptad repeat domains of SNARE and viral proteins, which assemble as membrane‐bridging complexes, triggering close membrane apposition and fusion, and is more closely related to that of the C‐terminal amphipathic tail of the Atlastin protein.
Keywords: amphipathic helix, fusion, membrane, mitochondria, Mitofusin
Subject Categories: Membrane & Intracellular Transport
Introduction
Membrane fusion allows communication between two compartments delimited by lipid bilayer structures. Fusion occurs during many fundamental physiological processes, including viral entry into cells, inter‐organellar, and inter‐cellular communications 1. In order to fuse, membranes must first be brought into very close proximity and then remodeled/destabilized to allow the merging of their lipid bilayer. The sequence of events leading to lipid bilayer fusion often includes the passage through a hemifusion intermediate structure, in which the outer lipid monolayers are mixed while the inner monolayers remain separated 2. Biological membrane fusion uses specialized proteins that lower the successive energy barriers of the intermediate states on the fusion pathway.
Soluble N‐ethylmaleimide‐sensitive factor attachment protein receptor (SNARE) proteins and fusion proteins from enveloped viruses, notably the hemagglutinin (HA) protein from the influenza virus, constitute the best described fusion machineries, which both use the energy of protein folding to mediate membrane fusion. SNARE proteins are membrane‐anchored, coiled‐coil forming proteins, involved in intracellular vesicle traffic and exocytosis 3. SNARE‐mediated fusion occurs when the heptad repeat domains of the vesicular (v‐) and target membrane (t‐) SNARE proteins assemble in a zipper‐like fashion (from the membrane‐distal parts to the membrane‐proximal parts of the proteins) to form a highly stable membrane‐bridging coiled‐coil complex that pulls the membranes close together and triggers their fusion 4, 5, 6, 7, 8. Viral fusion proteins are transmembrane proteins residing in the viral envelope membrane, and displaying an initially closed and inactive conformation, in which a fusion peptide is sequestered. During viral infection, the fusion protein opens up and releases the fusion peptide, which anchors the viral envelope to the target membrane. The viral protein then folds back on itself, which brings the viral and target membranes in close proximity. This membrane apposition effect combined with lipid bilayer perturbation by the fusion peptide leads to membrane fusion 9. In addition to these heterotypic fusion events, homotypic fusion events also occur within cells such as those that control the dynamics and morphology of endoplasmic reticulum (ER) and mitochondria. The homotypic fusion of ER tubules is mediated by Atlastin, a large membrane‐anchored GTPase protein from the dynamin superfamily. Recent structural and biochemical data suggest that Atlastin mediates ER membrane docking through GTP‐dependent trans‐dimerization of its GTPase domain, and ER membrane fusion through lipid bilayer destabilization by a C‐terminal amphipathic helix 10.
Mitochondria also form a network of highly dynamic organelles, which undergo frequent cycles of fusion and fission within cells. The balance between membrane fusion and fission defines mitochondrial morphology and is important for normal mitochondrial and cellular function 11. Dysfunctions of mitochondrial dynamics are associated with several major neurodegenerative disorders, including Parkinson, Alzheimer, and Huntington diseases 12. Mitochondrial fusion involves four membranes (an inner and an outer membrane for each mitochondrion) that must fuse in a coordinated manner. The key molecular players of mitochondrial fusion have been identified but the underlying molecular mechanisms of the fusion event remain largely unknown. Like ER fusion, mitochondrial fusion is controlled by membrane‐anchored dynamin‐related proteins: optic atrophy 1 (OPA1) in the inner membrane and Mitofusins in the outer membrane 11, 13. Mammalian cells possess two Mitofusin proteins (Mfn1 and Mfn2) that display highly similar primary structures, and are both involved in mitochondrial fusion 14, 15, 16. Mitofusins are transmembrane proteins, containing an N‐terminal GTPase domain, and whose U‐shaped bipartite transmembrane (TM) region spans the outer mitochondrial membrane twice 15. As a result, both the N‐ and the C‐terminal portions of Mitofusins face the cytosol. The two TM domains of Mitofusins are flanked by two heptad repeat domains (HR1 and HR2) with the potential to form coiled‐coil structures (Fig 1A and Appendix Fig S1). Mutations in any of these functional domains impair Mitofusin function, but their exact role in mitochondrial fusion remains unknown 15, 17, 18, 19, 20. Structural and in situ studies showed that the HR2 domain of Mfn1 can form an antiparallel coiled‐coil dimer, suggesting a role in mitochondrial docking 18. A recent study questioned the cytosolic orientation of the HR2 domain and proposed that it resides instead in the space between outer and inner mitochondrial membranes, where it can form cis‐complexes driving Mitofusin oligomerization 21. Expression of Mitofusin mutants lacking GTP binding activity abolished mitochondrial fusion in situ 16, and in vitro fusion between isolated mitochondria required GTP hydrolysis 22, 23, showing that a functional GTPase domain is essential for mitochondrial fusion. Because dynamin‐related proteins are known for their membrane tubulation and constriction properties depending on their GTPase domain 24, it was suggested that the N‐terminal GTPase domain of Mitofusins could be involved in mitochondrial membrane remodeling events 1, 22, 25. Two recent X‐ray structural studies of the GTPase domain of Mfn1 linked to the HR2 domain via an artificial flexible linker revealed a closed conformation closely resembling that of the membrane‐distal region of the bacterial dynamin‐like protein (BDLP) in its GDP‐bound state 26, 27. In addition, this GTPase‐HR2 fragment was shown to dimerize in the presence of GTP. By analogy with BDLP, which transits from an open to a closed conformation upon GTP hydrolysis, it was therefore proposed that Mfn1 could bring membranes in close apposition through GTP‐dependent conformational changes of trans‐Mfn1 dimers. Despite these recent insights into how Mitofusin mediates mitochondrial membrane docking, the molecular trigger of the fusion event remains to be identified. Notably, the exact function of the HR1 domain of Mitofusins in outer mitochondrial membrane fusion is still unknown. Recent works proposed that the HR1 domain of Mfn2 could allow the HR2 domain to adopt an active extended conformation 28, 29.
Figure 1. The HR1 and HR2 domains are required for Mitofusin function in mitochondrial fusion.
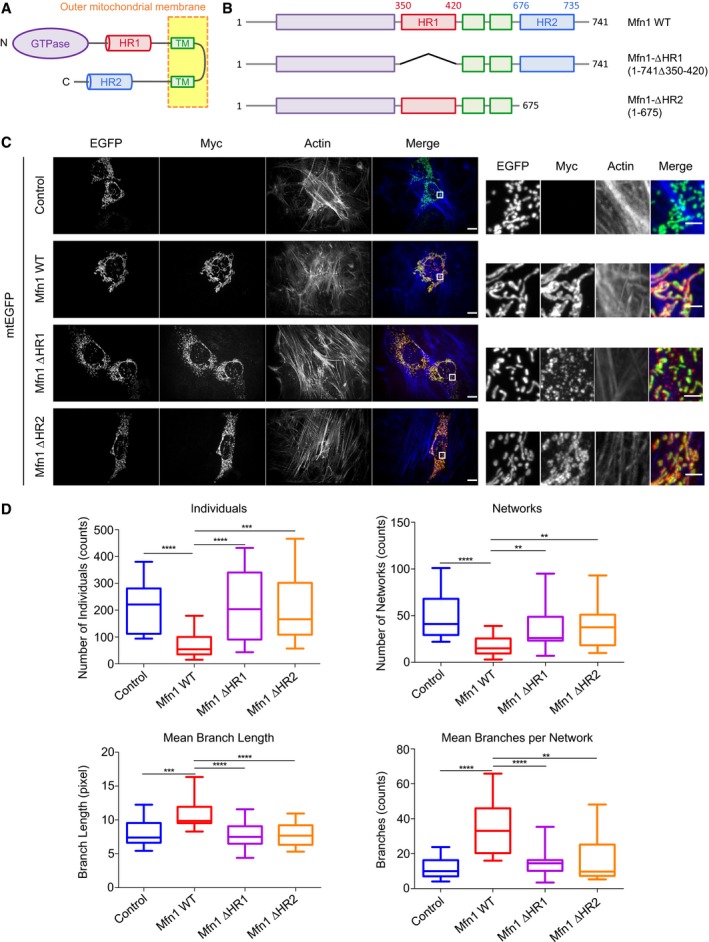
- Domain architecture of Mitofusin proteins. Mitofusins have an N‐terminal GTPase domain (in purple) and two heptad repeat domains (HR1 in red and HR2 in blue); these three domains face the cell cytosol and are anchored to the outer mitochondrial membrane via a bipartite transmembrane (TM) region (in green).
- Scheme of Mfn1 variants used for transfection of Mfn1 KO MEFs.
- Mfn1 KO MEFs were transfected with a plasmid expressing mtEGFP alone (control) or in combination with a plasmid expressing Mfn1‐Myc full length (Mfn1 WT), Mfn1‐Myc lacking the HR1 domain (Mfn1‐∆HR1), or Mfn1‐Myc lacking the HR2 domain (Mfn1‐∆HR2). Mfn1 variants were stained with an anti‐Myc antibody and actin was stained with Phalloidin. Co‐transfected cells were identified as those expressing both Mfn1 variants and mtEGFP on mitochondria. The right panels show magnified views of the boxed areas in the left panels. Mfn1 KO MEFs expressing Mfn1 WT display normal filamentous mitochondrial morphology, whereas expression of Mfn1‐∆HR1 or Mfn1‐∆HR2 cannot rescue mitochondrial morphology. The scale bar is 10 μm for the left panels and 2 μm for the right panels.
- The morphology of the mitochondrial network was quantitatively analyzed using the MiNA Image J macro tool (˜ 30 cells for each Mfn1 variant; n = 3–4 independent experiments). Mitochondrial morphologies were classified as either individuals (structures with no junction, which can be puncta or rods) or networks (structures with at least one junction and three branches). The program also calculated the mean length of rods and network branches, and the mean number of branches per network. Box plots represent the 25th and 75th percentiles around the median, and the whiskers represent the maximum and minimum values. **P ≤ 0.01, ***P ≤ 0.001, ****P ≤ 0.0001 by Mann–Whitney U‐test.
In vitro approaches using the reconstitution of fusion proteins into artificial membrane systems have proven very successful in elucidating the molecular mechanisms of various cellular fusion machineries, including SNARE, Atlastin, and viral proteins 6, 10, 30, 31, 32, 33, 34, 35. In this work, we sought to determine the role of the two heptad repeat domains (HR1 and HR2) of Mitofusin in membrane docking and fusion using a combination of in situ cell assays and in vitro reconstitution assays with liposomes mimicking the outer mitochondrial membrane. Expression of Mitofusin variants lacking specific protein fragments was used to reveal the importance of these fragments for mitochondrial fusion in situ. Membrane docking and fusion events were monitored in vitro through a combination of spectroscopy and electron microscopy assays. Conformational changes and biophysical/biochemical properties of HR1 and HR2, as they pertain to their capacity to mediate membrane fusion, were revealed using circular dichroism experiments, partitioning assays and in silico bioinformatics analysis of their sequence. Using these different approaches, we show that both the HR1 and the HR2 domains of Mitofusin have the capacity to mediate membrane docking. We also show that the HR1 domain possesses a conserved amphipathic helix that induces fusion by interacting with the lipid bilayer structure.
Results
The HR1 and HR2 domains are essential for Mitofusin‐mediated mitochondrial fusion
To investigate the importance of the heptad repeat domains of Mitofusin in mitochondrial fusion, we examined the properties of wild‐type and mutant Mfn1 proteins (Fig 1B) in mouse embryo fibroblasts devoid of endogenous Mfn1 (Mfn1 KO MEFs). In agreement with previous work 16, Mfn1 KO MEFs displayed largely fragmented mitochondria, and expression of wild‐type Mfn1 led to the appearance of elongated branched mitochondria (Fig 1C). In contrast, expression of Mfn1 molecules lacking the HR2 domain (Mfn1‐ΔHR2) did not restore the tubular morphology of the mitochondrial network (Fig 1C), confirming that the HR2 domain is essential for Mitofusin function 18. Remarkably, Mfn1 molecules lacking the HR1 domain (Mfn1‐ΔHR1) also failed to restore mitochondrial fusion and tubular mitochondrial morphology (Fig 1C). Western blot analysis of cell lysates revealed that all constructs were expressed at similar levels in Mfn1 KO MEFs (Appendix Fig S2A), and immunofluorescence microscopy showed that they were all strongly co‐localizing with an EGFP expressed in the mitochondrial matrix (Appendix Fig S2B), indicating that the observed phenotypes were not due to a default in expression level and/or mitochondrial targeting of Mfn1 mutants. To confirm the effect of wild‐type and mutant Mfn1 by unambiguous quantitative procedures, we used a recently developed method for quantitative analysis of mitochondrial morphology—the mitochondrial network analysis (MiNA) toolset—that allows one to (i) categorize mitochondrial morphologies into two different structures, either individuals (for isolated puncta or short filaments) or networks (for interconnected filaments), and (ii) evaluate the extent of branching and the length of the filaments 36. MiNA revealed that expression of wild‐type Mfn1 was associated with a decrease in the number of individuals and networks that was paralleled by an increase of mitochondrial length and of the number of branches per mitochondrial network (Fig 1D). In contrast, neither Mfn1‐ΔHR1 nor Mfn1‐ΔHR2 expression led to a significant alteration of mitochondrial morphology in Mfn1 KO MEFs (Fig 1D). These results confirm that Mfn1 expression in Mfn1 KO cells restores mitochondrial fusion and mitochondrial network morphology, and that the HR1 and HR2 domains are essential for Mfn1‐mediated mitochondrial fusion. The requirement of HR2 may be related to its proposed role in mitochondrial docking 18, 29 or in the formation of a helix‐bundle important for the integrity of Mitofusin GTPase domain 26, 27. The HR1 domain has been shown to interact with HR2 15, 19, 28, and this interaction may modulate HR2 activity 29, but it cannot be excluded that the HR1 domain also plays a direct role in the fusion process. In order to unveil the exact role of HR1 and HR2 in mitochondrial membrane fusion, we next used in vitro biochemical/biophysical assays with defined membrane systems.
The HR1 domain of Mitofusin induces liposome fusion
To elucidate the function of the heptad repeat domains of Mitofusin in membrane fusion, we reconstituted HR1 or HR2 fragments into liposomes and monitored the fusion between these liposomes using a fluorescence resonance energy transfer (FRET)‐based lipid‐mixing assay 6. Because the heptad repeat domains of Mitofusin can engage in homotypic interactions 18, possibly occurring during liposome reconstitution and storage, we chose to reconstitute them at the very beginning of the fusion assay using a maleimide lipid‐anchorage strategy (Fig 2A). Maleimide anchorage has been previously used to successfully reconstitute SNARE proteins into liposomes and recapitulate SNARE‐mediated fusion in vitro 7. Efficient fusion required that SNAREs are anchored to maleimide lipids with long hydrophobic chains (with at least 45 carbons) which can span both leaflets of lipid bilayers. In our work, we used either a short (18 carbons hydrophobic chain) or a long (45 carbons hydrophobic chain) maleimide lipid, called C18 and C45 maleimide lipids, respectively. The heptad repeat domains of Mitofusins were modified to contain only a single terminal cysteine residue, at the C‐terminus in the case of HR1 and at the N‐terminus in the case of HR2, therefore allowing their coupling to maleimide‐containing liposomes with the same orientation as on mitochondrial membranes (Fig 1A). We chose to work with liposomes exclusively made of phosphatidylcholine lipids (besides the reactive C18 or C45 maleimide lipid) to allow direct comparison with liposome fusion mediated by reconstituted synaptic SNARE proteins. The main lipids found in synaptic vesicles are phosphatidylcholine (PC), phosphatidylethanolamine (PE), and phosphatidylserine (PS) 37, whereas the main lipids of the outer mitochondrial membrane are PC, PE, phosphatidylinositol (PI), and cardiolipins (CL) 38. PE lipids could not be used here because they were reacting with the maleimide groups during liposome reconstitution 39, therefore preventing chemical linkage of heptad repeat domains to maleimide lipids after liposome formation.
Figure 2. The HR1 domain of Mitofusin mediates lipid mixing between liposomes.
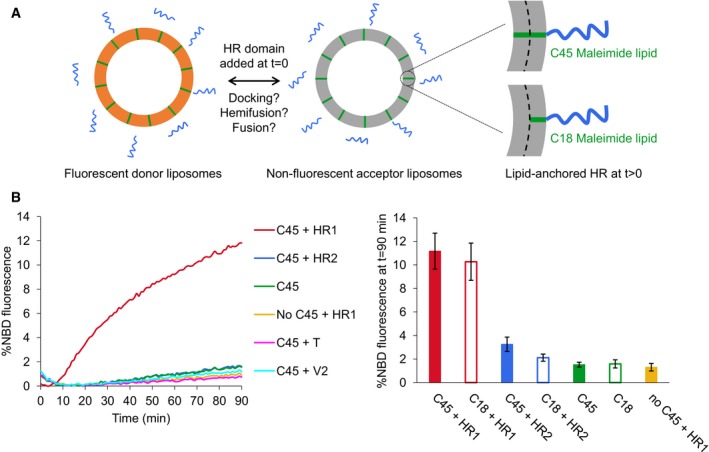
- Experimental system used to monitor the docking and fusion properties of the heptad repeat domains of Mitofusin. The HR1 and HR2 domains were reconstituted into liposomes by chemical linkage to maleimide lipids having either short (18 carbon atoms, C18) or long (45 carbon atoms, C45) hydrophobic chains.
- FRET‐based lipid‐mixing assay between POPC:C45:DOPE‐NBD:DOPE‐Rho(92:5:1.5:1.5) and POPC:C45(95:5) liposomes (mol:mol ratios) to monitor homotypic fusion events in the absence or presence of the heptad repeat domains of Mfn1 or SNARE proteins added at t = 0 (500 μM of lipids and 12.5 μM of proteins, leading to an actual lipid‐to‐protein ratio of ˜ 130 in the liposome membrane; see Appendix Fig S5A). The HR1 domain of Mfn1 induced robust lipid mixing when it was anchored to either short or long maleimide lipids. No lipid mixing was measured under the same conditions with the HR2 domain of Mfn1, or with the heptad repeat domains of the v‐SNARE protein VAMP2 (V2) or the t‐SNARE protein Syn1A/SNAP25 (T). The left panel shows one representative set of kinetics experiments, and the right panel the average extent of lipid mixing after 90 min (n = 8–11 independent experiments; error bars are standard deviations).
Liposome fusion experiments were first performed with the HR1 and HR2 domains of Mfn1. Fluorescence dequenching (signature of lipid mixing between the two distinct populations of liposome) occurred 10 min after addition of the HR1 domain to the liposomes (Fig 2B). This delay corresponds to the time required for the HR1‐maleimide coupling reaction to proceed (Appendix Fig S3). Interestingly, similar extent of lipid mixing was observed after 90 min of reaction whether HR1 was coupled to C18 or C45 maleimide lipids. In addition, no liposome fusion was measured when HR1 was added to liposomes lacking maleimide lipids or in which maleimide lipids had been inactivated (Fig 2B and Appendix Fig S4A), showing that only membrane‐anchored HR1 has the capacity to induce lipid mixing. Under the same experimental conditions, HR2 was unable to induce lipid mixing and so were the heptad repeat domains of the synaptic t‐ or v‐SNARE proteins in an homotypic configuration (i.e., with the same SNARE protein in both liposome populations; Fig 2B). In the heterotypic configuration (i.e., with the t‐SNARE in one liposome population and its cognate v‐SNARE in the other one), the heptad repeat domains of SNAREs mediated lipid mixing only when they were anchored to long C45 maleimide lipids (Appendix Fig S4B), in agreement with previous work 7. SNARE‐ and HR1‐mediated liposome fusions thus display different membrane anchor length requirements, suggesting that they might proceed through a different molecular mechanism.
SNARE‐mediated liposome fusion requires that both v‐ and t‐SNARE proteins have surface densities of at least 1 protein for 300 lipids 32. To determine the minimal protein surface density allowing liposome fusion by HR1, we have performed lipid‐mixing experiments with various concentrations of HR1 added at t = 0 of the assay and quantified the actual lipid‐to‐protein ratio of each liposome preparation in a separate liposome co‐floatation assay (Appendix Fig S5A). These titration experiments revealed that significant lipid mixing (larger than 5% after 90 min of reaction, i.e., twofold higher than the fusion background) required an HR1 surface density of at least 1 protein for 470 lipids (Appendix Fig S5B). This value is consistent with the physiological concentration of Mitofusins that we estimated to be around 1 protein for 450 lipids using mitochondria purified from wild‐type MEFs (Appendix Supplementary Text and Appendix Fig S5C).
Lipid mixing between liposomes can occur through hemifusion, that is, the mixing of only the outer leaflets of the liposome bilayers, or full fusion (Fig 3A). To determine the contribution of fluorescence dequenching arising from outer or inner leaflets mixing, we specifically eliminated the NBD fluorescence signal of the outer leaflets by pre‐incubating fluorescent liposomes with sodium dithionite 40. Thus, any fluorescence increase observed in the fusion assay after HR1 addition would result from mixing of the inner leaflets. Significant fluorescence dequenching was still measured after dithionite treatment (Fig 3B). By comparing the extent of liposome fluorescence dequenching measured with or without prior dithionite treatment, we could estimate the percentage of liposomes that underwent hemifusion or had completed full fusion. After 90 min of incubation with HR1, ~ 60% of the liposomes had hemifused and ~ 40% had undergone full fusion (Fig 3B), showing that the HR1 domain of Mfn1 can induce fusion of both the outer and inner leaflets of liposome membranes.
Figure 3. The HR1 domain of Mitofusin induces both hemifusion and full fusion of liposome membranes.
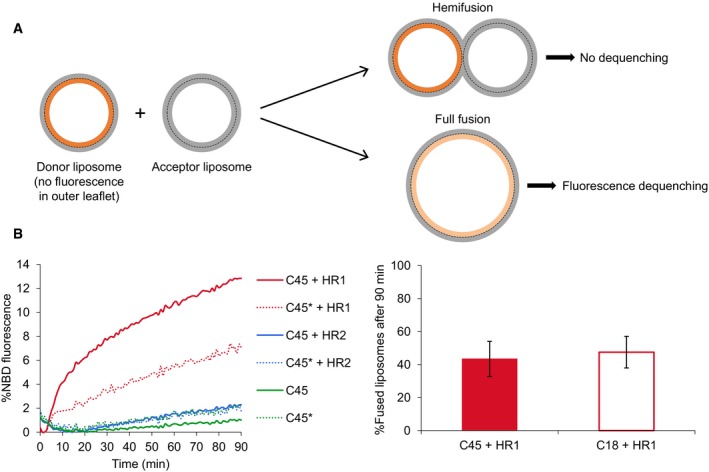
- Scheme of the dithionite assay to quantify the percentage of liposomes that undergo full fusion. When fluorescent liposomes are pre‐treated with sodium dithionite to eliminate the fluorescence of their outer leaflet, only full fusion events lead to fluorescence dequenching in the FRET‐based lipid‐mixing assay.
- Liposomes were prepared as in Fig 2 except that DOPE‐NBD was replaced by DOPS‐NBD to prevent flip‐flop of the fluorescent lipids. Fluorescent liposomes indicated with an asterisk were treated with sodium dithionite prior to start the lipid‐mixing assay in order to quench NBD fluorescence from the outer leaflets. Comparison of the fluorescence dequenching signals obtained with or without prior dithionite treatment allows the estimation of the percentage of liposomes that have undergone hemifusion or full fusion (see Materials and Methods). The left panel shows one representative set of kinetics experiments (performed with the same lipid and protein concentrations as in Fig 2), and the right panel the average percentage of liposomes that have fully fused after 90 min (n = 4 independent experiments; error bars indicate standard deviations).
Qualitatively, similar results were obtained with the HR1 and HR2 domains of Mfn2 (Appendix Fig S4C). However, the preparations of Mfn2‐HR1 peptides displayed variable fusion activities and a strong tendency to aggregate, as observed by SDS–PAGE following high speed centrifugation (Appendix Fig S6). Therefore, we pursued the functional characterization of the heptad repeat domains of Mitofusins in fusion using exclusively Mfn1 fragments.
The HR1 and HR2 domains of Mitofusin mediate liposome docking
Membrane fusion occurs through a series of intermediate stages that include membrane docking followed by lipid bilayer destabilization and merging. Previous work has suggested that the HR2 domain of Mfn1 plays a role in the docking step of mitochondrial fusion 18. We therefore investigated whether the HR1 and HR2 domains of Mfn1 could mediate membrane docking in our in vitro system. We first used a liposome pull‐down assay in which non‐fluorescent liposomes decorated with biotinylated lipids were bound to streptavidin‐coated magnetic beads and were used to pull down fluorescent liposomes (Fig 4A). Fluorescent and non‐fluorescent liposomes were both functionalized with C18 maleimide lipids to allow membrane‐anchorage of the heptad repeat domains of Mfn1. Working with C18 maleimide lipids further allows comparison with the docking capacity of SNARE proteins. In fact, SNARE proteins were shown to mediate liposome docking but not liposome fusion when they were anchored to short C18 maleimide lipids 7. Both the HR1 and HR2 domains of Mfn1 induced liposome docking in this pull‐down assay, and their docking efficiency was comparable to that of heterotypic v‐SNARE/t‐SNARE complexes (Fig 4A).
Figure 4. The HR1 and HR2 domains of Mitofusin mediate liposome docking.
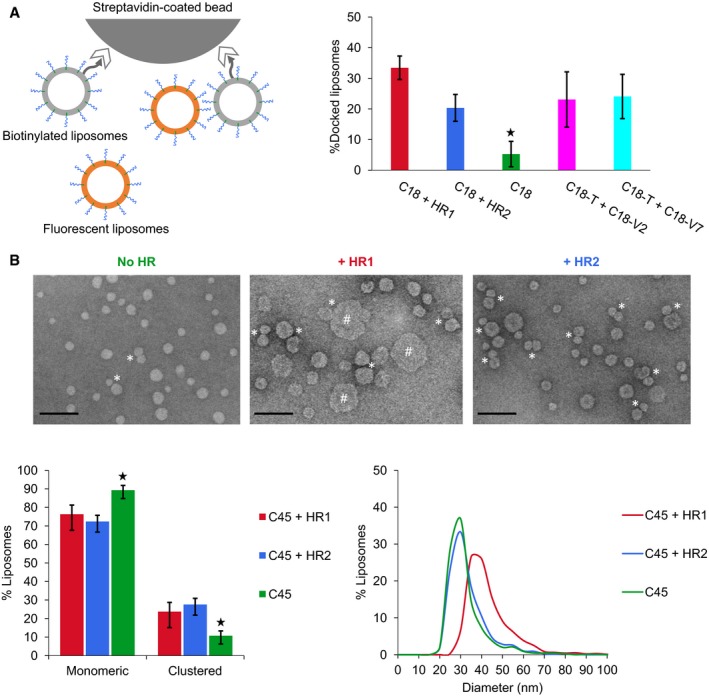
- Docking of liposomes by the heptad repeat domains of Mfn1 or SNARE proteins probed by a magnetic bead assay. Non‐fluorescent POPC:C18:DOPE‐Biotin(93:5:2) liposomes were anchored to streptavidin magnetic beads and used to pull‐down fluorescent POPC:C18:DOPE‐NBD:DOPE‐Rho(92:5:1.5:1.5) liposomes in the absence or presence of the heptad repeat domains of Mfn1 or SNARE proteins in their membrane. The HR1 and HR2 domains of Mfn1 were added at t = 0 (using the same lipid and protein concentrations as in Fig 2) and SNARE proteins were reconstituted into liposomes before running the docking assay. The t‐SNARE Syn1A/SNAP25 (T) was reconstituted in the non‐fluorescent liposomes, and the v‐SNARE VAMP2 (V2) or VAMP7 (V7) were reconstituted in the fluorescent liposomes. Docking occurred overnight on ice and was quantified by measuring the fluorescence of bound liposomes (expressed here as the average percentage of input fluorescence from n = 3 independent experiments; error bars are standard deviations). Two‐sample t‐tests by comparison with C18 + HR1: C18 + HR2, C18‐T + C18‐V2 and C18‐T + C18‐V7 (non‐significant); C18 (*P < 0.05).
- Docking and fusion of liposomes by the heptad repeat domains of Mfn1 investigated by electron microscopy (EM). POPC:C45(95:5) liposomes were incubated for 1 h at 37°C with or without the HR1 or HR2 domains of Mfn1 (500 μM of lipids and 12.5 μM of proteins) and observed by EM after being diluted 20 times. Incubation with either HR1 or HR2 induced liposome docking events (indicated with asterisks). We considered that two liposomes were docked to each other when their membranes were separated by 5 nm or less. Two‐sample t‐tests by comparison with C45 + HR1: C45 + HR2 (non‐significant); C45 (*P < 0.05). After incubation with HR1 (but not HR2), a fraction of the liposomes also appeared significantly larger (indicated with hashtags), proving that full fusion had occurred. The histogram of liposome diameters and the percentage of liposomes in contact were determined from n = 3 independent experiments. A total number of 901, 965 and 1,205 liposomes were, respectively, counted for protein‐free samples, samples incubated with HR1, and samples incubated with HR2; error bars indicate standard deviations, and the scale bar is 100 nm. Protein‐free liposomes, liposomes incubated with HR1, and liposomes incubated with HR2 displayed an average diameter of 30 ± 9 nm, 41 ± 11 nm, and 31 ± 9 nm, respectively.
Next, we investigated the docking and fusion properties of HR1 and HR2 by negative staining electron microscopy (EM). EM pictures of liposomes functionalized with C45 maleimide lipids and incubated with either the HR1 or HR2 domain of Mfn1 confirmed that both domains can mediate liposome docking. In addition, the percentage of docked liposomes was comparable to that measured in the liposome pull‐down assay (Fig 4B), and previously observed in studies that analyzed SNARE‐mediated liposome docking by EM 41, 42, 43. Because results obtained by negative staining EM must always be interpreted with caution 44, 45, we have crosschecked our EM observations with bulk dynamic light scattering measurements, which confirmed the capacity of both HR1 and HR2 to induce liposome docking (Appendix Fig S7). EM pictures also showed that liposomes incubated with the HR1 domain displayed a net increase in diameter consistent with fusion 46, 47, whereas incubation with the HR2 domain had no effect on liposome size (Fig 4B). This confirms that the HR1 domain can mediate full fusion between liposomes, in agreement with the results obtained using the FRET‐based lipid‐mixing assay (Fig 3).
The HR1 domain of Mitofusin perturbs the lipid bilayer structure
The membrane fusion property of HR1 could originate from its capacity to form membrane‐bridging complexes (i.e., using a zippering mechanism similar to that of SNARE proteins) and/or from a membrane‐destabilizing effect (similar to that of viral fusion peptides or the C‐terminal tail of Atlastin). To test this second hypothesis, we followed the fusion between non‐fluorescent protein‐free liposomes and fluorescent liposomes functionalized with the HR1 domain of Mfn1 (Fig 5). Interestingly, HR1 was still able to mediate lipid mixing when it was anchored to only one of the two interacting liposome populations, although the extent of lipid mixing was slightly lower than when non‐fluorescent and fluorescent liposomes were both functionalized with HR1 domains (Fig 5). This result shows that trans‐interactions between HR1 domains are not required for fusion and thus points to a different mechanism than that established for SNARE proteins. The ability of membrane‐anchored HR1 to induce fusion with protein‐free liposomes suggests that HR1 might interact with their lipid bilayer structure.
Figure 5. Membrane‐anchored HR1 induces fusion with protein‐free liposomes.
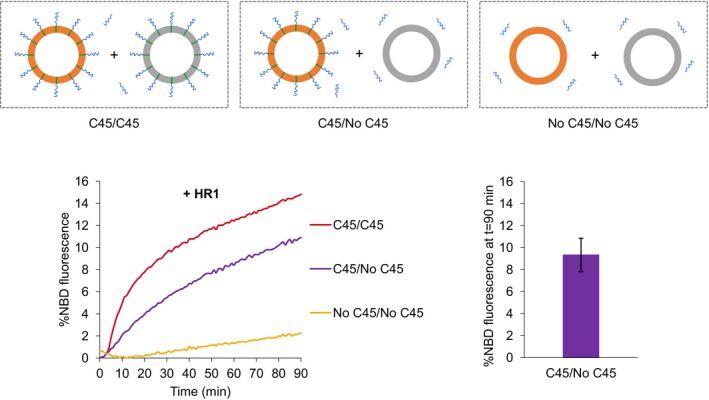
Fusion was measured using the FRET‐based lipid‐mixing assay between fluorescent and non‐fluorescent liposomes containing or not C45 maleimide lipids to anchor HR1 to the liposome membrane (with the same lipid and protein concentrations as in Fig 2). In a subset of experiments (purple curves), non‐fluorescent liposomes were devoid of C45 maleimide lipid anchor (no C45); thus HR1 (added at t = 0) could only reconstitute into the fluorescent liposomes (C45). Under this asymmetrical condition, the HR1 domain of Mfn1 was still capable of inducing lipid mixing albeit to a lesser extent compared to the symmetrical condition with C45 maleimide lipid anchor on both liposome populations (red curves). The left panel shows one representative set of kinetics experiments, and the right panel the average extent of lipid mixing after 90 min in the case of the asymmetrical system (n = 4 independent experiments; error bars are standard deviations). The average fusion extents in the case of the two symmetrical systems are given in Fig 2B.
We thus next investigated the membrane‐binding capacity of HR1 (independently of its coupling to maleimide lipids) using a co‐floatation assay with liposomes devoid of maleimide lipids (Appendix Fig S8A). This experiment showed that the fusion activity of the HR1 domain in fact correlates with its capacity to interact directly with liposome membranes. As expected, the non‐fusogenic HR2 domain did not bind to liposome membranes. To determine whether the membrane‐binding capacity of HR1 is due to its affinity for the hydrophobic core of lipid bilayers (which would be consistent with a membrane‐destabilizing effect), we performed a phase separation assay in solutions of the Triton X‐114 detergent (Appendix Fig S8B). Triton X‐114 allows the separation between hydrophilic proteins and membrane proteins via phase partitioning at physiological temperature 48. In this assay, the HR2 domains of Mfn1 and Mfn2 were almost exclusively found in aqueous phases, while the HR1 domains were recovered in both phases (Appendix Fig S8B). Of note, the proportion of HR1 in detergent phases was more important for Mfn2 (55%) than for Mfn1 (22%), which may explain the tendency of Mfn2‐HR1 to aggregate in solution (see above). This result indicates that the HR1 domain displays an amphipathic character and thus suggests that it could potentially insert into lipid bilayers. Accordingly, bioinformatic analysis of HR1 sequence by HeliQuest identified a long and conserved amphipathic helix at its C‐terminus (Fig 6A and Appendix Fig S9). Interestingly, this amphipathic sequence also coincides with a region in HR1 where the coiled‐coil forming probability drops to zero (Appendix Fig S1). Three‐dimensional construction of HR1 in an ideal α‐helix clearly shows that its hydrophobic residues lie on the same face of this helix and are thus ideally positioned to interact with the lipid bilayer surface (Fig 6A).
Figure 6. The HR1 domain of Mitofusin possesses an amphipathic helix that interacts with the lipid bilayer structure.

- Left, helical wheel representation of HR1 in the region (393–410) generated by HeliQuest 71 illustrating a strong amphipathic character that even extends beyond these limits (see the 36‐residue helical wheel representation of Appendix Fig S9 and the 3D model structure of the right panel). Right, ideal 3D representation of HR1 helix showing that hydrophobic residues within the amphipathic helix are ideally positioned to interact with the lipid bilayer surface (schematized here as a yellow plane).
- Left, circular dichroism spectra of the HR1 and HR2 domains of Mfn1 in the absence or presence of maleimide‐containing liposomes. The circular dichroism spectra of HR1 and HR2 were recorded after 30 min of incubation at 37°C with or without POPC:C45(95:5) liposomes (500 μM of lipids and 12.5 μM of proteins). The absolute value of the mean residue molar ellipticity of HR1 at 208 and 222 nm increases in the presence of liposomes, indicating that the amphipathic helix of HR1 folds into the liposome membrane. Right, helical content of HR1 and HR2 in the absence or presence of liposomes in the conditions described above (n = 3 independent experiments; error bars indicate standard deviations).
Because the partitioning of small proteins into lipid bilayers usually promotes secondary structure formation 49, we next used circular dichroism spectroscopy to characterize the secondary structure of HR1 when it is in solution or anchored to liposome membranes (Fig 6B). In solution, HR1 displayed a mixture of random coil and α‐helical content, but with a majority of the protein sequence (~ 55%) being folded into an α‐helix. The α‐helical content of HR1 increased on the membrane of liposomes (~ 75%), indicating bilayer‐induced secondary structure formation. The HR2 domain was also partially folded into an α‐helix in aqueous solution (~ 30%), but no further structuration occurred on the membrane of liposomes, consistent with its absence of binding to lipid bilayers. When HR1 was incubated with an increasing concentration of liposomes, its helicity increased concomitantly, which allowed the determination of the free energy for HR1 partitioning‐folding into the lipid bilayer 49. Using the increase of mean residue molar ellipticity at 222 nm, we found that the free energy reduction associated with HR1 partitioning‐folding into the liposome membrane is about 7 kcal/mol (Appendix Fig S10), which is consistent with previous energetic estimates of membrane‐induced structuration of amphipathic helices, including amphipathic helices involved in membrane fusion 49, 50.
Amphipathic helices are known to preferentially bind to highly curved membranes 51, 52. This prompted us to investigate whether the capacity of HR1 to induce liposome fusion would depend on the size of these liposomes. To address this point, we performed fusion experiments with liposomes of various sizes, ranging from ~ 50 nm to ~ 250 nm in diameter (Fig 7A). HR1 induced the fusion of ~ 50 nm diameter liposomes formed either by the standard method (Fig 2B) or by sonication (Fig 7A), but was unable to induce the fusion of larger liposomes (Fig 7A), suggesting that it does not bind to their lipid bilayer and that its fusion activity correlates with its capacity to interact with membrane regions of high local curvature. The membrane packing defects found in the outer monolayer of highly curved membranes can also be produced in flat membranes by the presence of cone‐shaped lipids such as PE 53. Because the presence of PE in the liposome membrane was interfering with the chemical linkage of HR1 to maleimide lipids, we could not test its effect in our symmetrical liposome fusion system (Fig 5, top left panel). So we took advantage of the capacity of membrane‐anchored HR1 to fuse with protein‐free membranes to probe the effect of PE in our asymmetrical liposome fusion system (Fig 5, top middle panel). Interestingly, lipid mixing was partially restored when large 100 nm liposomes contained a physiological concentration of PE lipids (Appendix Fig S11A). To overcome the problem of interference between PE and maleimide lipids, we also developed a new anchoring strategy using NTA‐Ni functionalized lipids. Liposomes containing NTA‐Ni lipids fused efficiently in the presence of an HR1 fragment with a C‐terminal His6 tag and, importantly, fusion was strongly activated when the liposome membrane included PE lipids (Appendix Fig S12A). The NTA‐Ni anchoring strategy also allowed us to explore the potential role of HR1/HR2 interaction in fusion by selectively coupling HR1 and HR2 to NTA‐Ni‐ and maleimide‐containing liposomes, respectively. These experiments revealed that HR1 liposomes fused similarly with protein‐free liposomes or HR2 liposomes, indicating that the measured fusion activity was due to HR1/membrane interaction rather than HR1/HR2 interaction (Appendix Fig S12B). Together, these data show that the HR1 domain induces membrane fusion by perturbing the lipid bilayer structure, notably in membrane regions displaying lipid packing defects. Previous work identified two membrane‐binding amphipathic helices within the heptad repeat domain of the synaptic v‐SNARE protein VAMP2 52, 54, 55. Importantly, these helices did not induce liposome fusion in our assay (Fig 2B), suggesting that their membrane‐destabilizing effect (if any) is much weaker than that produced by the HR1 domain of Mitofusin.
Figure 7. The amphipathic helix of HR1 may trigger mitochondrial fusion by perturbing bilayer structure in regions of high local curvature.
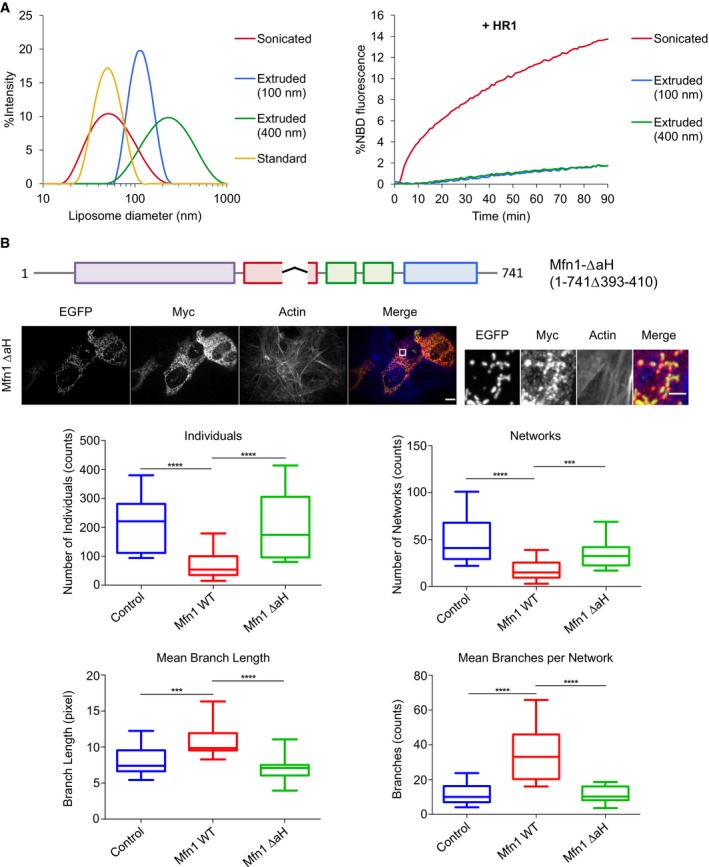
- Left, dynamic light scattering (DLS) on maleimide‐containing liposomes of different sizes, made by various means: standard method, sonication or extrusion (using a polycarbonate membrane with a 100 nm or 400 nm pore size). We used the sonication method in an attempt to produce liposomes that would be smaller than those prepared by the standard method but both approaches actually generated liposomes with an average diameter of ˜ 50 nm. Right, fusion between maleimide‐containing liposomes of different sizes following addition of the HR1 domain of Mfn1 at t = 0 (500 μM of lipids and 12.5 μM of proteins). The HR1 domain could fuse sonicated liposomes with the same efficiency as liposomes formed by the standard method (Fig 2B) but was unable to fuse larger liposomes (with an average diameter of ˜ 100 nm or ˜ 250 nm). This shows that HR1 specifically induces the fusion of small highly curved liposomes.
- Top, Mfn1 KO MEFs were co‐transfected with a plasmid expressing mtEGFP and a plasmid expressing Mfn1‐Myc lacking the conserved amphipathic helix of HR1 (Mfn1‐ΔaH). Mfn1‐ΔaH was stained with an anti‐Myc antibody and actin was stained with Phalloidin. The right panels show magnified views of the boxed area in the left panels. Expression of Mfn1‐ΔaH in Mfn1 KO MEFs could not rescue filamentous mitochondrial morphology. The scale bar is 10 μm for the left panels and 2 μm for the right panels. Bottom, cells were analyzed using the MiNA toolset (˜ 30 cells; n = 4 independent experiments) that classified mitochondrial morphologies as either individuals (structures with no junction, which can be puncta or rods) or networks (structures with at least one junction and three branches), and calculated the mean length of rods and network branches, and the mean number of branches per network. Box plots represent the 25th and 75th percentiles around the median and the whiskers represent the maximum and minimum values. ***P ≤ 0.001, ****P ≤ 0.0001 by Mann–Whitney U‐test. The morphological data of the control cells and of cells expressing Mfn1 WT are those of Fig 1D, displayed here for comparison purposes.
To confirm the importance of the amphipathic helix of HR1 in mitochondrial fusion in a cellular context, we expressed an Mfn1 mutant lacking the conserved amphipathic helix of HR1 (Mfn1‐ΔaH) into Mfn1 KO MEFs (Fig 7B). Similar to Mfn1‐ΔHR1, the Mfn1‐ΔaH mutant could not restore normal tubular mitochondrial morphology in Mfn1 KO cells (Fig 7B). MiNA showed that expression of Mfn1‐ΔaH did not modify the number and the morphological features of individual or network structures in Mfn1 KO MEFs (Fig 7B). These in situ results confirm the crucial role of HR1, and notably its amphipathic helix, in mediating outer mitochondrial membrane fusion. We also performed in vitro liposome docking and fusion experiments with an amphipathic helix deleted HR1 fragment (HR1‐ΔaH). As expected, this fragment could not induce liposome fusion (Appendix Fig S11B). Interestingly, it also could not mediate liposome docking (Appendix Fig S7), suggesting that the docking activity of HR1 is due to its interaction with the lipid bilayer and not the formation of a membrane‐bridging HR1/HR1 complex. Accordingly, HR1 was not capable of inducing the docking of large liposomes (Appendix Fig S7).
Discussion
Our results show that isolated HR1 and HR2 domains of Mitofusin mediate membrane docking in vitro, as observed by pull‐down, dynamic light scattering and electron microscopy experiments. They also show that the HR1 domain induces membrane fusion. The occurrence of full fusion (i.e., mixing of both outer and inner leaflets of lipid bilayers) is confirmed using a dithionite assay that specifically monitors inner leaflet mixing, and directly observed in electron microscopy experiments, showing larger liposomes after incubation with HR1. Bioinformatics analysis of HR1 domain sequence identifies a conserved amphipathic helix in the C‐terminal part of the domain. This amphipathic helix confers membrane‐binding capacity to HR1, as shown by circular dichroism experiments, in which HR1 becomes more structured upon contact with the liposome membrane. Using liposomes presenting various lipid packing properties, produced either by membrane curvature or the presence of lipids with different molecular shapes, we show that HR1 preferentially induces the fusion of membranes with lipid packing defects. The key function of HR1 in mitochondrial fusion is confirmed in a cellular context, where expression of Mfn1 mutants lacking HR1 or the conserved amphipathic helix of HR1 cannot rescue mitochondrial tubules in cells lacking the endogenous Mfn1 protein.
How does the HR1 domain induce membrane fusion? HR1 could mediate fusion like SNARE proteins do, that is, by assembling like a zipper (which would be a homotypic complex in the case of HR1) across the membranes destined to fuse, forcing their close apposition and lipid mixing 3, 4, 5, 6, 7, 8. Alternatively, HR1 could mediate fusion by perturbing the lipid bilayer structure, as recently shown for a C‐terminal amphipathic fragment of the ER membrane fusion protein Atlastin 56, 57. Such perturbation could occur when HR1 interacts with the membrane in which it is anchored and/or when HR1 interacts with the opposing membrane. Our results strongly favor the membrane perturbation hypothesis. First, bioinformatics analysis of Mitofusin sequence predicts that HR1 has a low coiled‐coil forming capacity compared to HR2, and identifies a strong and conserved amphipathic helix in its C‐terminal part. Second, HR1 can mediate the fusion between liposomes in which it is anchored and protein‐free liposomes. This ability of membrane‐anchored HR1 to induce fusion with protein‐free membranes can be correlated with our observation that HR1 folds upon interaction with the liposome membrane, which might destabilize the lipid bilayer structure. Third, fusion is abolished when the liposomes present less lipid packing defects and are thus intrinsically more stable.
This then raises the question of how can lipid packing defects and membrane stress be produced in vivo within the outer mitochondrial membrane. Because large GTPase proteins from the dynamin family (to which Mitofusin belongs) are known for their membrane remodeling properties 24, it is tempting to speculate that high membrane curvature could be generated by the GTPase domain of Mitofusin 1, 25. Interestingly, a recent study suggests that GTP hydrolysis triggers outer mitochondrial membrane fusion at the edge of the contact zone between two docked mitochondria, where membrane curvature is locally increased 23. Similar membrane packing defects such as those induced by high local curvature can also be generated by lipids with a cone‐like molecular shape, that is, lipids having a small headgroup area compared to the cross‐sectional area of their hydrophobic chains 53. Outer mitochondrial membranes are particularly rich in PE lipid 38, which displays a cone‐shaped geometry and is known to influence mitochondrial morphology 58. Its presence at the fusion site could thus have an important regulatory/triggering effect on the membrane perturbation activity of the HR1 domain. Future work will have to address the role of various lipid compositions and the contribution of the GTPase domain of Mitofusin in mitochondrial fusion.
Our observation that the HR2 domain of Mitofusin mediates membrane docking in vitro is consistent with previous structural and in situ data which showed that this domain forms a 9.5 nm dimeric antiparallel coiled‐coil with the capacity to dock mitochondrial membranes 18. In the case of HR1, the membrane docking property observed in our in vitro systems essentially involves interactions between HR1 and the opposing membrane. How do the membrane docking, binding, and fusion properties unraveled here for the heptad repeat domains of Mitofusin compare with the mode of action of similar functional domains in other fusion machineries? In SNARE‐mediated fusion, the energy released during the folding of heptad repeat domains as coiled‐coil structures is used to dock the membranes, bring them close together and force bilayer merger 3. Class I viral fusion proteins also use the folding energy of coiled‐coil structures to drive membrane apposition, and possess an N‐terminal amphipathic helix (called the fusion peptide) that displays both membrane‐anchoring and membrane‐destabilizing properties 9. Atlastin mediates the fusion of ER membranes using mechanical properties of both SNARE and viral fusion proteins. ER membranes are first brought in close proximity by GTP‐dependent formation and conformational transition of membrane‐bridging Atlastin complexes. ER membranes are then destabilized by a C‐terminal amphipathic helix which alters the lipid bilayer integrity 10, 56, 57. Interestingly, similar membrane‐proximal amphipathic helices, with a potential function in membrane destabilization and fusion, were also found in other fusion proteins such as the synaptic v‐SNARE protein VAMP2 and the flavivirus protein E from the dengue virus 54, 55, 59, suggesting that amphipathic helices are a force to be reckoned with in membrane fusion events.
Our results and previous works 18, 26, 27, 29 suggest two alternative, but not mutually exclusive, pathways for Mitofusin‐mediated outer mitochondrial membrane fusion (Fig 8). In the first one (Fig 8A), mitochondria are docked to each other by HR2 domains that form antiparallel coiled‐coil dimers across outer mitochondrial membranes, bringing mitochondria at ~ 10 nm from each other 18. Concomitantly, HR1—owing to its amphipathic property—binds to its membrane and/or the opposing membrane, thus bringing the bilayers even closer and disrupting their structure to trigger membrane merger 2, 60, 61, 62, 63. The interaction of HR1 with the mitochondrial membrane might be facilitated by membrane deformation by the GTPase domain and/or local enrichment of non‐bilayer forming lipids such as PE. In the second one (Fig 8B), Mitofusin mediates mitochondrial docking by trans‐dimerization of its GTPase domain and brings outer mitochondrial membranes in close proximity by folding back on itself 26, 27. This model is also compatible with a role of HR1 in membrane perturbation because, in the closed conformation, HR1 would be lying parallel to the lipid bilayer surface and would thus be ideally positioned to destabilize the outer mitochondrial membrane (Fig 8B). These two pathways are not mutually exclusive because HR2‐mediated docking could also occur downstream of GTPase‐mediated docking to stabilize close membrane apposition. Further work is now required to fully elucidate the structure‐function of Mitofusin and notably to reveal how the GTPase domain collaborates with the heptad repeat domains to induce homotypic fusion of mitochondria.
Figure 8. Working models for the role of Mitofusin in outer mitochondrial membrane fusion.
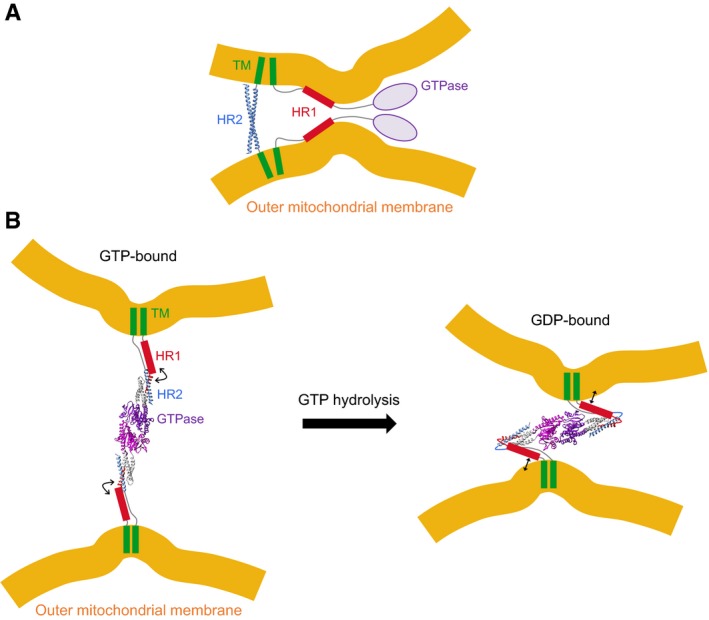
- The HR2 domain is involved in mitochondrial docking through the formation of antiparallel coiled‐coil dimers that bring opposing mitochondrial membranes at ˜ 10 nm from each other (Protein Data Bank entry 1T3J) 18. The HR1 domain interacts with the lipid membrane (in cis or in trans), which brings outer mitochondrial membranes in closer proximity and perturbs their lipid bilayer structure, notably in membrane regions already displaying lipid packing defects.
- Mitofusin‐mediated mitochondrial docking occurs through GTP‐dependent trans‐dimerization of its GTPase domain followed by GTP hydrolysis driven open/closed conformational transition that pulls the membranes together (Protein Data Bank entry 5GOM) 26, 27. In the closed conformation, the HR1 domain is perfectly placed to interact with the lipid bilayer surface and thus act as the molecular trigger for membrane merger. Crystallized sequences of Mfn1 in panels (A and B) are shown in ribbon representation and sequences with unknown structure are displayed as random coils or geometric shapes. The positions and orientations of the protein domains in the two panels are arbitrary.
Materials and Methods
Chemicals
Salts and detergents were purchased from Merck Millipore with the Molecular Biology grade. All aqueous solutions were prepared using 18.2 MΩ ultra‐pure water and filtered through 0.2 μm hydrophilic membranes.
1‐palmitoyl‐2‐oleoyl‐sn‐glycero‐3‐phosphocholine (POPC), 1,2‐dioleoyl‐sn‐glycero‐3‐phosphoethanolamine (DOPE), 1,2‐dioleoyl‐sn‐glycero‐3‐phospho‐L‐serine (DOPS), 1,2‐dioleoyl‐sn‐glycero‐3‐phospho‐L‐serine‐N‐(7‐nitro‐2‐1,3‐benzoxadiazol‐4‐yl) (DOPS‐NBD), 1,2‐dioleoyl‐sn‐glycero‐3‐phosphoethanolamine‐N‐(7‐nitro‐2‐1,3‐benzoxadiazol‐4‐yl) (DOPE‐NBD), 1,2‐dioleoyl‐sn‐glycero‐3‐phosphoethanolamine‐N‐(lissamine rhodamine B sulfonyl) (DOPE‐Rho), 1,2‐dioleoyl‐sn‐glycero‐3‐phosphoethanolamine‐N‐(cap biotinyl) (DOPE‐Biotin), 1,2‐dioleoyl‐sn‐glycero‐3‐phosphoethanolamine‐N‐[4‐(p‐maleimidophenyl)butyramide] (C18 maleimide) and 1,2‐dioleoyl‐sn‐glycero‐3‐[(N‐(5‐amino‐1‐carboxypentyl)iminodiacetic acid)succinyl] (nickel salt) (DOGS‐NTA‐Ni) were purchased from Avanti Polar Lipids as chloroform solutions. Maleimidopropionic acid solanesylester (C45 maleimide) was synthesized from solanesol (TCI Chemicals) as previously described 7. About 40 mg of C45 maleimide was obtained with a 75% yield (mol% compared to solanesol). 1H‐ and 13C‐NMR spectra were recorded on a Bruker spectrometer. 1H‐NMR (300 MHz, CDCl3): δ = 1.60 (s, 24 H), 1.68 (s, 3 H), 1.70 (s, 3 H), 1.98–2.08 (m, 32 H), 2.64 (td, 2 H, J = 2.6 Hz), 3.84 (td, 2 H, J = 3.8 Hz), 4.59 (d, 2 H, J = 4.6 Hz), 5.10 (m, 8 H), 5.32 (t, 1 H, J = 7.22 Hz), 6.70 (d, 2 H, J = 6.7 Hz) ppm. 13C‐NMR (75 MHz, CDCl3): δ = 16.2, 16.6, 17.8, 24.8, 25.8, 26.4, 26.8, 29.8, 33.0, 33.8, 35.8, 35.0, 39.7, 39.9, 61.9, 118.0, 123.7, 124.3, 124.4, 124.5, 131.4, 134.3, 135.1, 135.2, 135.7, 142.9, 170.4, 170.8 ppm.
Protein synthesis
Except otherwise noted, heptad repeat domains (HR1 and HR2) of Mitofusin proteins (Mfn1 and Mfn2) used in this study were produced by Fmoc solid‐phase peptide synthesis and one‐step purification by reverse‐phase HPLC (Proteogenix, purity > 95%). The produced sequence (derived from Human Mitofusins) were Mfn1‐HR1 (T350‐L420; C411S, C418S; with a C‐terminal cysteine or His6 tag), Mfn1‐HR1‐ΔaH (Mfn1‐HR1‐Δ393‐410; with a C‐terminal cysteine tag), Mfn1‐HR2 (T676‐P735; C681S; with an N‐terminal cysteine‐leucine tag), Mfn2‐HR1 (A371‐R440; C390S; with a C‐terminal leucine‐cysteine tag), and Mfn2‐HR2 (T695‐Q754; C700S; with an N‐terminal cysteine‐leucine tag). Lyophilized samples (1 mg aliquots) were solubilized in 1 ml of buffer H (25 mM HEPES/KOH, pH 7.5; 150 mM KCl; 10% (v/v) Glycerol) containing 0.25 mM TCEP by vortexing for 2 min at room temperature followed by 40 s of sonication on ice to remove any potential aggregates (four cycles of 10 s on, at 30% maximal power, and 10 s off, using a Vibra‐Cell from Sonics equipped with a 2‐mm microtip). Samples were then centrifuged for 45 min at 200,000 g in a TLA 120.2 rotor (Beckman), and the supernatants (used in the experiments) were isolated by carefully pipetting 950 μl immediately after centrifugation. Samples were snap‐frozen in liquid nitrogen and stored at −80°C as aliquots of 100 μl, or kept on ice for up to 2–3 weeks.
In some of the experiments, we also used recombinant HR1 and HR2 fragments, which were expressed and purified as described below.
Protein purification
Human Mfn1‐HR1 (T350‐R419), Mfn1‐HR2 (T676‐P735), Mfn2‐HR1 (A371‐R440), and Mfn2‐HR2 (T695‐Q754) were cloned into a pLIC plasmid 64 derived from pET21b(+) (Novagen) and containing an N‐terminal His6 tag, a maltose‐binding protein (MBP) tag and a tobacco etch virus (TEV) protease recognition sequence (ENLYFQG). All natural cysteines were replaced by serines and a serine‐glycine‐glycine‐cysteine tag was added to the C‐terminus in the case of Mfn1‐HR1 and Mfn2‐HR1 and to the N‐terminus in the case of Mfn1‐HR2 and Mfn2‐HR2. Plasmids encoding for Mfn‐HR fragments were expressed in the BL21(DE3) Escherichia coli strain (Invitrogen), together with a tRNA accessory plasmid pRIL (Stratagene). 10 ml of Luria broth (LB) containing 100 μg/ml of ampicillin and 30 μg/ml of chloramphenicol was inoculated with the co‐expressing strain and grown overnight at 37°C. This 10 ml pre‐culture was used as the inoculum for 1 l of LB containing 100 μg/ml of ampicillin and 30 μg/ml of chloramphenicol. The 1 l culture was grown at 37°C until reaching an optical density of 0.6 (at 600 nm). Expression of Mfn‐HR was induced by the addition of 1 mM IPTG. Bacteria were grown for an additional 5 h at 30°C, harvested by a 15‐min centrifugation at 3,000 g in a Fiberlite F9‐4 × 1000y rotor (Thermo Scientific) and frozen at −80°C for at least 1 h. Frozen bacteria were resuspended by gentle pipetting in 30 ml of buffer H containing 5 mM imidazole; 1 mM TCEP; 200 μg/ml lysozyme; 20 μg/ml DNase; 1 mM PMSF; 0.1% Triton X‐100 and 2 cOmplete, Mini, EDTA‐free protease inhibitor cocktail tablet (Roche). Bacteria were disrupted by probe sonication on ice (five cycles of 30 s on at maximal power and 30 s off, using a Vibra‐Cell from Sonics equipped with a 13‐mm tip). Cell debris was removed by a 30‐min centrifugation at 70,000 g in a Ti45 rotor (Beckman). Bacterial supernatant was incubated for 4 h at 4°C with 2 ml of Ni‐NTA resin (Qiagen) equilibrated in buffer H containing 5 mM imidazole and 0.25 mM TCEP. The beads were washed with 20 ml of buffer H, and the protein was eluted with 6 ml of buffer H containing 300 mM imidazole and 0.25 mM TCEP. The eluted protein was desalted on a Sephadex‐G25 column (GE Healthcare) using buffer H containing 1 mM TCEP and 0.5 mM EDTA to allow efficient cleavage of the MBP tag by His6‐TEV protease (overnight incubation at 4°C using 0.5 mg of His6‐TEV for 1 mg of Mfn‐HR). The plasmid for His6‐TEV expression (pRK793) was a gift from David Waugh (Addgene plasmid # 8827), and the protein was purified as previously described 65. Sephadex‐G25 column was used again to put proteins into buffer H containing 0.25 mM TCEP. Cleaved proteins were incubated with 5 ml of amylose resin (New England Biolabs) for 3 h at 4°C to remove cleaved MBP tag, and the collected flow through was applied to 2 ml of Ni‐NTA resin for 3 h at 4°C to remove His6‐TEV protease as well as any remaining MBP tag. The flow through was finally concentrated in Amicon Ultra‐15, 3 kD (Millipore), frozen in liquid nitrogen, and stored at −80°C as aliquots of 100 μl.
The soluble t‐SNARE protein (consisting of the cytoplasmic domain of rat Syntaxin‐1A containing a single C‐terminal cysteine residue and mouse His6‐SNAP25 with no cysteine residues), the soluble v‐SNARE protein (consisting of the cytoplasmic domain of mouse His6‐VAMP2 containing a C‐terminal cysteine residue), and the heptad repeat domain of human VAMP7 (containing an N‐terminal His6 tag and a C‐terminal cysteine residue) were expressed and purified as previously described 8.
Preparation of protein‐free liposomes
Except otherwise noted, liposomes were prepared by the standard method 66. 1 μmol of the appropriate lipid mixtures in chloroform solution was dried in glass tubes for 10 min under a gentle stream of nitrogen and then for 1 h under vacuum. The dried lipid films were resuspended in 333 μl of buffer H containing 1% (w/v) n‐octyl‐b‐D‐glucopyranoside (β‐OG) by vigorously vortexing for 30 min at room temperature. The detergent concentration was next reduced below the critical micellar concentration, 0.33% (w/v), by dilution in buffer H, and then removed by overnight flow dialysis against 4 l of buffer H. Liposomes were stored on ice for up to 2–3 weeks.
For experiments with liposomes of various sizes, we also used the extrusion and sonication methods. Dried lipid films (1 μmol) were obtained as described above and resuspended in 1 ml of buffer H by vigorously vortexing for 1 h at room temperature. Unilamellar liposomes were produced by seven freeze–thaw cycles (30 s in liquid nitrogen followed by 5 min in a 37°C water bath) and (i) extrusion (at least 19 times) through a polycarbonate filter with the desired pore size (50, 100, or 400 nm polycarbonate membranes from Avanti Polar Lipids) or (ii) sonication on ice (15 cycles of 30 s on at maximal power and 30 s off, using a Vibra‐Cell from Sonics equipped with a 2‐mm microtip). Sonicated liposomes were centrifuged for 20 min at 16,100 g to remove metal residues.
Typical size distributions of these various liposome preparations are given in Fig 7A.
Reconstitution of SNARE proteins into liposomes
Cytoplasmic domains of t‐ and v‐SNARE proteins were reconstituted into liposomes by chemical linkage to C18 or C45 maleimide lipids present at the membrane of liposomes. SNARE proteins were mixed with maleimide‐containing liposomes at concentrations corresponding to a SNARE:maleimide molar ratio of 1:1. Reactions were incubated for 1 h at room temperature with intermittent gentle mixing (1 min at 300 rpm every 9 min in a Thermomixer from Eppendorf). Unreacted maleimide lipid was quenched by the addition of 1 mM dithiothreitol (DTT). SNARE liposomes were recovered by flotation in a Nycodenz step gradient. Proteoliposomes were mixed with an equal volume of 80% (w/v) Nycodenz in buffer H with 1 mM DTT and transferred to Ultra‐Clear centrifuge tubes (Beckman). These 40% (w/v) Nycodenz layers were then overlaid with 30% Nycodenz in buffer H with 1 mM DTT, followed by a last layer of buffer H with 1 mM DTT. Tubes were centrifuged at 200,000 g for 4 h at 4°C in a SW55 rotor (Beckman). SNARE liposomes were harvested from the top layer and stored on ice for up to 2–3 weeks. SNARE surface density (estimated by SDS–PAGE) was typically 1 protein for 300 lipids.
FRET‐based lipid‐mixing assay
54 μl of acceptor (non‐fluorescent) liposomes at 1 mM and 45 μl of buffer H with 0.25 mM TCEP were added to the bottom of a 96‐well Nunc F96 MicroWell plate (Thermo Scientific) and pre‐warmed at 37°C for 10 min. 6 μl of donor (fluorescent) liposomes at 1 mM were carefully added to one side of the well; 15 μl of proteins at 100 μM in buffer H with 0.25 mM TCEP were added to another side of the well. The fusion reaction was initiated by shaking the plate in order to mix the three different solutions. Lipid mixing was measured by following fluorescence dequenching of the NBD probes from the donor liposomes resulting from their dilution into the acceptor liposomes. The NBD fluorescence was monitored at 1‐min intervals for 90 min (excitation at 460 nm; emission at 535 nm) by the SpectraMax M5 plate reader (Molecular Device) equilibrated to 37°C. After 90 min, 10 μl of 2.5% (w/v) n‐dodecyl‐β‐D‐maltoside (DDM) was added to completely dissolve the liposomes and thus measure the NBD fluorescence at infinite dilution; the data were then normalized by setting this maximal NBD fluorescence signal to 100% and the lowest NBD fluorescence signal to 0% 66. In experiments with pre‐formed SNARE liposomes, 54 μl of non‐fluorescent t‐SNARE liposomes at 1 mM and 60 μl of buffer H were added to the bottom of the plate, pre‐warmed at 37°C for 10 min, and the fusion reaction was initiated by adding 6 μl of fluorescent v‐SNARE liposomes at 1 mM.
Hemifusion vs. full fusion dithionite assay
To quantify the proportion of hemifused liposomes, we quenched the fluorescence of the outer monolayer of liposomes (containing 1.5 mol% DOPS‐NBD) with sodium dithionite. A 15 μl aliquot of 100 mM sodium dithionite, stored at −20°C in buffer H, was thawed right before the experiment, and incubated with 100 μl of 1 mM fluorescent donor liposomes for 15 min at 37°C. The percentage of liposomes that underwent hemifusion at time t, H(t), is given by the equation:
Where F T and F I are, respectively, the normalized fluorescence dequenching signals without and with prior sodium dithionite treatment (total lipid mixing and inner monolayer lipid mixing, respectively), and α is the proportion of lipids residing in the inner monolayer of liposomes (α = 0.4 in the case of 50 nm diameter liposomes).
Liposome docking assay with magnetic beads
50 μl of streptavidin‐coated magnetic beads (Dynabeads MyOne Streptavidin T1 from Invitrogen) were washed three times with buffer H and then incubated for 1 h at room temperature with 50 μl of 1 mM non‐fluorescent acceptor liposomes containing 2 mol% DOPE‐Biotin by intermittent gentle mixing (30 s at 500 rpm every 10 min in a Thermomixer from Eppendorf). Bead‐bound liposomes were next incubated overnight on ice with 50 μl of 1 mM fluorescent donor liposomes and 50 μl of proteins at 50 μM in buffer H containing 0.25 mM TCEP. Docked fluorescent liposomes were pulled down using a magnetic field, and samples were gently washed three times with buffer H. 15 μl of 2.5% (w/v) DDM was added to the 200 μl reaction to completely dissolve the liposomes. Streptavidin beads were removed by centrifugation at 1,500 g for 10 min, and fluorescence in the supernatant was measured with the SpectraMax M5 plate reader. In the presence of HR1, a small (4%) fluorescence dequenching signal was measured when acceptor and donor liposomes were incubated together overnight on ice. This signal (originating from lipid mixing on ice) was converted to rounds of fusion 67, and the result was subtracted from the percentage of fluorescence recovered on the magnetic beads in order to obtain the fluorescence contribution from liposome docking.
Dynamic light scattering
100 μl of liposomes at 1 mM were incubated for 1 h at 37°C with or without 100 μl of proteins at 25 μM in buffer H containing 0.25 mM TCEP. Samples were then diluted five times in a 1‐ml cuvette, and their size distribution was determined at 37°C using a Zetasizer Nano ZS (Malvern Instruments). Alternatively, 50 μl of liposomes at 1 mM and 50 μl of proteins at 25 μM were directly mixed in a low volume cuvette at t = 0 and the size distribution was monitored for 1 h at 37°C using the kinetics mode with one measurement every 5 min.
Electron microscopy
10 μl of liposomes at 1 mM were incubated for 1 h at 37°C with or without 10 μl of proteins at 25 μM in buffer H containing 0.25 mM TCEP. Samples were then diluted 20 times, and 5 μl was applied to a formvar/carbon 200 mesh copper grid (Electron Microscopy Sciences). Liposomes were allowed to sediment for 5 min at room temperature, and the solution was removed with a Whatman filter paper. 5 μl of 1% (w/v) uranyl acetate was applied to the grid for 1 min at room temperature, removed with a Whatman filter paper, and the samples were allowed to air dry at room temperature, protected from light, for at least 1 h before being observed. Samples were observed in a Tecnai 12 (FEI, The Netherlands) transmission electron microscope operating at 80 kV and equipped with a 1K × 1K Keen View camera.
Triton X‐114 phase separation assay
Triton X‐114 was preconditioned to remove most hydrophilic contaminants and thus enrich the amphiphilic molecules 48. 5 g of Triton X‐114 was dissolved on ice in 100 ml of buffer H. The clear solution was next incubated at 37°C for 15 min to exceed the cloud point, and centrifuged at room temperature for 10 min at 10,000 g to separate the two phases. The aqueous phase was discarded, and the detergent phase was supplemented with buffer H up to 100 ml. This washing procedure was repeated three times. The concentration in the third detergent phase (used in the experiments) was determined by measuring the absorbance at 275 nm.
For phase separation, proteins were diluted at 2.5 μM on ice in buffer H containing 0.5% (w/v) Triton X‐114 for a final volume of 500 μl. The solution was incubated for 15 min at 37°C and centrifuged for 10 min at 10,000 g, allowing aqueous and detergent phases to separate. The aqueous phase (~ 450 μl) was carefully removed and transferred to a new tube. The volume and Triton X‐114 concentration in both tubes was re‐adjusted to 500 μl and 0.5%, respectively. Separation in both tubes was repeated as described above. Proteins from all four resulting phases were precipitated with trichloroacetic acid and analyzed by SDS–PAGE.
Circular dichroism
100 μl of proteins at 25 μM in buffer T (10 mM Tris–HCl, pH 7.7; 150 mM KCl; 10% (v/v) Glycerol) were incubated for 30 min at 37°C with or without 100 μl of liposomes at 1 mM (prepared in buffer T). In these experiments, Tris was used to replace HEPES, which absorbs light in the far‐UV region. Circular dichroism measurements were performed at 37°C on a Jasco J‐815 spectrometer. Spectra were recorded between 260 and 200 nm, at 0.2 nm intervals and a scan speed of 50 nm/min, using a 1 mm path length Quartz Suprasil cuvette (Hellma). Final spectra were averaged over five scans. Control spectra of buffer T with or without liposomes were systematically subtracted from the proteins spectra.
To determine the α‐helical content of heptad repeat domains, experimental spectra were fitted with a linear combination of three reference spectra (random coil, α‐helix, and β‐sheet) from poly‐L‐lysine 68. Alternatively, we also used a method that directly extracts the α‐helical content from the mean residue molar ellipticity at 222 nm 69, and found similar results with the two approaches.
The free energy of HR1 partitioning‐folding into the liposome membrane was deduced from the increase of mean residue molar ellipticity at 222 nm, [θ]222, as a function of the lipid concentration 49. Briefly, the mole fraction partition coefficient was obtained by fitting [θ]222 vs. lipid concentration (Appendix Fig S10) to the following expression using nonlinear least‐square minimizations:
where [θ]222 (free) is the mean residue molar ellipticity at 222 nm in the absence of liposomes, [θ]222 (bound) is the mean residue molar ellipticity at 222 nm when all the proteins are partitioned into the liposomes (parameter fitted together with the mole fraction partition coefficient) and f p is the molar fraction of proteins partitioned into the liposomes, which is given by:
where K is the mole fraction partition coefficient, [L] is the lipid molar concentration, [W] is the water molar concentration (taken as 55.3 M). ΔG was then deduced from:
where R is the gas constant, and T is the absolute temperature.
DNA constructs for cell expression
The construct for expression of a GFP molecule targeted to the mitochondrial matrix (mtEGFP) was previously described 15, 70. The Mfn1 construct with a Myc tag at the C‐terminus (Mfn1‐Myc) was a gift from David Chan (Addgene plasmid #23212) 16. All Mfn1 mutant constructs were created in Mfn1‐Myc by polymerase chain reaction (PCR) using Phusion High‐Fidelity DNA Polymerase according to the manufacturer's instructions (New England Biolabs). The deletion of the HR1 domain (residues 350–420) was generated by two steps of overlapping PCR using the primers: forward 5′‐CACTGCTTACTGGCTTATCG‐3′ and reverse 5′‐CATCAACCAAAACAGAGTCTAGTATCTGTTTAGCTC‐3′ to amplify up to residue 349 and forward 5′‐CAGATACTAGACTCTGTTTTGGTTGATGAGTTT‐3′ and reverse 5′‐CCTCTAGAGGATCCGGATT‐3′ to amplify from residue 421 to the end. The deletion of the conserved amphipathic helix of HR1 (residues 393–410) was generated by two steps of overlapping PCR using the primers: forward 5′‐CACTGCTTACTGGCTTATCG‐3′ and reverse 5′‐TGTCATTGCACACAGTGTTAAAAGGTTCATCTGG‐3′ to amplify up to residue 392 and forward 5′‐CTTTTAACACTGTGTGCAATGACAGATGAAA‐3′ and reverse 5′‐CCTCTAGAGGATCCGGATT‐3′ to amplify from residue 411 to the end. The deletion of the HR2 domain (Mfn1 1–675) was generated by a unique PCR using the primers: forward 5′‐CACTGCTTACTGGCTTATCG‐3′ and reverse 5′‐AGTGACTCCGGAAGTGGCCATTTCTTGCTG‐3′. All constructs were cloned into Mfn1‐Myc using NheI and BspEI restriction sites.
Antibodies and cell staining reagents
The mouse anti‐Myc (9E10) primary antibody was purchased from Developmental Studies Hybridoma Bank. The donkey anti‐mouse Alexa Fluor 568‐conjugated secondary antibody and the Alexa Fluor 660‐conjugated phalloidin F‐actin staining peptide were purchased from Life Technologies.
Cell culture and transfection
Immortalized mouse embryonic fibroblasts (MEFs) lacking the endogenous Mfn1 protein (Mfn1 KO MEFs) were a gift from David Chan (California Institute of Technology, Pasadena, USA). MEFs were cultivated in Dulbecco's modified Eagle's medium (DMEM, Life Technologies) supplemented with 10% fetal bovine serum (FBS, Life Technologies) and 1% penicillin/streptomycin and were maintained at 37°C in 5% CO2. One day before transfection, the cells were seeded on coverslips for immunofluorescence. The cells were transfected using Lipofectamine 3000 (Life Technologies) according to the manufacturer's instructions optimized for MEFs: 2 h before transfection, the cells at 30–50% confluency were starved in serum‐free DMEM then transfected using a DNA (μg) to Lipofectamine 3000 (μl) ratio of 1:3 and 1 μg DNA/cm2. After 2 h, FBS was added to the media to 10% final and the cells were allowed to recover for 18–20 h before preparation for microscopy.
Immunofluorescence and microscopy
For immunofluorescence, the cells were fixed with 3.7% formaldehyde in phosphate‐buffered saline (PBS) for 10 min at room temperature. The cells were next permeabilized with 0.2% Triton X‐100 for 5 min, blocked with PBS containing 2% filtered FBS for 10 min, and incubated with the primary antibody in PBS containing 2% FBS for 1 h at room temperature. After washing, the secondary antibody and the phalloidin peptide were added for 1 h at room temperature. Coverslips were then washed with PBS to be mounted onto glass slides using Vectashield (H‐1000, Vector Laboratories). Images were acquired using a CSU‐X1 spinning disk confocal system (Yokogawa, Intelligent Imaging Innovations) on an inverted microscope (DMI6000B, Leica), with a 100×, 1.46 NA objective lens and an sCMOS camera (ORCA Flash 4.0v2+, Hamamatsu). Slidebook 6 (Intelligent Imaging Innovations) was used to acquire the images and to process them. Mitochondrial morphology was analyzed using the mitochondrial network analysis (MiNA) ImageJ macro tool 36. Mitochondria were identified using the GFP molecule targeted to their matrix (mtEGFP). Measurements were exported to Prism and displayed on box‐and‐whiskers plots. Mann–Whitney U‐tests were performed to determine whether mitochondrial morphology changes were statistically significant.
Author contributions
DT and MR designed the project; CS, CD, and MR made the constructs; CS and FP generated the data with mouse embryonic fibroblasts; CS, AB, and CD purified the proteins; FD, CS, AB, JB, and DT performed the liposome fusion assays; FD carried out the magnetic bead docking assays; FD and DT conducted the dynamic light scattering measurements; RLB and DT performed the electron microscopy experiments; PF and DT conducted the circular dichroism measurements; MR, PF, and DT performed the bioinformatics analysis; DT prepared the manuscript.
Conflict of interest
The authors declare that they have no conflict of interest.
Supporting information
Appendix
Review Process File
Acknowledgements
This work was supported by the “Agence Nationale de la Recherche” (ANR‐09‐JCJC‐0062‐01), the “Association Française contre les Myopathies” (AFM Trampoline grant 16799 and AFM Research grant 20123), the “Fondation pour la Recherche Médicale” (FRM), and funds by the “Who am I?” Labex to DT. FD received a PhD fellowship from Paris Descartes University, an “End of Thesis Grant” from the FRM, and funds by the PhD Program “Frontières du Vivant (FdV)—Cursus Bettencourt”. CS received a “Bourse de Doctorat pour Ingénieur” (BDI) fellowship from the Centre National de la Recherche Scientifique (CNRS) and an “End of Thesis Grant” from the FRM. We acknowledge the ImagoSeine core facility of the Institut Jacques Monod, associated with IBiSA and France BioImaging infrastructures (grant ANR‐10‐INBS‐04). We are indebted to the French Labex “Sciences and Engineering for Advanced Materials and devices” (SEAM) supported by “Commissariat Général à l'Investissement” (CGI) for granting access to the dynamic light scattering instrument. We are grateful to Ludovic Carlier (Université Pierre et Marie Curie, CNRS UMR 7203) for his help with circular dichroism experiments, to Anne Jaouen Vessière, Nathalie Fisher and Alice Chevalley for their assistance in C45 maleimide lipid synthesis, to Stephen Bottomley for providing the pLIC plasmid, to David Chan for providing the Mfn1‐Myc construct and the Mfn1 knockout cell line, and to David Waugh for providing the pRK793 plasmid. We thank Jean‐Michel Camadro, Gilbert Richarme, Anthony Bretscher, Badr Kilani, Margaux Merlet, and Agnès de Lacroix de Lavalette‐Boehm for advice and technical help. We also thank Thierry Galli (Sorbonne Paris Cité, INSERM URL U950) and Frédéric Pincet (Sorbonne Universités, CNRS UMR 8550) for fruitful discussions and critical reading of the manuscript.
EMBO Reports (2018) 19: e43637
References
- 1. Martens S, McMahon HT (2008) Mechanisms of membrane fusion: disparate players and common principles. Nat Rev Mol Cell Biol 9: 543–556 [DOI] [PubMed] [Google Scholar]
- 2. Chernomordik LV, Kozlov MM (2008) Mechanics of membrane fusion. Nat Struct Mol Biol 15: 675–683 [DOI] [PMC free article] [PubMed] [Google Scholar]
- 3. Jahn R, Scheller RH (2006) SNAREs–engines for membrane fusion. Nat Rev Mol Cell Biol 7: 631–643 [DOI] [PubMed] [Google Scholar]
- 4. Söllner T, Bennett MK, Whiteheart SW, Scheller RH, Rothman JE (1993) A protein assembly‐disassembly pathway in vitro that may correspond to sequential steps of synaptic vesicle docking, activation, and fusion. Cell 75: 409–418 [DOI] [PubMed] [Google Scholar]
- 5. Sutton RB, Fasshauer D, Jahn R, Brunger AT (1998) Crystal structure of a SNARE complex involved in synaptic exocytosis at 2.4 A resolution. Nature 395: 347–353 [DOI] [PubMed] [Google Scholar]
- 6. Weber T, Zemelman BV, McNew JA, Westermann B, Gmachl M, Parlati F, Söllner TH, Rothman JE (1998) SNAREpins: minimal machinery for membrane fusion. Cell 92: 759–772 [DOI] [PubMed] [Google Scholar]
- 7. McNew JA, Weber T, Parlati F, Johnston RJ, Melia TJ, Söllner TH, Rothman JE (2000) Close is not enough: SNARE‐dependent membrane fusion requires an active mechanism that transduces force to membrane anchors. J Cell Biol 150: 105–117 [DOI] [PMC free article] [PubMed] [Google Scholar]
- 8. Li F, Pincet F, Perez E, Eng WS, Melia TJ, Rothman JE, Tareste D (2007) Energetics and dynamics of SNAREpin folding across lipid bilayers. Nat Struct Mol Biol 14: 890–896 [DOI] [PubMed] [Google Scholar]
- 9. Harrison SC (2015) Viral membrane fusion. Virology 479–480: 498–507 [DOI] [PMC free article] [PubMed] [Google Scholar]
- 10. McNew JA, Sondermann H, Lee T, Stern M, Brandizzi F (2013) GTP‐dependent membrane fusion. Annu Rev Cell Dev Biol 29: 529–550 [DOI] [PubMed] [Google Scholar]
- 11. Chan DC (2006) Mitochondrial fusion and fission in mammals. Annu Rev Cell Dev Biol 22: 79–99 [DOI] [PubMed] [Google Scholar]
- 12. Chen H, Chan DC (2009) Mitochondrial dynamics–fusion, fission, movement, and mitophagy–in neurodegenerative diseases. Hum Mol Genet 18: R169–R176 [DOI] [PMC free article] [PubMed] [Google Scholar]
- 13. Legros F, Lombès A, Frachon P, Rojo M (2002) Mitochondrial fusion in human cells is efficient, requires the inner membrane potential, and is mediated by mitofusins. Mol Biol Cell 13: 4343–4354 [DOI] [PMC free article] [PubMed] [Google Scholar]
- 14. Santel A, Fuller MT (2001) Control of mitochondrial morphology by a human mitofusin. J Cell Sci 114: 867–874 [DOI] [PubMed] [Google Scholar]
- 15. Rojo M, Legros F, Chateau D, Lombès A (2002) Membrane topology and mitochondrial targeting of mitofusins, ubiquitous mammalian homologs of the transmembrane GTPase Fzo. J Cell Sci 115: 1663–1674 [DOI] [PubMed] [Google Scholar]
- 16. Chen H, Detmer SA, Ewald AJ, Griffin EE, Fraser SE, Chan DC (2003) Mitofusins Mfn1 and Mfn2 coordinately regulate mitochondrial fusion and are essential for embryonic development. J Cell Biol 160: 189–200 [DOI] [PMC free article] [PubMed] [Google Scholar]
- 17. Eura Y, Ishihara N, Yokota S, Mihara K (2003) Two mitofusin proteins, mammalian homologues of FZO, with distinct functions are both required for mitochondrial fusion. J Biochem 134: 333–344 [DOI] [PubMed] [Google Scholar]
- 18. Koshiba T, Detmer SA, Kaiser JT, Chen H, McCaffery JM, Chan DC (2004) Structural basis of mitochondrial tethering by mitofusin complexes. Science 305: 858–862 [DOI] [PubMed] [Google Scholar]
- 19. Honda S, Aihara T, Hontani M, Okubo K, Hirose S (2005) Mutational analysis of action of mitochondrial fusion factor mitofusin‐2. J Cell Sci 118: 3153–3161 [DOI] [PubMed] [Google Scholar]
- 20. Griffin EE, Chan DC (2006) Domain interactions within Fzo1 oligomers are essential for mitochondrial fusion. J Biol Chem 281: 16599–16606 [DOI] [PubMed] [Google Scholar]
- 21. Mattie S, Riemer J, Wideman JG, McBride HM (2017) A new mitofusin topology places the redox‐regulated C terminus in the mitochondrial intermembrane space. J Cell Biol 217: 507–515 [DOI] [PMC free article] [PubMed] [Google Scholar]
- 22. Meeusen S, McCaffery JM, Nunnari J (2004) Mitochondrial fusion intermediates revealed in vitro . Science 305: 1747–1752 [DOI] [PubMed] [Google Scholar]
- 23. Brandt T, Cavellini L, Kühlbrandt W, Cohen MM (2016) A mitofusin‐dependent docking ring complex triggers mitochondrial fusion in vitro . Elife 5: e14618 [DOI] [PMC free article] [PubMed] [Google Scholar]
- 24. Praefcke GJ, McMahon HT (2004) The dynamin superfamily: universal membrane tubulation and fission molecules? Nat Rev Mol Cell Biol 5: 133–147 [DOI] [PubMed] [Google Scholar]
- 25. Zhang Y, Chan DC (2007) New insights into mitochondrial fusion. FEBS Lett 581: 2168–2173 [DOI] [PMC free article] [PubMed] [Google Scholar]
- 26. Qi Y, Yan L, Yu C, Guo X, Zhou X, Hu X, Huang X, Rao Z, Lou Z, Hu J (2016) Structures of human mitofusin 1 provide insight into mitochondrial tethering. J Cell Biol 215: 621–629 [DOI] [PMC free article] [PubMed] [Google Scholar]
- 27. Cao YL, Meng S, Chen Y, Feng JX, Gu DD, Yu B, Li YJ, Yang JY, Liao S, Chan DC et al (2017) MFN1 structures reveal nucleotide‐triggered dimerization critical for mitochondrial fusion. Nature 542: 372–376 [DOI] [PMC free article] [PubMed] [Google Scholar]
- 28. Huang P, Galloway CA, Yoon Y (2011) Control of mitochondrial morphology through differential interactions of mitochondrial fusion and fission proteins. PLoS One 6: e20655 [DOI] [PMC free article] [PubMed] [Google Scholar]
- 29. Franco A, Kitsis RN, Fleischer JA, Gavathiotis E, Kornfeld OS, Gong G, Biris N, Benz A, Qvit N, Donnelly SK et al (2016) Correcting mitochondrial fusion by manipulating mitofusin conformations. Nature 540: 74–79 [DOI] [PMC free article] [PubMed] [Google Scholar]
- 30. Hoekstra D, Klappe K (1993) Fluorescence assays to monitor fusion of enveloped viruses. Methods Enzymol 220: 261–276 [DOI] [PubMed] [Google Scholar]
- 31. Tareste D, Shen J, Melia TJ, Rothman JE (2008) SNAREpin/Munc18 promotes adhesion and fusion of large vesicles to giant membranes. Proc Natl Acad Sci USA 105: 2380–2385 [DOI] [PMC free article] [PubMed] [Google Scholar]
- 32. Ji H, Coleman J, Yang R, Melia TJ, Rothman JE, Tareste D (2010) Protein determinants of SNARE‐mediated lipid mixing. Biophys J 99: 553–560 [DOI] [PMC free article] [PubMed] [Google Scholar]
- 33. Hamilton BS, Whittaker GR, Daniel S (2012) Influenza virus‐mediated membrane fusion: determinants of hemagglutinin fusogenic activity and experimental approaches for assessing virus fusion. Viruses 4: 1144–1168 [DOI] [PMC free article] [PubMed] [Google Scholar]
- 34. Otterstrom J, van Oijen AM (2013) Visualization of membrane fusion, one particle at a time. Biochemistry 52: 1654–1668 [DOI] [PubMed] [Google Scholar]
- 35. Brunger AT, Cipriano DJ, Diao J (2015) Towards reconstitution of membrane fusion mediated by SNAREs and other synaptic proteins. Crit Rev Biochem Mol Biol 50: 231–241 [DOI] [PMC free article] [PubMed] [Google Scholar]
- 36. Valente AJ, Maddalena LA, Robb EL, Moradi F, Stuart JA (2017) A simple ImageJ macro tool for analyzing mitochondrial network morphology in mammalian cell culture. Acta Histochem 119: 315–326 [DOI] [PubMed] [Google Scholar]
- 37. Takamori S, Holt M, Stenius K, Lemke EA, Grønborg M, Riedel D, Urlaub H, Schenck S, Brügger B, Ringler P et al (2006) Molecular anatomy of a trafficking organelle. Cell 127: 831–846 [DOI] [PubMed] [Google Scholar]
- 38. Ardail D, Privat JP, Egret‐Charlier M, Levrat C, Lerme F, Louisot P (1990) Mitochondrial contact sites. Lipid composition and dynamics. J Biol Chem 265: 18797–18802 [PubMed] [Google Scholar]
- 39. Jotwani A, Richerson DN, Motta I, Julca‐Zevallos O, Melia TJ (2012) Approaches to the study of Atg8‐mediated membrane dynamics in vitro . Methods Cell Biol 108: 93–116 [DOI] [PubMed] [Google Scholar]
- 40. Lu X, Zhang F, McNew JA, Shin YK (2005) Membrane fusion induced by neuronal SNAREs transits through hemifusion. J Biol Chem 280: 30538–30541 [DOI] [PubMed] [Google Scholar]
- 41. Shen J, Tareste DC, Paumet F, Rothman JE, Melia TJ (2007) Selective activation of cognate SNAREpins by Sec1/Munc18 proteins. Cell 128: 183–195 [DOI] [PubMed] [Google Scholar]
- 42. Hernandez JM, Stein A, Behrmann E, Riedel D, Cypionka A, Farsi Z, Walla PJ , Raunser S, Jahn R (2012) Membrane fusion intermediates via directional and full assembly of the SNARE complex. Science 336: 1581–1584 [DOI] [PMC free article] [PubMed] [Google Scholar]
- 43. Park Y, Vennekate W, Yavuz H, Preobraschenski J, Hernandez JM, Riedel D, Walla PJ, Jahn R (2014) α‐SNAP interferes with the zippering of the SNARE protein membrane fusion machinery. J Biol Chem 289: 16326–16335 [DOI] [PMC free article] [PubMed] [Google Scholar]
- 44. Rigaud J, Lévy D (2003) Reconstitution of membrane proteins into liposomes. Methods Enzymol 372: 65–86 [DOI] [PubMed] [Google Scholar]
- 45. Baxa U (2018) Imaging of liposomes by transmission electron microscopy. Methods Mol Biol 1682: 73–88 [DOI] [PubMed] [Google Scholar]
- 46. Schuette CG, Hatsuzawa K, Margittai M, Stein A, Riedel D, Küster P, König M, Seidel C, Jahn R (2004) Determinants of liposome fusion mediated by synaptic SNARE proteins. Proc Natl Acad Sci USA 101: 2858–2863 [DOI] [PMC free article] [PubMed] [Google Scholar]
- 47. Holt M, Riedel D, Stein A, Schuette C, Jahn R (2008) Synaptic vesicles are constitutively active fusion machines that function independently of Ca2+ . Curr Biol 18: 715–722 [DOI] [PMC free article] [PubMed] [Google Scholar]
- 48. Bordier C (1981) Phase separation of integral membrane proteins in Triton X‐114 solution. J Biol Chem 256: 1604–1607 [PubMed] [Google Scholar]
- 49. White SH, Wimley WC, Ladokhin AS, Hristova K (1998) Protein folding in membranes: determining energetics of peptide‐bilayer interactions. Methods Enzymol 295: 62–87 [DOI] [PubMed] [Google Scholar]
- 50. Li Y, Han X, Tamm LK (2003) Thermodynamics of fusion peptide‐membrane interactions. Biochemistry 42: 7245–7251 [DOI] [PubMed] [Google Scholar]
- 51. Drin G, Antonny B (2010) Amphipathic helices and membrane curvature. FEBS Lett 584: 1840–1847 [DOI] [PubMed] [Google Scholar]
- 52. Liang B, Dawidowski D, Ellena JF, Tamm LK, Cafiso DS (2014) The SNARE motif of synaptobrevin exhibits an aqueous‐interfacial partitioning that is modulated by membrane curvature. Biochemistry 53: 1485–1494 [DOI] [PMC free article] [PubMed] [Google Scholar]
- 53. Vamparys L, Gautier R, Vanni S, Bennett WF, Tieleman DP, Antonny B, Etchebest C, Fuchs PF (2013) Conical lipids in flat bilayers induce packing defects similar to that induced by positive curvature. Biophys J 104: 585–593 [DOI] [PMC free article] [PubMed] [Google Scholar]
- 54. Kweon DH, Kim CS, Shin YK (2003) Insertion of the membrane‐proximal region of the neuronal SNARE coiled coil into the membrane. J Biol Chem 278: 12367–12373 [DOI] [PubMed] [Google Scholar]
- 55. Ellena JF, Liang B, Wiktor M, Stein A, Cafiso DS, Jahn R, Tamm LK (2009) Dynamic structure of lipid‐bound synaptobrevin suggests a nucleation‐propagation mechanism for trans‐SNARE complex formation. Proc Natl Acad Sci USA 106: 20306–20311 [DOI] [PMC free article] [PubMed] [Google Scholar]
- 56. Liu TY, Bian X, Sun S, Hu X, Klemm RW, Prinz WA, Rapoport TA, Hu J (2012) Lipid interaction of the C terminus and association of the transmembrane segments facilitate atlastin‐mediated homotypic endoplasmic reticulum fusion. Proc Natl Acad Sci USA 109: E2146–E2154 [DOI] [PMC free article] [PubMed] [Google Scholar]
- 57. Faust JE, Desai T, Verma A, Ulengin I, Sun TL, Moss TJ, Betancourt‐Solis MA, Huang HW, Lee T, McNew JA (2015) The Atlastin C‐terminal tail is an amphipathic helix that perturbs the bilayer structure during endoplasmic reticulum homotypic fusion. J Biol Chem 290: 4772–4783 [DOI] [PMC free article] [PubMed] [Google Scholar]
- 58. Ha EE, Frohman MA (2014) Regulation of mitochondrial morphology by lipids. BioFactors 40: 419–424 [DOI] [PMC free article] [PubMed] [Google Scholar]
- 59. Zhang W, Chipman PR, Corver J, Johnson PR, Zhang Y, Mukhopadhyay S, Baker TS, Strauss JH, Rossmann MG, Kuhn RJ (2003) Visualization of membrane protein domains by cryo‐electron microscopy of dengue virus. Nat Struct Biol 10: 907–912 [DOI] [PMC free article] [PubMed] [Google Scholar]
- 60. Baoukina S, Tieleman DP (2010) Direct simulation of protein‐mediated vesicle fusion: lung surfactant protein B. Biophys J 99: 2134–2142 [DOI] [PMC free article] [PubMed] [Google Scholar]
- 61. Han X, Bushweller JH, Cafiso DS, Tamm LK (2001) Membrane structure and fusion‐triggering conformational change of the fusion domain from influenza hemagglutinin. Nat Struct Biol 8: 715–720 [DOI] [PubMed] [Google Scholar]
- 62. Kanaseki T, Kawasaki K, Murata M, Ikeuchi Y, Ohnishi S (1997) Structural features of membrane fusion between influenza virus and liposome as revealed by quick‐freezing electron microscopy. J Cell Biol 137: 1041–1056 [DOI] [PMC free article] [PubMed] [Google Scholar]
- 63. Victor BL, Lousa D, Antunes JM, Soares CM (2015) Self‐assembly molecular dynamics simulations shed light into the interaction of the influenza fusion Peptide with a membrane bilayer. J Chem Inf Model 55: 795–805 [DOI] [PubMed] [Google Scholar]
- 64. Cabrita LD, Dai W, Bottomley SP (2006) A family of E. coli expression vectors for laboratory scale and high throughput soluble protein production. BMC Biotechnol 6: 12 [DOI] [PMC free article] [PubMed] [Google Scholar]
- 65. Kapust RB, Tozser J, Fox JD, Anderson DE, Cherry S, Copeland TD, Waugh DS (2001) Tobacco etch virus protease: mechanism of autolysis and rational design of stable mutants with wild‐type catalytic proficiency. Protein Eng Des Sel 14: 993–1000 [DOI] [PubMed] [Google Scholar]
- 66. Scott BL, Van Komen JS, Liu S, Weber T, Melia TJ, McNew JA (2003) Liposome fusion assay to monitor intracellular membrane fusion machines. Methods Enzymol 372: 274–300 [DOI] [PubMed] [Google Scholar]
- 67. Parlati F, Weber T, McNew JA, Westermann B, Söllner TH, Rothman JE (1999) Rapid and efficient fusion of phospholipid vesicles by the alpha‐helical core of a SNARE complex in the absence of an N‐terminal regulatory domain. Proc Natl Acad Sci USA 96: 12565–12570 [DOI] [PMC free article] [PubMed] [Google Scholar]
- 68. Greenfield N, Fasman GD (1969) Computed circular dichroism spectra for the evaluation of protein conformation. Biochemistry 8: 4108–4116 [DOI] [PubMed] [Google Scholar]
- 69. Wieprecht T, Beyermann M, Seelig J (2002) Thermodynamics of the coil–α‐helix transition of amphipathic peptides in a membrane environment: the role of vesicle curvature. Biophys Chem 96: 191–201 [DOI] [PubMed] [Google Scholar]
- 70. Rizzuto R, Brini M, Pizzo P, Murgia M, Pozzan T (1995) Chimeric green fluorescent protein as a tool for visualizing subcellular organelles in living cells. Curr Biol 5: 635–642 [DOI] [PubMed] [Google Scholar]
- 71. Gautier R, Douguet D, Antonny B, Drin G (2008) HELIQUEST: a web server to screen sequences with specific alpha‐helical properties. Bioinformatics 24: 2101–2102 [DOI] [PubMed] [Google Scholar]
Associated Data
This section collects any data citations, data availability statements, or supplementary materials included in this article.
Supplementary Materials
Appendix
Review Process File