

ABSTRACT
Gut microbiota dysbiosis has been associated with inflammatory bowel diseases (IBD). In colorectal cancer, the gut microbiota has also been recognized as potentially involved in aggravating or favoring the tumor development. However, very little is known on the structure and role of the microbiota in colitis associated cancer (CAC), an important complication of IBD in human. Here we analyzed the bacterial and fungal composition of the mucosa associated microbiota of patients suffering CAC, sporadic cancer (SC) and of healthy subjects (HS) by barcode sequences analysis on the following cohort: 7 CAC patients, 10 SC patients and 10 HS using 16S (MiSeq) and ITS2 (pyrosequencing) sequencing, for bacteria and fungi respectively. Mucosa-associated bacterial microbiota in CAC was significantly different from the ones in SC or in HS, while the fungal showed no differences. Comparison between mucosa-associated microbiota on the tumor site or in normal mucosa near the tumor showed very similar patterns. The global mucosa-associated bacterial microbiota in cancer patients was characterized by a restriction in biodiversity but no change for the fungal community. Compared to SC, CAC was characterized by an increase of Enterobacteriacae family and Sphingomonas genus and a decrease of Fusobacterium and Ruminococcus genus. Our study confirms the alteration of the mucosa-associated bacterial microbiota in IBD and SC. Although the cohort is limited in number, this is the first evidence of the existence of an altered bacterial microbiota in CAC clearly different from the one in SC patients.
KEYWORDS: Cancer, Inflammatory bowel disease, mucosa-associated microbiota, fungal microbiota, dysbiosis
Introduction
Colorectal cancer (CRC) is the third commonest cancer type worldwide with, every year, 1,360,000 new cases and 600,000 deaths.1,2 Its incidence rate is rapidly rising in less developed regions, with a poorer prognosis compared to western countries where routine diagnosis have been efficient in reducing the incidence and mortality. Although multifactorial, a strong interest arose in the role of the intestinal microbiota in epidemics of CRC. First involvement of infection agents has been scrutinized, Helicobacter pylori, Escherichia coli polyketide synthases positive strains (pks+) or Streptococcus bovis are the bacteria most often described as associated with colonic neoplasia, although there are still debates over these associations with few contradictory results.3 With the dramatic progresses of the sequencing technics in the last decade, correlation between disease, and microbiota dysbiosis was made possible: several studies showed a clear association between bacterial microbiota dysbiosis and CRC.4,5 Thanks to these technical developments, several studies have identified specific bacteria from the gut with pro-carcinogen effect like enterotoxigenic Bacteroides fragilis or Fusobacterium nucleatum. F. nucleatum has been shown to promote intestinal tumorigenesis in mice,6 and is even presented as a putative prognosis factor in CRC.7,8
In parallel, patients with inflammatory bowel diseases (IBD) have chronic gut inflammation, which is a potent risk factor for colon cancer, called in that particular case: colitis-associated cancer (CAC). As with the CRC, IBD development is influenced by modifications of the gut microbiota and clear evidence of a microbial dysbiosis has been shown in patients with IBD.9 Specific bacteria involved in IBD have also been identified, one of the most often described is a protective one, the commensal Faecalibacterium prauznitsii which population decreases in IBD patients, and administration of F. prausnitzii strain A2-165 and its culture supernatant have been shown to protect against 2,4,6-trinitrobenzenesulfonic acid (TNBS)-induced colitis in mice.10 However, to date very little is known on the structure and function of the microbiota in CAC and how it differs from the microbiota of sporadic cancer (SC) patients (CRC without IBD).
In this study we investigated, through barcode sequences analyses, the mucosa-associated microbiota of SC and CAC patients in comparison to healthy subjects (HS) taking into account both bacterial and fungal fractions. We showed that, contrary to fungi which remain stable, a bacterial dysbiosis is present in CAC gut microbiota that is specific and different from the dysbiosis observed in SC patients.
Results
Bacterial microbiota diversity
Our study population was composed of 7 patients with CAC, 10 patients with SC and 10 HS (Table 1). For all patients with cancer, we analyzed cancer-associated microbiota and normal mucosa (close to the tumor)-associated microbiota. We first analyzed the bacterial fraction of the microbiota using 16S sequencing. A beta diversity evaluation, represented by a principal coordinate analysis (PCA), showed a clustering of samples according to disease phenotypes with a significant difference between HS and both SC and CAC, but also between SC and CAC (Fig. 1A, p = 0.01). However, no clear clustering was observed between microbiota on tumor site and on healthy mucosa close to the tumor for both CAC and SC patients (Figs. 1A, S1A and B).
Table 1.
Demographic and clinical data of studied population.
| CAC | SC | HS | |
|---|---|---|---|
| N. | 7 | 10 | 10 |
| Male n (%) | 5 (71) | 5 (50) | 7 (70) |
| Mean age (± SD, yr) | 50.7±10 | 68.8 ± 12.1 | 48.3 ± 13.4 |
| Montreal classification n (%) | |||
| Crohn, L2 | 1 (14) | — | — |
| Ulcerative colitis, E2 | 5 (72) | — | — |
| Ulcerative colitis, E3 | 1 (14) | — | — |
| Colorectal cancer | |||
| Right colon / Left colon / Rectum n(%) | 1 (14) / 4 (57) / 2 (28) | 4 (40) / 4 (40) / 2 (20) | |
| T1 / T2 / T3 /T4 n(%) | 2 (28) / 0 / 5 (72) / 0 | 0 / 1 (10) / 8 (80) / 1 (10) | |
| N0 / N1 / N2 n(%) | 6 (86) / 0 / 1 (14) | 5 (50) / 4 (40) / 1 (10) | |
| M1 n(%) | 1 (14) | 0 | |
| Previous abdominal surgery n (%) | 1 (14) | 4 (40) | 3 (33) |
| Current Treatment n (%) | |||
| 5-aminosalicylic acid | 4 (57) | — | — |
| Azathioprine | 1 (14) | — | — |
| Previous Treatment n (%) | |||
| 5-aminosalicylic acid | 7 (100) | — | — |
| Corticosteroids | 6 (86) | — | — |
| Azathioprine | 4 (57) | — | — |
| Infliximab | 1 (14) | — | — |
| Adalimumab | 1 (14) | — | — |
Figure 1.
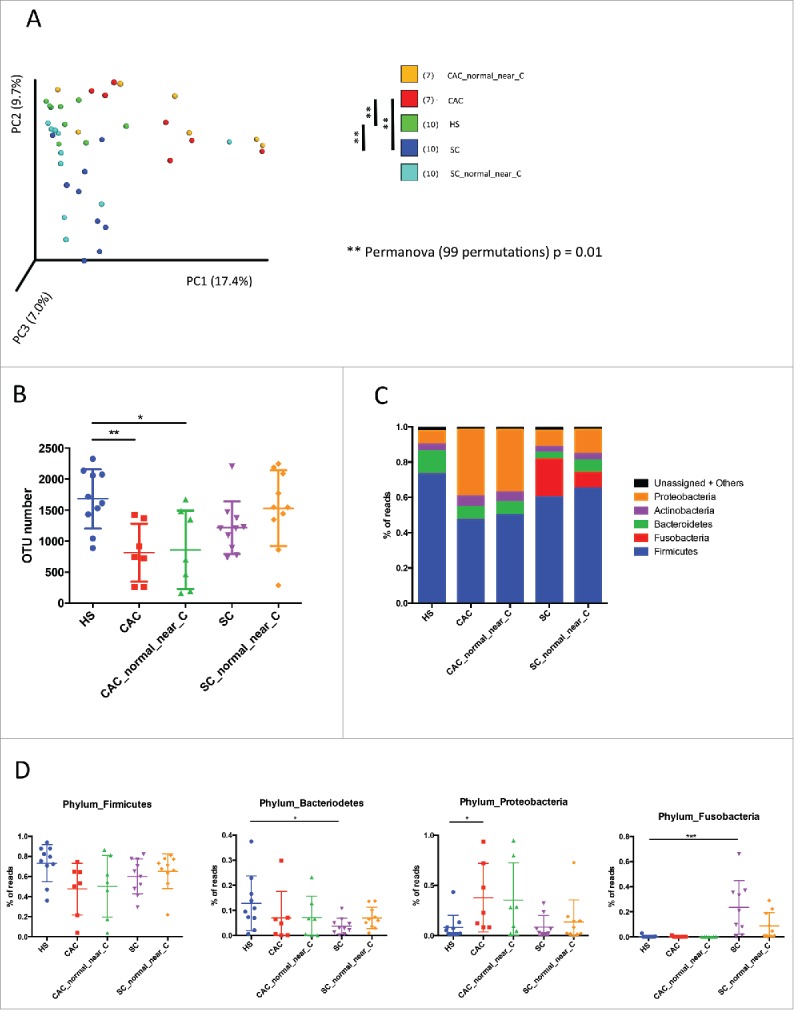
Bacterial microbiota biodiversity and composition. (A) Beta diversity. Principal coordinate analysis of Bray-Curtis dissimilarity with each sample colored by the disease phenotype. PC1, PC2, and PC3 represent the top three principal coordinates that captured most of the diversity, with the fraction of diversity captured by that coordinate shown percent. Differences between groups were tested using Permanova test [** = p < 0.01]. (B) Chao1 index describing the diversity of the bacterial microbiota in the different groups studied at species level [ANOVA, multiple comparisons test, * = p < 0.05]. (C) Global composition of bacteria at phylum level. Healthy subjects [HS] and patient sub-groups are labeled on the x-axis and expressed as relative operational taxonomic units [OTUs] abundance per each group. (D) Data for specific phylum individually represented for each patient and expressed as relative OTUs abundance per each group [ANOVA, multiple comparisons test, * = p < 0.05, ** = p < 0.01, *** = p < 0.01]
Based on different indicators (Chao1 index and number of OTU observed) we observed a strong decrease in biodiversity (alpha diversity) of CAC patients samples compared to HS. This result was observed in samples from the tumor site and the healthy site nearby (Figs. 1B, S1C). The biodiversity in SC patients at both tumor and nearby sites is however stable and comparable to the HS.
Bacterial microbiota composition
As expected, the large majority of the bacteria from SC, CAC and HS samples belonged to the phyla Firmicutes, Bacteroidetes, Fusobacteria, Proteobacteria and Actinobacteria (Fig. 1C). Distribution of the major phyla in HS was in accordance with published data. Samples from CAC and SC patients exhibit clear differences compared to HS. Firmicutes and Bacteroidetes were the most abundant phyla in HS, followed by Proteobacteria and Actinobacteria. In CAC patients, a decreasing trend of Firmicutes and Bacteroidetes was observed with a significant increase of Proteobacteria (Fig. 1D). In SC patients, a decrease of Bacteroidetes was observed but with a strong bloom of Fusobacteria, specific to these patients (Fig. 1D). No visible changes were observed for minor phyla in CAC or SC versus HS patients.
Differential bacterial composition
We then compared the bacterial composition between studied groups using LEfSe (Linear discriminant analysis Effect Size).18 While, in beta diversity the microbiota between tumor and close to the tumor clustered well, we studied whether one can identify specific bacterial taxa that would be differentially represented. When comparing CAC microbiota to the microbiota in the normal mucosa nearby, Streptococcus genus was specifically identified as increasing in CAC (Supp Fig 2A and B), with no significant difference when compared to the HS (data not shown). The major differences observed between SC and SC close to the tumor were in Bacteriodetes and Firmicutes phyla (Fig. 2A). Erysipelotrichacea family as well as Lactobacillales order were the only bacterial taxa overrepresented in SC and belong to the Firmicutes. Blautia and Faecalibacterium were the only Firmicutes genera significantly underrepresented in SC tumor site compared to healthy site near the tumor. Within Bacteroidetes, the Parabacteroides and the Bacteroides genera, and particularly the species B. uniformis, were underrepresented in SC tumor site (Fig. 2A and B).
Figure 2.

Bacterial enrichment. (A) Bacterial taxa differentially enriched or depleted in Sporadic Cancer (SC) versus the normal mucosa nearby (generated using LEfSe analysis, LDA score >2). (B) Example of specific taxa individually represented for each patients differentially enriched in Sporadic Cancer (SC) versus the normal mucosa nearby [t test, * = p < 0.05]. (C) Bacterial taxa differentially enriched in SC versus CAC or CAC versus SC (generated using LEfSe analysis, LDA score >2). [D] Example of specific taxa individually represented for each patients differentially enriched in SC versus CAC or CAC versus SC [t test, * = p < 0.05, *** = p <0.01].
When we compared the two types of cancer: CAC to SC (Fig. 2C and D), bacteria belonging to the Proteobacteria phylum were more represented in CAC compared to SC. Bradyrhizobiaceae and Enterobacteriaceae were the two families overrepresented in the CAC. While in Firmicutes, only Caldinitratiruptor microaerophilus was significantly more present in CAC. Microbacterium was the only Actinobacteria genus identified as overrepresented in the CAC. On the contrary Fusobacteria and Firmicutes were the phyla the more represented in the SC compared to CAC. Fusobacterium genus was the Fusobacteria overrepresented in SC, while it was Parvimonas, Ruminococcus and Phascolarctobacterium genera that were the Firmicutes overrepresented in SC.
Fungal microbiota quantification, diversity and composition
Contrary to bacterial microbiota data, beta diversity evaluation, represented by a principal coordinate analysis (PCA), did not show any clustering of samples according to disease phenotypes (Fig. 3A). Fungi biodiversity analysis (alpha diversity) showed that the Chao1 index of all samples were very similar to the indexes for the healthy subjects. The only tendency visible was a decrease of diversity in the SC at a normal site compared to the HS or the SC patients (Figs. 3B, S2B).
Figure 3.
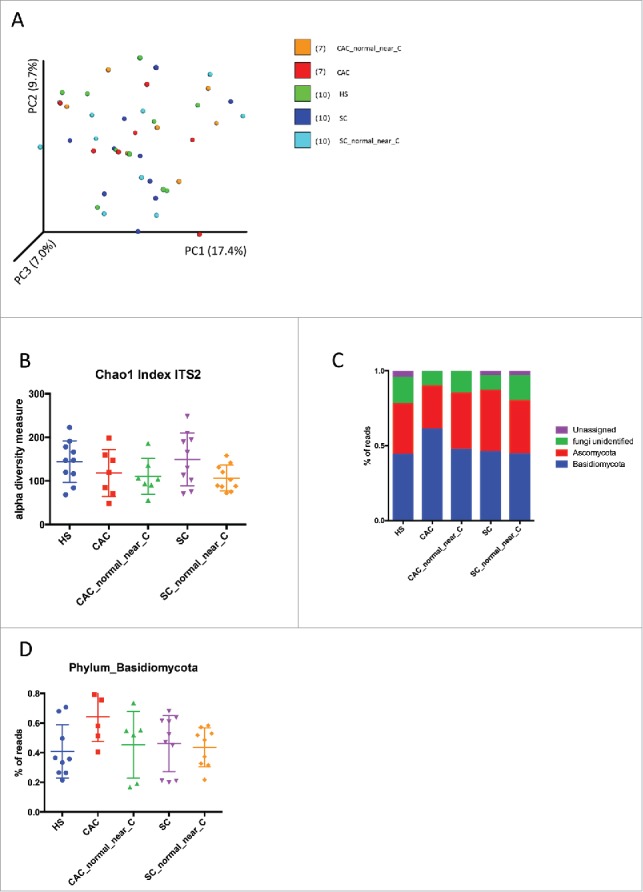
Fungal microbiota biodiversity and composition. (A) Beta diversity. Principal coordinate analysis of Bray-Curtis dissimilarity with each sample colored by the disease phenotype. PC1, PC2, and PC3 represent the top three principal coordinates that captured most of the diversity, with the fraction of diversity captured by that coordinate shown percent. (B) Chao1 index describing the diversity of the fungal microbiota in the different groups studied. (C) Global composition of fungi at phylum level. Healthy subjects [HS] and patient sub-groups are labeled on the x-axis and expressed as relative OTUs abundance per each group. (D) Data for the Basidiomycota phylum individually represented for each patient and expressed as relative OTUs abundance per each group.
In HS, CAC and SC, the colonic mucosa-associated fungal microbiota was dominated by two phyla, Basidiomycota and Ascomycota. Importantly, a significant proportion of the sequences were assigned to unidentified fungi reflecting the poor annotation of current fungi database (Fig. 3C, S2C). The increase in the number of the proportion of Basidiomycota reads in CAC compared to the other subjects was clearly visible but did not reach the significance p-value (Fig. 3D). In all samples, the Tremellomycetes and Saccharomycetes were the dominant classes in Basidiomycota and Ascomycota phyla, respectively. Exobasibiomycetes were present mainly in CAC. The most represented genera were Debaryomyces, Malassezia and unidentified Filodasidiaceae for all patients, and specifically Penicillium in SC (Table S1).
Using LEfSe, we compared samples from HS, CAC and SC subjects at the tumor site or near it but we did not observe significant differences, in any comparison.
Discussion
While the involvement of the microbiota has been thoroughly documented in the IBD and SC pathogenesis, the data on the contribution of the intestinal microbiota in the CAC pathogenesis are scarce. In the current study with a small cohort of patients, we compared for the first time the bacterial and fungal mucosa-associated microbiota in CAC patients to the ones in SC and HS.
Concerning the fungal microbiota, we observed an increase in biodiversity in SC. We did not observe any significant difference in the microbiota composition between the studied groups. The only notable trend was the increase proportion of Basidiomycota in CAC mucosa suggesting a local dysbiosis. However this signal did not reach statistical significance possibly because of too low number of subjects. Not surprisingly the modification of the Basidiomycota/Ascomycota ratio is one of the features that we identified in a recent study on the modification of the fungal microbiota in IBD patients.25
However, we showed that a dysbiosis different from the one observed in SC was present at the bacterial level in CAC suggesting a differential role of bacteria in CAC compared to SC pathogenesis. Beta diversity analysis clearly showed that SC and CAC mucosa-associated microbiota clustered distinctly, suggesting a strong link between microbiota and disease and some specificity between SC and CAC. Interestingly, for both SC and CAC, the mucosal-associated microbiota on the tumor site or near the tumor site clustered together. Although several significant differences were observed between cancer and healthy mucosa for SC, only minor changes were observed for CAC, suggesting that if the microbiota is involved in CAC carcinogenesis, the oncogenic microbes are not limited to the cancer site. The alpha diversity analysis confirmed this trend. A decrease of biodiversity was observed in CAC on both cancer site and close healthy mucosa, whereas in SC the decrease of biodiversity was observed only in cancer site.
Major differences in bacterial composition were observed. The composition of CAC and SC mucosa-associated microbiota were clearly modified from the HS microbiota: a clear reduction of Firmicutes and Bacteroidetes were observed in both cases. While in CAC patients a bloom of Proteobacteria was observed, in SC the strong increase of Fusobacteria was the principal feature. These results confirmed the published data on SC associated microbiota7 and indicated that the increase in Fusobacteria phylum was not only characteristic of the fecal microbiota but also of the mucosa-associated one.
The comparison of the mucosa-associated microbiota between CAC and SC confirmed the significant enrichment in Fusobacterium in SC. Several other genera were significantly increased in SC such as Ruminococcus, Phascolarctobacterium and to a lesser extend Parvimonas. In accordance with these results, Parvimonas micra and Phascolarctobacterium have been described in several studies as more abundant in patients with CRC.26,27 Among the strains particularly enriched in CAC compared to SC, many belonged to the Proteobacteria phylum such as Morganella or Sphingomonas genus.
If a microorganism is involved in carcinogenesis, we can expect that it will be enriched in the cancer tissue itself. Streptococcus genus was the only genera enriched in CAC microbiota compared to the surrounding healthy mucosa. Interestingly, Streptococcus bovis28 and S. gallolyticus have been associated with colorectal tumors.29
In SC, we observed that the genus Parabacteroides and two genera within the Ruminococcaceae family: Faecalibacterium and Blautia, were less represented in SC at the tumor site compared to the normal surrounding mucosa. Faecalibacterium prausnitzii has been showed to have anti-inflammatory properties, and to be underrepresented in the microbiota of IBD patients.30 Moreover, Faecalibacterium prausnitzii, as well as Blautia, have also been reported to be decreased in the microbiota of CRC patients compared to HS.31 As for Parabacteroides, several different species are described as enriched in carcinoma samples compared with both healthy and adenoma samples.32 These direct comparisons between cancer site and surrounding healthy mucosa suggest that Parabacteroides might play a role in the carcinogenesis process whereas Faecalibacterium prausnitzii and Blautia might be protective.
We can connect that to the generally accepted “driver-passenger” model for colorectal cancer, where certain indigenous intestinal bacteria drive (the drivers) the initiation of the CRC and consequently the tumorigenesis induces intestinal niche alterations that favor the proliferation of opportunistic bacteria (named passengers). In turns, the passengers bacteria can have a pro- or anti-oncogenic effect on the host cells. At that point, the driver bacteria can disappear from the cancer environment because they are outcompeted by passenger bacteria with growth advantage in the tumor microenvironment.33 For instance, Streptococcaceae have been described as potential passengers bacteria with pro-oncogene effect, which we confirm in our study with the enrichment of Streptococcus in CAC tumor sites. Alternatively, in SC, we showed that F. praustnitzii and Blautia, commonly reported as decreased in inflammation-associated microbiota, were more abundant outside of the tumor microenvironment. That might suggest that at the tumor site, the microenvironment is not favorable to these two positive strains, which cannot have their anti-inflammatory effect and thus indirectly promote the development of the tumor. Theoretically, it would be informative to test the effect of these dysbiotic microbiota on the host by transfer of the mucosal-associated microbiota of CAC and SC a in germ free (GF) mice, but so far such microbiota is not usable for these experiments. In this setting the analysis of the mucosal immune cells could tell whether these microbiota compared to a microbiota from healthy patient skew the immune response toward a pro-inflammatory response or if the carcinogenic effect is completely independent to the mucosal immune cells response.
The contribution of the intestinal microbiota in the CAC pathogenesis was to date unknown. In this study, we compared in a limited cohort of 7 to 10 patients the bacterial and fungal mucosa-associated microbiota in CAC patients to the ones in SC and HS. Our study gives the first evidences that the mucosa-associated bacterial microbiota in CAC is significantly different from the ones in SC or in HS, while the fungal shows no differences. Interestingly, comparison between mucosa-associated microbiota on the tumor site or in normal mucosa near the tumor showed very similar patterns. The global mucosa-associated bacterial microbiota in cancer patients was characterized by a restriction in biodiversity but no change for the fungal community. This study should be followed by a by a larger one with a bigger cohort were luminal microbiota can be compared with the mucosal associated microbiota in order to detect whether specific micro-organisms in contact with the mucosa can affect the development of tumors.
Material and methods
Study population
Our single-center, prospective, observational study was conducted at the S. Orsola-Malpighi's Hospital, Bologna, Italy. 7 patients with CAC, 10 patients with SC and 10 HS were enrolled in the study (Table 1). Study “9/2013/U/Tess” was approved by ethical committee of S. Orsola Malpighi Hospital of Bologna. The HS samples are the same published in Liguori G. et al.,11 they were sequenced altogether with the samples for this study.
CAC (mean age 50.7 ± 10 years, 71% men) and SC (mean age 68.8 ± 12.1 years, 50% men) were diagnosed according to classical clinical, endoscopic and histological parameters. No radiotherapy or chemotherapy was done before the enrollment in both groups of patients. Staging of cancer was described according to TNM Classification of Malignant Tumors (TNM).
IBD phenotype was defined according the Montreal classification. Major exclusion criteria for all the groups of patients were infectious colitis, coagulation disorders or concomitant treatment with anticoagulant therapy, and treatment with antibiotics or antifungal treatments in the two months before inclusion.
Control group (mean age 48.3 ± 13.4 years, 70% men) was constituted by HS without history or clinical symptoms of intestinal disorders and endoscopic or histological signs of cancer or IBD. HS underwent colonoscopy during routine surveillance screening.
All the subjects gave written informed consent to participate to the study, which was approved by the local research ethical committee.
Samples collection
Surgical specimens of colonic mucosa of CAC and SC were taken during colonic resection. In particular, specimens of cancer and normal mucosa near cancer (distance < 5 cm), were taken. Sampling in HS was performed during colonoscopy using standardized biopsies (Olympus forceps FB-24Q) of the right colon.
All the samples were immediately put in liquid nitrogen and stored at −80°C before processing.
DNA extraction
DNA was extracted from 1 or 2 biopsies of colonic mucosa as previously described.12 For the mechanical lysis step, we used the FastPrep® (three cycles of 30 seconds at 6,5 m/s, cooling samples in ice for 5 minutes between each cycle) and a mix of two sizes of glass beads (0.1 and 0.5 mm) to optimize fungal DNA extraction. Nucleic acids were precipitated by isopropanol for 10 minutes at room temperature, followed by incubation for 15 minutes on ice, and centrifugation for 30 minutes at 24.000g and 4°C. Pellets were suspended in 225 µL of phosphate buffer and 25 µL of potassium acetate. After the RNase treatment and DNA precipitation, nucleic acids were recovered by centrifugation at 24000g and 4°C for 30 minutes. The DNA pellet was finally suspended in 30 µL of TE buffer and concentration was assessed using Nanodrop® spectrophotometer.
Real-time quantitative PCR
16S or 18S ribosomal RNA relative quantification were determined by Real-time quantitative PCR (qPCR) using an ABI 7000 Sequence Detection System apparatus with 7000 system software v. 1.2.3 (Applied Biosystems, Foster City, CA). Amplification and detection were carried out in 96-well plates and with TaqMan universal PCR 2X master mix (Applied Biosystems) to quantify total bacteria and with SYBR-Green PCR 2X master mix to quantify total fungi. Each reaction was done in duplicate in a final volume of 25 µL with 10 µL of appropriate dilutions of DNA sample. Amplifications were performed as follows: 95°C for 10 minutes, to denature DNA and activate Ampli-Taq Gold polymerase, followed by 40 cycles of 95°C for 15 seconds, 60°C for 1 minute. To SYBR-green amplifications, a dissociation step was added and dissociation curves were analyzed to confirm the identity and fidelity of amplification of SYBR-green products. The following primers were used: all bacteria: forward: 1368-CGGTGAATACGTTCCCGG-1386; reverse: 1491-TACGGCTACCTTGTTACGACTT-1513; probe: 6FAM-CTTGTACACACCGCCCGTC (1388-1407); 18S: forward: 496-ATTGGAGGGCAAGTCTGGTG-516; reverse: 979-CCGATCCCTAGTCGGCATAG-95913 The threshold cycle for each sample was determined for 18S gene and normalized to the CT value of the all bacteria 16S ribosomal RNA gene. Data were calculated using the 2-DDC(T) method.13
16S rRNA gene amplicon sequencing
Bacterial diversity was determined for each sample by targeting part of ribosomal genes. A 16S rRNA gene fragment comprising V3 and V4 hypervariable regions (16S (sense) 342-TACGGRAGGCAGCAG-357 and (antisense) 786-CTACCNGGGTATCTAAT-769)14 was amplified using an optimized and standardized 16S-amplicon-library preparation protocol (Metabiote®, GenoScreen, Lille, France). Briefly, 16S rRNA gene PCR was carried out using 5ng of genomic DNA according to Metabiote® protocol instructions using 192 bar-coded primers (Metabiote® MiSeq Primers, GenoScreen, Lille, France) at final concentrations of 0.2 μM and an annealing temperature of 50°C for 30 cycles. PCR products were cleaned up with Agencourt AMPure XP-PCR Purification system (Beckman Coulter, Brea, CA), quantified according to the manufacture's protocol, and multiplexed at equal concentration. Sequencing was performed using a 300-bp paired-end sequencing protocol on the Illumina MiSeq platform (Illumina, San Diego, CA) at GenoScreen, Lille, France. Raw paired-end reads were subjected to the following process 1) quality filtering with the PRINSEQ-lite PERL script15 by truncation of bases from the 3′end not with quality <30 based on the Phred algorithm, 2) paired-end read assembly using FLASH16 (Fast length adjustment of short reads to improve genome assemblies) with a minimum length overlap of 30 bases and 97% overlap identity and 3) the search and removal of both forward and reverse primer sequences using CutAdapt, with no mismatches allowed in primers sequences. Assembled sequences for which perfect forward and reverse primers are not found were eliminated. The sequences are available in the European Nucleotide Archive database (http://www.ebi.ac.uk) with the following accession number: PRJEB20354.
16S rRNA gene amplicon analysis
Assembled sequences were analyzed using the Quantitative Insights Into Microbial Ecology (QIIME, version 1.8.0) software package.17 Sequences were assigned to Operational Taxonomic Units (OTUs) using the UCLUST algorithm18 with 97% threshold of pairwise identity, and classified taxonomically using Greengenes reference database19 Rarefaction was performed (14,679-82,600 sequences per sample) and used to compare abundances of OTUs across samples. Principal component analyses (PCA) of Bray Curtis dissimilarity with each sample colored by the disease phenotype was built and used to assess the variation between experimental groups. Statistical significance was compared using Permanova statistical test (with 99 permutations). The Chao1 diversity index was calculated using rarefied data (depth = 14,500 sequences/sample) with the use of the MicrobiomAnalyst tools (http://www.microbiomeanalyst.ca), which allowed the characterization of the diversity in the different communities at the species level.
ITS2 sequencing
Fungal diversity was determined for each sample by 454 pyrosequencing of Internal Transcribed Spacer 2 (ITS2). An ITS2 fragment of about 350 bases was amplified using the primers ITS2 (sense) GTGARTCATCGAATCTTT20,21 and (antisense) GATATGCTTAAGTTCAGCGGGT22 and the optimized and standardized ITS2-amplicon-library preparation protocol (Metabiote®, GenoScreen, Lille, France). Briefly, for each sample, 10 µl diluted genomic DNA were used for a 25 µl PCR conducted under the following conditions: 94°C for 2 min, 35 cycles of 15 sec at 94°C, 52°C for 30 sec and 72°C for 45 sec, followed by 7 min at 72°C. The PCR products were purified using Ampure XP Beads (Beckman Coulters, Brea, CA) and quantified using the PicoGreen staining Kit (Molecular Probes, Paris, France). A second PCR of 9 cycles was then conducted under similar PCR conditions with purified PCR products and ten base pair multiplex identifiers (SIM Identifiers) added to the primers at 5′ position to specifically identify each sample and avoid PCR biases. Finally, the PCR products were purified and quantified as previously described. Sequencing was then performed on a Gs-FLX Titanium Sequencing Systems (Roche Life Science, Mannheim, Germany). The sequences are available in the European Nucleotide Archive database (http://www.ebi.ac.uk) with the following accession number: PRJEB20354.
ITS2 sequence analysis
The sequences were demultiplexed, quality filtered using the Quantitative Insights Into Microbial Ecology (QIIME, version 1.8.0) software package.17 Sequences were trimmed for barcodes, PCR primers, and binned for a minimal sequence length of 150pb, a minimal base quality threshold of 25, a maximum homopolymers length of 7. Sequences were then assigned to OTUs using the UCLUST algorithm18 with 97% threshold of pairwise identity, and classified taxonomically using UNITE ITS database (alpha version 12_11).23 Rarefaction was performed (2,013-8,714 sequences per sample) and used to compare abundances of OTUs across samples. PCA of the Bray curtis distance with each sample colored by the disease phenotype was built and used to assess the variation between experimental group. The number of observed OTU, observed species, the Shannon, the Simpson and the Chao1 diversity indexes were calculated using rarefied data (depth = 2,000 sequences/sample) and used to characterize OTU or species diversity in a community.
Statistical analysis
GraphPad Prism version 6.0 (San Diego, CA) was used for all analyses and graph preparation. For all data in graphs, results were expressed as mean ± SEM and statistical analyses were performed using the ANOVA test for unpaired data. Differences with a P value less than 0.05 were considered significant. Differential abundance analysis were performed using Linear Discriminant Analysis Effect Size (LEfSe).24
Declarations
Ethics approval and consent to participate
Our single-center, prospective, observational study was conducted at the S. Orsola-Malpighi's Hospital, Bologna, Italy. 7 patients with CAC, 10 patients with SC and 10 HS were enrolled in the study. The study “9/2013/U/Tess” was approved by the ethical committee of S. Orsola Malpighi Hospital of Bologna.
Availability of data and material
The sequences are available in the European Nucleotide Archive database (http://www.ebi.ac.uk) with the following accession number: PRJEB20354.
Supplementary Material
Abbreviations
- CAC
colitis associated cancer
- CRC
colorectal cancer
- HS
healthy subjects
- IBD
inflammatory bowel diseases
- LEfSe
Linear Discriminant Analysis Effect Size
- qPCR
Real-time quantitative PCR
- SC
sporadic cancer
Disclosure of potential conflicts of interest
The authors have no conflict of interest.
Funding
This work was supported by Xeda International S.A.
Authors' contributions
GL, HS, GB, PL, MC designed the study. GL, HS, BL, GD and TWH performed acquisition of data. HS, MLR and GL performed analysis and interpretation of data. MLR and HS wrote and revised the manuscript for important intellectual content. HS performed the statistical analysis. GL, GP, CC and MPDS gave administrative, technical and material supports. HS, MC and PL supervised the study. The Authors stated that the manuscript, including related data, figures and tables, has not been previously published and that the manuscript is not under consideration elsewhere.
References
- [1].Bonnet M, Buc E, Sauvanet P, Darcha C, Dubois D, Pereira B, Déchelotte P, Bonnet R, Pezet D, Darfeuille-Michaud A. Colonization of the human gut by E. coli and colorectal cancer risk. Clin Cancer Res: An official journal of the American Association for Cancer Research. 2014;20:859-867. doi: 10.1158/1078-0432.CCR-13-1343. PMID:24334760 [DOI] [PubMed] [Google Scholar]
- [2].Brennan CA, Garrett WS. Gut Microbiota, Inflammation, and Colorectal Cancer. Annu Rev Microbiol. 2016;70:395-411. doi: 10.1146/annurev-micro-102215-095513. PMID:27607555 [DOI] [PMC free article] [PubMed] [Google Scholar]
- [3].Burnett-Hartman AN, Newcomb PA, Potter JD. Infectious agents and colorectal cancer: a review of Helicobacter pylori, Streptococcus bovis, JC virus, and human papillomavirus. Cancer epidemiology, biomarkers & prevention: A publication of the American Association for Cancer Research, cosponsored by the American Society of Preventive Oncology. 2008;17:2970-2979. doi: 10.1158/1055-9965.EPI-08-0571. [DOI] [PMC free article] [PubMed] [Google Scholar]
- [4].Gao Z, Guo B, Gao R, Zhu Q, Qin H. Microbiota disbiosis is associated with colorectal cancer. Front Microbiol. 2015;6:20. doi: 10.3389/fmicb.2015.00020. PMID:25699023 [DOI] [PMC free article] [PubMed] [Google Scholar]
- [5].Konstantinov SR, Kuipers EJ, Peppelenbosch MP. Functional genomic analyses of the gut microbiota for CRC screening. Nature Reviews Gastroenterology & Hepatology. 2013;10:741-745. doi: 10.1038/nrgastro.2013.178. [DOI] [PubMed] [Google Scholar]
- [6].Kostic AD, Chun E, Robertson L, Glickman JN, Gallini CA, Michaud M, Clancy TE, Chung DC, Lochhead P, Hold GL, et al.. Fusobacterium nucleatum potentiates intestinal tumorigenesis and modulates the tumor-immune microenvironment. Cell Host Microbe. 2013;14:207-215. doi: 10.1016/j.chom.2013.07.007. PMID:23954159 [DOI] [PMC free article] [PubMed] [Google Scholar]
- [7].Mima K, Cao Y, Chan AT, Qian ZR, Nowak JA, Masugi Y, Shi Y, Song M, da Silva A, Gu M, et al.. Fusobacterium nucleatum in Colorectal Carcinoma Tissue According to Tumor Location. Clin Transl Gastroenterol. 2016;7:e200. doi: 10.1038/ctg.2016.53. PMID:27811909 [DOI] [PMC free article] [PubMed] [Google Scholar]
- [8].Zeller G, Tap J, Voigt AY, Sunagawa S, Kultima JR, Costea PI, Amiot A, Böhm J, Brunetti F, Habermann N, et al.. Potential of fecal microbiota for early-stage detection of colorectal cancer. Mol Syst Biol. 2014;10:766. doi: 10.15252/msb.20145645. PMID:25432777 [DOI] [PMC free article] [PubMed] [Google Scholar]
- [9].Manichanh C, Borruel N, Casellas F, Guarner F. The gut microbiota in IBD. Nature reviews Gastroenterology & hepatology. 2012;9:599-608. doi: 10.1038/nrgastro.2012.152. [DOI] [PubMed] [Google Scholar]
- [10].Miquel S, Martín R, Rossi O, Bermúdez-Humarán LG, Chatel JM, Sokol H, Thomas M, Wells JM, Langella P. Faecalibacterium prausnitzii and human intestinal health. Curr Opin Microbiol. 2013;16:255-261. doi: 10.1016/j.mib.2013.06.003. PMID:23831042 [DOI] [PubMed] [Google Scholar]
- [11].Liguori G, Lamas B, Richard ML, Brandi G, da Costa G, Hoffmann TW, Di Simone MP, Calabrese C, Poggioli G, Langella P, et al.. Fungal Dysbiosis in Mucosa-associated Microbiota of Crohn's Disease Patients. J Crohns Colitis. 2016;10:296-305. doi: 10.1093/ecco-jcc/jjv209. PMID:26574491 [DOI] [PMC free article] [PubMed] [Google Scholar]
- [12].Lepage P, Seksik P, Sutren M, de la Cochetière MF, Jian R, Marteau P, Doré J. Biodiversity of the mucosa-associated microbiota is stable along the distal digestive tract in healthy individuals and patients with IBD. Inflamm Bowel Dis. 2005;11:473-480. doi: 10.1097/01.MIB.0000159662.62651.06. PMID:15867587 [DOI] [PubMed] [Google Scholar]
- [13].McGovern DP, Gardet A, Törkvist L, Goyette P, Essers J, Taylor KD, Neale BM, Ong RT, Lagacé C, Li C, et al.. Genome-wide association identifies multiple ulcerative colitis susceptibility loci. Nat Genet. 2010;42:332-337. doi: 10.1038/ng.549. PMID:20228799 [DOI] [PMC free article] [PubMed] [Google Scholar]
- [14].Caporaso JG, Kuczynski J, Stombaugh J, Bittinger K, Bushman FD, Costello EK, Fierer N, Peña AG, Goodrich JK, Gordon JI, et al.. QIIME allows analysis of high-throughput community sequencing data. Nat. Met. 2010;7:335-336. doi: 10.1038/nmeth.f.303. [DOI] [PMC free article] [PubMed] [Google Scholar]
- [15].Edgar RC. Search and clustering orders of magnitude faster than BLAST. Bioinformatics. 2010;26:2460-2461. doi: 10.1093/bioinformatics/btq461. PMID:20709691 [DOI] [PubMed] [Google Scholar]
- [16].McDonald D, Price MN, Goodrich J, Nawrocki EP, DeSantis TZ, Probst A, Andersen GL, Knight R, Hugenholtz P. An improved Greengenes taxonomy with explicit ranks for ecological and evolutionary analyses of bacteria and archaea. ISME J. 2012;6:610-618. doi: 10.1038/ismej.2011.139. PMID:22134646 [DOI] [PMC free article] [PubMed] [Google Scholar]
- [17].Kõljalg U, Nilsson RH, Abarenkov K, Tedersoo L, Taylor AF, Bahram M, Bates ST, Bruns TD, Bengtsson-Palme J, Callaghan TM, et al.. Towards a unified paradigm for sequence-based identification of fungi. Mol Ecol. 2013;22:5271-5277. doi: 10.1111/mec.12481. PMID:24112409 [DOI] [PubMed] [Google Scholar]
- [18].Segata N, Izard J, Waldron L, Gevers D, Miropolsky L, Garrett WS, Huttenhower C. Metagenomic biomarker discovery and explanation. Genome Biol. 2011;12:R60. doi: 10.1186/gb-2011-12-6-r60. PMID:21702898 [DOI] [PMC free article] [PubMed] [Google Scholar]
- [19].Morgan XC, Huttenhower C. Meta'omic analytic techniques for studying the intestinal microbiome. Gastroenterology. 2014;146:1437-1448 e1431. doi: 10.1053/j.gastro.2014.01.049. PMID:24486053 [DOI] [PubMed] [Google Scholar]
- [20].Liu Y, van Kruiningen HJ, West AB, Cartun RW, Cortot A, Colombel JF. Immunocytochemical evidence of Listeria, Escherichia coli, and Streptococcus antigens in Crohn's disease. Gastroenterology. 1995;108:1396-1404. doi: 10.1016/0016-5085(95)90687-8. PMID:7729631 [DOI] [PMC free article] [PubMed] [Google Scholar]
- [21].Munro J, Mayberry JF, Matthews N, Rhodes J. Chlamydia and Crohn's disease. Lancet. 1979;2:45-46. doi: 10.1016/S0140-6736(79)90213-7. PMID:87925 [DOI] [PubMed] [Google Scholar]
- [22].Martin HM, Campbell BJ, Hart CA, Mpofu C, Nayar M, Singh R, Englyst H, Williams HF, Rhodes JM. Enhanced Escherichia coli adherence and invasion in Crohn's disease and colon cancer. Gastroenterology. 2004;127:80-93. doi: 10.1053/j.gastro.2004.03.054. PMID:15236175 [DOI] [PubMed] [Google Scholar]
- [23].Subramanian S, Rhodes JM, Hart CA, Tam B, Roberts CL, Smith SL, Corkill JE, Winstanley C, Virji M, Campbell BJ. Characterization of epithelial IL-8 response to inflammatory bowel disease mucosal E. coli and its inhibition by mesalamine. Inflamm Bowel Dis. 2008;14:162-175. doi: 10.1002/ibd.20296. PMID:17941093 [DOI] [PMC free article] [PubMed] [Google Scholar]
- [24].Maynard CL, Elson CO, Hatton RD, Weaver CT. Reciprocal interactions of the intestinal microbiota and immune system. Nature. 2012;489:231-241. doi: 10.1038/nature11551. PMID:22972296 [DOI] [PMC free article] [PubMed] [Google Scholar]
- [25].Sokol H et al.. Fungal microbiota dysbiosis in IBD. Gut. 2016. doi: 10.1136/gutjnl-2015-310746. [DOI] [PMC free article] [PubMed] [Google Scholar]
- [26].Baxter NT, Ruffin MTT, Rogers MA, Schloss PD. Microbiota-based model improves the sensitivity of fecal immunochemical test for detecting colonic lesions. Genome Med. 2016;8:37. doi: 10.1186/s13073-016-0290-3. PMID:27056827 [DOI] [PMC free article] [PubMed] [Google Scholar]
- [27].Thomas AM, Jesus EC, Lopes A, Jr Aguiar S, Begnami MD, Rocha RM, Carpinetti PA, Camargo AA, Hoffmann C, Freitas HC, et al.. Tissue-Associated Bacterial Alterations in Rectal Carcinoma Patients Revealed by 16S rRNA Community Profiling. Front Cell Infect Microbiol. 2016;6:1-13. doi: 10.3389/fcimb.2016.00179. PMID:26870699 [DOI] [PMC free article] [PubMed] [Google Scholar]
- [28].Abdulamir AS, Hafidh RR, Abu Bakar F. The association of Streptococcus bovis/gallolyticus with colorectal tumors: the nature and the underlying mechanisms of its etiological role. J Exp Clin Cancer Res: CR 2011;30:11. doi: 10.1186/1756-9966-30-11. [DOI] [PMC free article] [PubMed] [Google Scholar]
- [29].Sun J, Kato I. Gut microbiota, inflammation and colorectal cancer. Genes & Diseases 2016;3:130-143. doi: 10.1016/j.gendis.2016.03.004. [DOI] [PMC free article] [PubMed] [Google Scholar]
- [30].Sokol H, Seksik P, Furet JP, Firmesse O, Nion-Larmurier I, Beaugerie L, Cosnes J, Corthier G, Marteau P, Doré J. Low counts of Faecalibacterium prausnitzii in colitis microbiota. Inflamm Bowel Dis. 2009;15:1183-1189. doi: 10.1002/ibd.20903. PMID:19235886 [DOI] [PubMed] [Google Scholar]
- [31].Chen W, Liu F, Ling Z, Tong X, Xiang C. Human intestinal lumen and mucosa-associated microbiota in patients with colorectal cancer. PloS one 2012;7:e39743. doi: 10.1371/journal.pone.0039743. PMID:22761885 [DOI] [PMC free article] [PubMed] [Google Scholar]
- [32].Feng Q, Liang S, Jia H, Stadlmayr A, Tang L, Lan Z, Zhang D, Xia H, Xu X, Jie Z, et al.. Gut microbiome development along the colorectal adenoma-carcinoma sequence. Nat Commun. 2015;6:6528. doi: 10.1038/ncomms7528. PMID:25758642 [DOI] [PubMed] [Google Scholar]
- [33].Tjalsma H, Boleij A, Marchesi JR, Dutilh BE. A bacterial driver-passenger model for colorectal cancer: beyond the usual suspects. Nat Rev Microbiol. 2012;10:575-582. doi: 10.1038/nrmicro2819. PMID:22728587 [DOI] [PubMed] [Google Scholar]
Associated Data
This section collects any data citations, data availability statements, or supplementary materials included in this article.