

Abstract
Nitroreductases (NTRs) are known to be able to metabolize nitro-substituted compounds in the presence of reduced nicotinamide adenine dinucleotide (NADH) as an electron donor. NTRs are present in a wide range of bacterial genera and, to a lesser extent, in eukaryotes hypoxic tumour cells and tumorous tissues, which makes it an appropriate biomarker for an imaging target to detect the hypoxic status of cancer cells and potential bacterial infections. To evaluate the specific activation level of NTR, great efforts have been devoted to the development of fluorescent probes to detect NTR activities using fluorogenic methods to probe its behaviour in a cellular context; however, NTR-responsive MRI contrast agents are still by far underexplored. In this study, para-nitrobenzyl substituted T1-weighted magnetic resonance imaging (MRI) contrast agent Gd-DOTA-PNB (probe 1) has been designed and explored for the possible detection of NTR. Our experimental results show that probe 1 could serve as an MRI-enhanced contrast agent for monitoring NTR activity. The in vitro response and mechanism of the NTR catalysed reduction of probe 1 have been investigated through LC–MS and MRI. Para-nitrobenzyl substituted probe 1 was catalytically reduced by NTR to the intermediate para-aminobenzyl substituted probe which then underwent a rearrangement elimination reaction to Gd-DOTA, generating the enhanced T1-weighted MR imaging. Further, LC–MS and MRI studies of living Escherichia coli have confirmed the NTR activity detection ability of probe 1 at a cellular level. This method may potentially be used for the diagnosis of bacterial infections.
KEY WORDS: Nitroreductase, MRI contrast agent, Smart imaging probes, Bacterial imaging, Bacterial infection
Graphical abstract
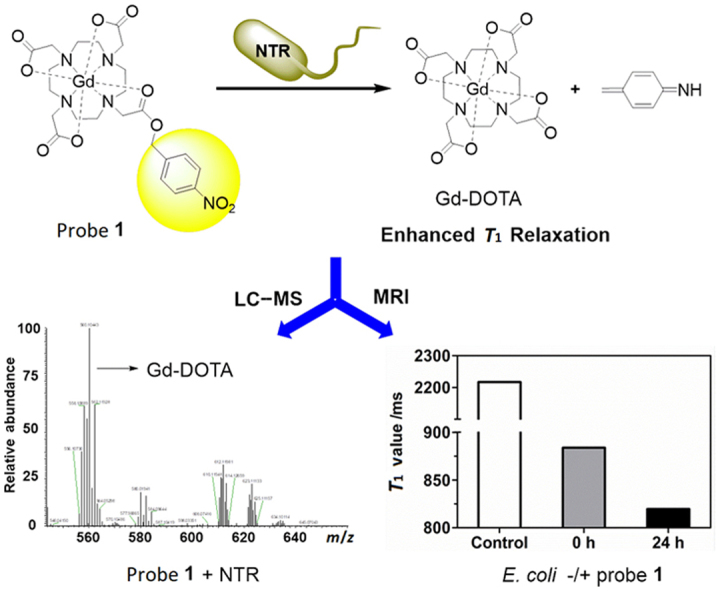
A novel smart magnetic resonance imaging (MRI) contrast agent for selective sensing nitroreductase (NTR) activity and its initial applications in real time NTR activity detection in living Escherichia coli have been reported.
1. Introduction
Molecular imaging provides a sensitive and specific method for non-invasive, real-time monitoring and visualization of biological processes in vivo1, 2, 3, 4. Magnetic resonance imaging (MRI) has several advantages over other clinical diagnostic techniques for molecular imaging, in virtue of its high spatial resolution, unlimited penetration depth, and lack of harmful radiation5, 6, 7. Over the past three decades, paramagnetic Gd(III) complexes have been widely developed as contrast agents to dramatically improve detection sensitivity and specificity of MRI by shortening the relaxation times of the surrounding water proton resulting in an enhanced imaging contrast8, 9, 10, 11. At present, the contrast agents most commonly used in clinical MRI are mainly small molecule gadolinium chelates, such as Magnevist (Gd-DTPA), Dotarem (Gd-DOTA), ProHance (Gd-HP-DO3A), etc. To further improve the enhancing effects and detect physiological changes at the molecular level, the smart MRI contrast agents have been developed and used12, 13, 14, 15. These probes are capable of monitoring physiological processes by changing signal properties with changes in the physiological environment, such as enzyme16, 17, 18, 19, 20, metal ion concentration20, 21, 22, 23, pH value24, 25, temperature26, etc. Recently, applications of enzyme-activatable MRI contrast agents have been reported.
Nitroreductases (NTRs), are a family of flavin-containing enzymes widely exists in bacteria, which can effectively catalyze the reduction of nitroaromatic compounds into hydroxylamines or amines in the presence of reduced nicotinamide adenine dinucleotide (NADH) or nicotinamide adenine dinucleotide phosphate (NADPH) as a cofactor via an one-electron reduction pathway27, 28, 29, 30, 31. An increasing number of nitroaromatic compounds have proved to be superior substrates for NTRs opening up the opportunity to develop enzyme-activatable probes, which is, given the role of the NTRs of great significance for environmental and human health32, 33, 34. Great effort has been devoted to the design of activatable optical probes for sensing NTR activities within hypoxic tumor cells; lately, optical probes for detecting NTR activities in bacterial lysates have been developed as well33, 34, 35, 36, 37, 38. In comparison, a few NTR-activatable MRI contrast agents have been developed39, 40, and there appears to have been no real time NTR enzymatic activity detection in bacteria using an MRI method.
In this study, we designed and synthesized a novel NTR-enhanced MRI contrast agent: Gd-DOTA-PNB (probe 1) by conjugating Gd-DOTA with an NTR-sensing moiety, a p-nitrobenzyl group. Probe 1 has been characterized by 1H NMR, 13C NMR, MS and evaluated as a new NTR-enhanced MRI contrast agent, which may potentially be used for the diagnosis of bacterial infections. Conceptually, we hypothesized that the p-nitrobenzyl moiety (PNB) of probe 1 would be reduced to a primary aromatic amino group by NTR in the presence of NADH, which would then trigger a self-immolative fragmentation through a rearrangement elimination reaction and formation of Gd-DOTA (Scheme 1) resulting a relaxivity enhancement, which could be used for NTR activities detection. The in vitro response and mechanism of the NTR catalysed reduction of probe 1 have been investigated through LC–MS and MRI. Further, LC–MS and MRI studies of living Escherichia coli (E. coli) have confirmed the NTR activity detection ability of probe 1 at a cellular level, which hint to the potential application of probe 1 for the diagnosis of bacterial infections.
Scheme 1.

Structure and reaction response mechanism of probe 1 to NTR.
2. Materials and methods
2.1. General methods
All chemicals were purchased from J&K (Beijing, China). Commercially available reagents were used without further purification. Unless otherwise noted, all reactions were performed under a nitrogen or argon atmosphere. NTR (≥ 100 units/mg) from E. coli, and NADH were purchased from Sigma–Aldrich (Shanghai, China). The lyophilized powder of NTR was dissolved in pure water, and the solution was divided into aliquots suitable for daily experiments. All these enzyme solutions were stored at −20 °C and allowed to thaw before use according to the reported procedure, under the premise of no change of the enzyme activity33, 34. A stock solution (10 mmol/L) for compounds 1 and 2 were prepared by dissolving an appropriate amount of them in H2O. The E. coli (ATCC 25922) was purchased from American Type Culture Collection (ATCC), USA. MTS (3-(4,5-di-methylthiazol-2-yl)-5(3-carbo-xymethoxyphenyl)-2-(4-sulfopheny)-2H-tetrazolium, inner salt) was obtained from Promega (Beijing, China). OD values and MTS assays were also measured by TECAN Spark 10 M microplate reader (Männedorf, Switzerland). Thin layer chromatography (TLC) was carried out with Silica Gel 60 F254, and column chromatography with silica gel (200–300 mesh). All 1H NMR spectra were recorded at 600 MHz and 13C NMR spectra were recorded at 150 MHz respectively (Varian VNS, 600 MHz, USA). Mass spectra (MS) were measured with an Exactive Plus Orbitrap mass spectrometer via an ESI interface (ThermoFisher Scientific, Bremen, Germany). Characterization of MR properties were measured at a Pharmscan 70/16 USmagnetic resonance imaging scanner (Bruker, Switzerland) fitted with RF RES 300 1H 089/072 QSN TR AD volume coil.
2.2. Analysis and determination of the conversion kinetics by LC–MS
To investigate the kinetics of the NTR-catalyzed reaction of probe 1, the conversion reaction mixture containing probe 1 (200 μmol/L), NTR (30 μg/mL) and NADH (500 μmol/L) at 37 °C in 0.9% aqueous NaCl solution was analyzed. The reaction was performed in a 0.5 mL eppendorf tube with a reaction volume of 50 μL at different time points (0, 3, 6, 12 and 24 h) and quenched by addition of acetonitrile (60 μL). After centrifugation at 6500 rpm for 3 min (HC-2062 High speed centrifuge, Anhui USTC Zonkia Scientific Instruments Co., Ltd., Hefei, China), the supernatants were analyzed by LC–MS. The conversion rate of 1 to Gd-DOTA (2) following the enzymatic reaction was calculated according to the percentage of peak area of 1. Pseudo-first-order rate constants for enzymatic hydrolysis were determined based on the equation y=A0×e—x/t (where A0=1 and t−1=kobs), using GraphPad Prism 5 (GraphPad Software Inc., USA).
2.3. Determination of the enzymatic reaction in vitro by an HPLC assay
The specific enzymatic reaction of probe 1 to NTR was conducted in 0.9% aqueous NaCl solution. Four aqueous solutions were prepared: (A) 200 μmol/L probe 1 and 500 μmol/L NADH in 0.9% aqueous NaCl solution; (B) 200 μmol/L probe 1, 500 μmol/L NADH, and 30 μg/mL NTR in 0.9% aqueous NaCl solution; (C) 200 μmol/L probe 1, 500 μmol/L NADH, 30 μg/mL NTR and 0.25 mmol/L dicoumarin in 0.9% aqueous NaCl solution; (D) 200 μmol/L probe 1, 500 μmol/L NADH, 30 μg/mL NTR and 0.5 mmol/L dicoumarin in 0.9% aqueous NaCl solution. Reactions were performed for 6 h at 37 °C, and quenched by adding CH3CN (250 μL). Then, after centrifugation the supernatants (6500 rpm, 3 min) were measured by high performance liquid chromatography (HPLC) equipped with an evaporative light scattering detector (ELSD). The HPLC method was as follows: mobile phase A was acetonitrile with 0.1% trifluoroacetic acid, and mobile phase B consisted of water with 0.1% trifluoroacetic acid; a linear gradient was set from 1% to 5% B in 10 min, followed by a gradient to 90% B in 10 min, then at 90% B for 2 min; the flow rate was 1.0 mL/min, and 50 μL of sample was injected. The conversion rate of 1 to Gd-DOTA following the enzymatic reaction was calculated according to the percentage of peak area of 1 before incubation.
2.4. Bacteria and cell culture
E. coli (ATCC 25922) was used in this study. The Luria-Bertani (LB) culture medium was prepared by dissolving 10 g bacto-tryptone, 5 g bactoyeast extract and 5 g NaCl in 1 L water. The culture medium was autoclaved prior to use. For determining the NTR activity generated by E. coli, single colony from the stock agar plate was added to 20 mL of LB culture media, which then was grown at 37 °C on a shaker incubator (180 rpm, THZ-C-1, Suzhou, China) overnight followed by a subculture until an OD600 of approximately 5–7 was reached. The Raw 264.7 cells, 293 A cells, rat fibroblast L6 cells and HepG2 cells were cultured in Dulbecco's modified Eagle's medium (DMEM) with 10% fetal bovine serum (FBS) under humidified atmosphere of 5% CO2 at 37 °C.
2.5. In vitro LC–MS/ELSD measurement of the conversion and selectivity of probe 1 incubated with bacteria
E. coli cells were cultured for 12 h in LB culture media at 37 °C. Bacterial strains cultured overnight was harvested and washed three times with 0.9% aqueous NaCl solution. The washed cells were resuspended in 0.9% aqueous NaCl solution with an OD600 of 5–7 and were divided into 500 μL aliquots. The following samples were set up: (A) probe 1 (200 μmol/L) only, (B) cells treated with probe 1 (200 μmol/L), (C) cells treated with probe 1 (200 μmol/L) and dicoumarin (0.5 mmol/L). After incubation at 37 °C for 24 h, 500 μL CH3OH were added and the samples subjected to subsequent ultrasonication using an ultrasonic cell disintegrator (SONIC-VCX-130, USA). Then after centrifugation (6500 rpm, 3 min) the supernatants were measured by HPLC–ESI-MS and HPLC–ELSD analyses.
2.6. Longitudinal relaxation time (T1) measurement
The longitudinal relaxation time (T1) of the Gd(III) complexes in different solutions was measured using the standard inversion recovery spin-echo sequence on 7 T scanner operating at 300 MHz and room temperature (Pharmscan 70/16 US, Bruker, Switzerland). For acquisition of T1 relaxation time, a T1 map rapid-acquisition refocused echo (T1 map RARE) pulse sequence was used. The following parameter values were utilized: static echo time=8 ms, variable repetition time=200, 400, 800, 1500, 3000, and 5500 ms, field of view=50×50 mm2, matrix size=256×192, number of axial slices=1, slice thickness=1.0 mm, and averages=1. Paravision 6.0 software (Bruker) was used for T1 analysis, by mono-exponential curve-fitting of image intensities of selected regions of interest (ROIs) from the axial slice.
2.7. Characterization of the MR properties in vitro
To determine relaxivity (r1) of probe 1 and Gd-DOTA in different solutions, a 10 mmol/L stock solution of either probe 1 or Gd-DOTA in the appropriate buffer was diluted to give 500 μL of each of seven concentrations for each run: 0, 0.1, 0.2, 0.4, 0.6, 0.8, and 1.0 mmol/L. The values of r1 (mM-1 s-1) were determined from the slope of the linear fit of the relaxation rate (1/T1, s−1) plotted against the compound concentration (mmol/L). All lines were fitting with R2>0.997.
To study the effect of the NTR reduction on the T1 value of probe 1, NTR was dissolved in water to form an aqueous solution. For the T1 measurements of probe 1 in the presence or absence of NTR and NADH, the follow reactions were set up: (a) 200 μmol/L probe 1 in 0.9% aqueous NaCl solution; (b) 200 μmol/L probe 1 and 500 μmol/L NADH in 0.9% aqueous NaCl solution; (c) 200 μmol/L probe 1, 500 μmol/L NADH, and 30 μg/mL NTR in 0.9% aqueous NaCl solution. The T1 of these solutions were measured after incubation for 12 h at 37 °C.
2.8. In vitro MR imaging of E. coli treated with probe 1
E. coli cells were cultured for 12 h in LB culture media at 37 °C. Bacterial strains cultured overnight were harvested and washed three times with 0.9% aqueous NaCl solution. The washed cells were resuspended in 0.9% aqueous NaCl solution until an OD600 of 6 was reached. Then 500 μL aliquots (5.1×10⁹ CFU/mL) were (A) untreated, (B) treated with 200 μmol/L of probe 1 for 0 h and (C) treated with 200 μmol/L of probe 1 for 24 h. After incubation at 37 °C for 24 h, the samples were imaged using a RF RES 300 1 H 089/072 QSN TR AD volume coil (Pharmscan 70/16 US, Bruker, Switzerland). For acquisition of T1 relaxation times, a T1 map rapid acquisition with refocused echoes (T1 map RARE) pulse sequence was used. For T1-weighting, the following parameters were used: TR=400 ms, TE=8 ms, flip angle=90°, NEX=1, FOV=55×55 mm2, slice thickness=1 mm, and matrix size=256×192.
2.9. Cytotoxicity assays
The cytotoxicity of probe 1 was evaluated following the approach reported previously.3 The Raw 264.7 cells, 293 A cells, rat fibroblast L6 cells and HepG2 cells were seeded on a 96-wells containing 7500 cells per well in 100 μL DMEM media and incubated for overnight before adding probe 1. Upon incubation with different concentration of probe 1 at 37 °C for 48 h, then incubated with cell culture medium containing 20% MTS per well. After 3 h of incubation at 37 °C, the absorbance was measured at 490 nm using a TECAN Spark 10 M microplate reader. Cell viabilities at various concentrations are given as a percentage of control sample without probe. Each experiment was repeated three times. The cell survival rate from the control group was considered to be 100%.
3. Results and discussion
3.1. Synthesis of the Gd(III) complexes
The Gd(III) complexes of probe 1 and Gd-DOTA (2) were synthesized as shown in Scheme 2. 2-(4-Nitrobenzyl)-bromo-acetate (3) was synthesized via alkylation-coupling reactions between 4-Nitrobenzyl alcohol and bromoacetyl bromide in the presence of DMAP and toluene in 92% yield without further purification. The bromoacetyl group was used as a linker to connect the DO3A-tris-tert-butyl ester (4) and 4-nitrobenzyl alcohol. Subsequently, the tert-butyl groups in DOTA were removed with TFA/trimethylsilane/H2O (98:1:1) to obtain DOTA-PNB (6). The ligand, DOTA-PNB (6), was characterized by ESI-MS and NMR, and its purity was determined by HPLC to be greater than 98% (Supplementary information Fig. S1). Finally, the ligands DOTA-PNB and DOTA were reacted with GdCl3·6H2O in water at pH 6.5—7.0 to give Gd-DOTA-PNB (probe 1) and Gd-DOTA, respectively. Probe 1 was obtained in 61% yield, while Gd-DOTA was obtained in 13% yield due to the lack of a chromophore on Gd-DOTA for spectrometric detection which was hampering the experimental isolation procedure.
Scheme 2.

Synthesis of probe 1. (a) bromoacetyl bromide, DMAP, toluene, 92%. (b) t-Butyl bromoacetate, sodium acetate, DMA, 62%. (c) Compound 3, K2CO3, MeCN, 89%. (d) TFA/ triethylsilane/H2O, 0 °C, 63%. (e) GdCl3·6H2O, NaOH, pH 6.5–7.0, 61%.
3.2. Activation mechanism and enzyme kinetics
LC–MS is a convenient and practical method to detect and identify the products of enzyme-catalyzed reaction41, 42. To monitor the ability of the NTR to activate the probe 1, the reaction mixture was analyzed by LC–MS after incubating probe 1 (200 μmol/L) with NTR (30 μg/mL) and NADH (500 μmol/L) at 37 °C in 0.9% aqueous NaCl solution (Supplementary Information Fig. S2). Probe 1 and its product Gd-DOTA are readily discriminated by their appropriate positive mode ESI-MS, and through spiking with authentic compound. The ESI-MS spectrum of the reaction solution definitely displays the presence of Gd-DOTA as a major product at 3.77 min (m/z=559.10, [M+H]+). Unreacted probe 1 decreased markedly at 19.76 min (m/z=695.14, [M+H]+) after 3 h, which was disappeared after 24 h (Supplementary information Figs. S23). Moreover, the kinetics of NTR reaction were investigated by following the decrease of probe 1 post-incubation with NTR at 37 °C in 0.9% aqueous NaCl solution (Fig. 1a). After 20 h, 99.5% of 1 was hydrolyzed resulting in a rate constant of 7.52 × 10⁻⁵ s−1 (kobs, 37 °C) by assuming a pseudo first-order kinetics. This rate constant corresponds to a half-life of t1/2=2.56 h. Therefore, all these data indicate that the reaction most likely undergoes the proposed reduction-elimination mechanism as shown in Scheme 1. Considering the complexity of the intracellular environment, the interferences of various biothiols (GSH, DTT, cysteine and homocysteine) were studied. As shown in Fig. 1b, the probe shows high selectivity for NTR over the other species tested, even including reductive biothiols at a high concentration, which may be ascribed to the specific reduction of the substrate (p-nitrobenzyl) by the enzyme.
Figure 1.

(a) Plot of reduction of probe 1 with (red) or without (blue) NTR at 37 °C (in 0.9% aqueous NaCl solution) monitored by LC–MS. Individual data points represent the integration of the peak area of probe 1 post-incubation with or without NTR divided by the peak area of probe 1 before incubation (multiplied by 100 to give percent complex hydrolysis). The red line corresponds to a pseudo first-order kinetic fit of the data with a half-life of t1/2=2.56 h for 1. Data are mean±SD (n=2). (b) Conversion of 1 (200 μmol/L) to various species: control (probe 1), NTR (30 μg/mL), GSH (1 mmol/L), DTT (1 mmol/L), Cys (1 mmol/L), Hcy (1 mmol/L).
3.3. In vitro HPLC assay of enzymatic reaction
Having established the activation mechanism of probe 1, we then evaluated whether probe 1 is specific for NTR. To study the selectivity of probe 1 for NTR, the effect of the known competitive inhibitor dicoumarin33, 36 of NTR on the activity of the enzyme was examined using high performance liquid chromatography (HPLC) equipped with an evaporative light scattering detector (ELSD) (Fig. 2 and Supplementary information Fig. S4). As shown in Fig. 2a, HPLC chromatograms of probe 1 (200 μmol/L) incubated with NADH (500 μmol/L), NTR (30 μg/mL), and the NTR inhibitor dicoumarin (0.25/0.5 mmol/L) for 6 h at 37 °C in 0.9% aqueous NaCl solution were monitored. On incubation with NTR in reaction system, probe 1 (tR=16.8 min) was efficiently converted into Gd-DOTA (the same tR as NADH) and nearly completely reduced after 6 h. In contrast, residual content probe 1 in the presence of 0.25 mmol/L dicoumarin (curve/bar graph C) indicated by the peak area is much larger than the content of 1 (curve/bar graph B) in the absence of the inhibitor after 6 h. Higher concentration of dicoumarin (0.5 mmol/L) resulted increased remaining probe 1 content after 6 h (curve/ bar graph D) roughly equally to the control reaction without NTR (incubation of probe 1 with only NADH, curve/ bar graph A, Fig. 2b). We conclude that the NTR activity can be effectively inhibited by dicoumarin, and thus the reduction of probe 1 to NTR is indeed attributed to the enzyme catalyzed cleavage reaction, confirming the good selectivity of probe 1 for NTR detection.
Figure 2.

(a) HPLC traces of different reaction systems. (A): 200 μmol/L probe 1 and 500 μmol/L NADH in 0.9% aqueous NaCl solution (control); (B): system (A) + 30 μg/mL NTR; (C): system (B) + 0.25 mmol/L dicoumarin; (D): system (B) + 0.5 mmol/L dicoumarin. All the reactions were performed at 37 °C for 6 h. (b) The percentage of probe 1 in different reaction systems A, B, C, D. The control (A) was considered to be 100%. Data are mean±SD (n=3).
3.4. In vitro LC–MS/ELSD assay of probe 1 incubated with bacteria
It is known that E. coli can generate NTR, and this bacterial enzyme has been considered to be useful for the removal of nitroaromatic pollutants27, 28, 30, 43. To study whether the probe 1 could detect microbial NTR activity at a cellular level, we measured the time dependent conversion of probe 1 (200 μmol/L) in E. coli for 24 h by HPLC chromatograms and ESI-MS spectra (Fig. 3 and Supplementary Information Fig. S5). Fig. 3a shows HPLC chromatograms of probe 1 at 16.7 min, which indicates that the peak area of probe 1 after incubating with E. coli (curve/bar graph B) is less than that (curve/bar graph A) in the absence of the bacteria, while addition of dicoumarin (0.5 mmol/L) to the bacterial culture before treatment with the probe 1 (curve/bar graph C) significantly decrease the reduction rate of probe. By calculating percentage of probe 1, we discover that probe 1 is reduced about 80% after incubating with E. coli, and decreasing to about 50% by the addition of the NTR inhibitor dicoumarin (Fig. 3b). Moreover, the ESI-MS spectrum of probe 1 under the above conditions is shown in Supplementary Information Fig. S5. Here, the peak area change of probe 1 in the MS spectrum is consistent with the peak area change of Fig. 3. This result shows that probe 1 can be reduced by NTR of E. coli and the reduction can be inhibited by the NTR inhibitor dicoumarin, demonstrating the activation specificity of the probe 1 towards NTR. Taken together, this suggest that probe 1 may be used as a microbial growth indicator.
Figure 3.

(a) HPLC traces of different reaction systems. (A): probe 1 (200 μmol/L) in 0.9% aqueous NaCl solution (control); (B): system (A) + E. coli (OD600=6.2); (C): system (B) + dicoumarin (0.5 mmol/L). All the reactions were performed at 37 °C for 24 h. (b) The percentage of probe 1 in different reaction systems A, B, C. The control (A) was considered to be 100%. Data are means ±SD(n=3).
3.5. Relaxometric studies of the Gd(III) complexes in vitro
The efficiency of MR contrast agent is defined according to the parameter relaxivity (r1), which is a weigh of the extent to which the paramagnetic compound (per concentration unit), shortens the longitudinal relaxation time (T1) of water protons.5 To study relaxometric properties of the probe, the longitudinal relaxivity (r1) values of probe 1 and the predicted reduction product, Gd-DOTA (2), are determined at 7 T, 300 MHz and room temperature (Fig. 4 and Supplementary information Fig. S6). As shown in Fig. 4, the r1 value of Gd-DOTA in PBS buffer (pH = 5.35) is 4.02 mM-1 s-1, which is 15% higher than that of 1 (3.51 mM-1 s-1). Owing to enzyme reaction in 0.9% aqueous NaCl solution, the relaxivities of probe 1 and Gd-DOTA were also determined under these conditions. Here, the relaxivities of probe 1 and Gd-DOTA were 3.16 mM-1 s-1 and 3.61 mM-1 s-1 respectively, which are lower than observed in PBS buffer but show the same trend with a 14% rise in relaxivity from probe 1 to Gd-DOTA. In this case, the phosphate could coordinate to DO3A analogues in a monodentate fashion17, 44, 45 and compete with intramolecular coordination, then increase the number of water molecules coordinated to the metal center. Therefore, the relaxivities in PBS buffer are expected to be higher than that in 0.9% aqueous NaCl solution. In addition, the difference in r1 relaxivity between probe 1 and Gd-DOTA can provide the evidence for study of MRI contrast agent probe 1 reduced by NTR.
Figure 4.

T1 relaxivity of probe 1 (1) and Gd-DOTA (2) at 300 MHz, r.t., a10 mmol/L PBS, pH=5.35; b0.9% aqueous NaCl solution.
To evaluate probe 1 as a potential NTR-responsive MRI contrast agent, probe 1 (200 μmol/L) was incubated with NADH (500 μmol/L) and NTR (30 μg/mL) at 37 °C for 12 h in 0.9% aqueous NaCl solution and the change in the longitudinal relaxation time (T1) was evaluated. We observed that the T1 value of probe 1 is 897±5 ms, while the T1 is 843±9 ms decreased by 6% in the presence of NTR, which is consistent with the relaxometric study (Fig. 5). The changes in T1 values can be explained the significant increase of product 2 (Gd-DOTA) upon enzymatic cleavage of probe 1 over time after NTR treatment, resulting in a decrease in the longitudinal relaxation time (T1). We conclude that probe 1 can therefore selectively respond to NTR and detect its activity in an MRI setting. Moreover, under optimized conditions (reaction at 37 °C for 6 h in 0.9% aqueous NaCl solution in the presence of 500 μmol/L NADH), the T1 values of probe 1 (200 μmol/L) to NTR at different concentrations is shown in Supplementary Information Fig. S7a. As can be seen, a gradual decrease in T1 value is observed with increase in the NTR concentrations, and a good linearity is obtained in the range of 5 to 40 μg/mL (Supplementary Information Fig. S7b), with the regression equation T1 =−1.0474×[c]μg/mL+894.82 (R2=0.9926). The detection limit is determined to be 24 ng/mL NTR.
Figure 5.

MR studies with probe 1 upon activation with NTR in vitro. (a) T1 value reduction of probe 1 (200 μmol/L) in the presence of NADH (500 μmol/L) and NTR (30 μg/mL) in 0.9% aqueous NaCl solution at 37 °C. (b) Change percentage in R1 (1/T1) of NTR-catalyzed hydrolysis of probe 1. T1 value was measured with a Pharmscan 70/16 US (Bruker, Switzerland) imaging scanner at r.t., using the standard inversion recovery program. Data represent mean value±SD, n=2.
3.6. In vitro MR imaging of E. coli treated with probe 1
In addition, MR imaging was performed to evaluate the efficiency of probe 1 for detecting endogenous NTR activity in E. coli. The experiments were carried out at 7 T using three incubations: (A) bacteria alone, (B) bacteria+probe 1, incubated for 0 h, (C) bacteria+probe 1, incubated for 24 h. As shown in Fig. 6a, the T1 value of E. coli after incubation with 1 (200 μmol/L) for 24 h is 819±5 ms reduced by 8% as compared to 0 h (885±2 ms). The shorter T1 value was again consistent with the results of the T1-weighted images of bacteria shown in Fig. 6b, where E. coli after incubation with 1 for 24 h manifested higher MR signal intensity than at 0 h. The results of in vitro MR imaging studies of E. coli treated with probe 1 indicated that probe 1 could permeate E. coli cell membrane and be subsequently activated by the NTR, leading to an enhanced MRI contrast. Our experimental results show that probe 1 could serve as an MRI-enhanced contrast agent for monitoring NTR activity in living bacteria. Considering NTRs are also present in eukaryotes hypoxic tumour cells, MR imaging hypoxia was performed in Hela cells by probe 1. In this experiment, Hela cells (1 × 10⁶) were incubated with 200 μmol/L probe 1 under hypoxic conditions (1% pO2) at 37 °C for 0 h or 24 h. As shown in Supplementary Information Fig. S8, Hela cells treated with probe 1 for 24 h show shorter T1 value (858±8 ms) by 6% than 0 h (914±2 ms), which are not as obvious as that in E. coli.
Figure 6.

Cellular MR studies of incubating with probe 1. (a) T1 values (7 T) of E. coli cell pellets after incubation with 200 μmol/L of probe 1 for 0 or 24 h. (b) T1-weighted MR images (7 T, TE/TR=8/400 ms) of E. coli cell pellets after incubation with 200 μmol/L of probe 1 for 0 h or 24 h. Data are means±SD (n=3).
3.7. Cytotoxicity of probe 1
Finally, we evaluated the cytotoxicity of probe 1 using standard MTS assays to further qualify our probe for in vivo studies and exclude any detrimental interfering effects in our cellular studies. As shown in Supplementary Information Fig. S9, after incubation with probe 1 for 48 h, the viability of the cells showed no significant change, and approximately 80% of cells survived even at the very high concentration of 500 μmol/L of probe 1. The results indicate that our probe 1 has a low cytotoxicity and good biocompatibility.
4. Conclusions
In conclusion, we have designed and synthesized an NTR-enhanced MRI contrast agent, probe 1, which is convenient for the detection of NTR activity in vitro and in living E. coli. The para-nitrobenzyl moiety of probe 1 can be selectively reduced by NTR in the presence of NADH, followed by a self-immolative fragmentation, and formation of the Gd-DOTA, which was confirmed by LC–MS and HPLC analyses. Furthermore, relaxometric measurements revealed that the longitudinal T1 relaxivity of probe 1 is different from Gd-DOTA and thus changes in concentration of both species are detectable by MRI. The longitudinal relaxation time (T1) was decreased by 6% in response to NTR. More importantly, MR images studies of living E. coli incubated with probe 1 resulted an 8% signal intensity enhancement, which indicates that probe 1 could serve as an MRI-enhanced contrast agent for monitoring NTR activity. Probe 1 is the first reported smart MRI contrast agents for monitoring NTR activity in living bacteria, which has the potential for a wider application in therapeutic NTR-activated prodrug treatment in clinical research.
Acknowledgments
This study is supported by Sino-German research project GZ 1271, Peking Union Medical College (PUMC) Youth Fund (No. 3332016056) and the Innovation Project of Shandong Academy of Medical Sciences.
Footnotes
Peer review under responsibility of Institute of Materia Medica, Chinese Academy of Medical Sciences and Chinese Pharmaceutical Association.
Supplementary data associated with this article can be found in the online version at doi:10.1016/j.apsb.2017.11.001.
Contributor Information
Leilei Zhang, Email: zhangleilei@imm.ac.cn.
Qingqiang Yao, Email: yao_imm@163.com.
Hai-Yu Hu, Email: haiyu.hu@imm.ac.cn.
Appendix A. Supplementary material
Supplementary material
.
References
- 1.Hu H.Y., Gehrig S., Reither G., Subramanian D., Mall M.A., Plettenburg O. FRET-based and other fluorescent proteinase probes. Biotechnol J. 2014;9:266–281. doi: 10.1002/biot.201300201. [DOI] [PubMed] [Google Scholar]
- 2.Hu H.Y., Vats D., Vizovisek M., Kramer L., Germanier C., Wendt K.U. In vivo imaging of mouse tumors by a lipidated cathepsin S substrate. Angew Chem Int Ed. 2014;53:7669–7673. doi: 10.1002/anie.201310979. [DOI] [PMC free article] [PubMed] [Google Scholar]
- 3.Zhang Q., Wang Q., Xu S., Zuo L., You X., Hu H.Y. Aminoglycoside-based novel probes for bacterial diagnostic and therapeutic applications. Chem Commun. 2017;53:1366–1369. doi: 10.1039/c6cc08292k. [DOI] [PubMed] [Google Scholar]
- 4.Ferreira K., Hu H.Y., Fetz V., Prochnow H., Rais B., Müller P.P. Multivalent siderophore-DOTAM conjugates as theranostics for imaging and treatment of bacterial infections. Angew Chem Int Ed. 2017;56:8272–8276. doi: 10.1002/anie.201701358. [DOI] [PubMed] [Google Scholar]
- 5.Lauffer R.B. Paramagnetic metal complexes as water proton relaxation agents for NMR imaging: theory and design. Chem Rev. 1987;87:901–927. [Google Scholar]
- 6.Pierre V.C., Allen M.J., Caravan P. Contrast agents for MRI: 30+ years and where are we going?. J Biol Inorg Chem. 2014;19:127–131. doi: 10.1007/s00775-013-1074-5. [DOI] [PMC free article] [PubMed] [Google Scholar]
- 7.Verwilst P., Park S., Yoon B., Kim J.S. Recent advances in Gd-chelate based bimodal optical/MRI contrast agents. Chem Soc Rev. 2015;44:1791–1806. doi: 10.1039/c4cs00336e. [DOI] [PubMed] [Google Scholar]
- 8.Aime S., Botta M., Terreno E. Gd(III)-based contrast agents for MRI. Adv Inorg Chem. 2005;57:173–237. [Google Scholar]
- 9.Aime S., Castelli D.D., Crich S.G., Gianolio E., Terreno E. Pushing the sensitivity envelope of lanthanide-based magnetic resonance imaging (MRI) contrast agents for molecular imaging applications. Acc Chem Res. 2009;42:822–831. doi: 10.1021/ar800192p. [DOI] [PubMed] [Google Scholar]
- 10.Hu H.Y., Lim N.H., Juretschke H.P., Ding-Pfennigdorff D., Florian P., Kohlmann M. In vivo visualization of osteoarthritic hypertrophic lesions. Chem Sci. 2015;6:6256–6261. doi: 10.1039/c5sc01301a. [DOI] [PMC free article] [PubMed] [Google Scholar]
- 11.Hu H.Y., Lim N.H., Ding-Pfennigdorff D., Saas J., Wendt K.U., Ritzeler O. DOTAM derivatives as active cartilage-targeting drug carriers for the treatment of osteoarthritis. Bioconjugate Chem. 2015;26:383–388. doi: 10.1021/bc500557s. [DOI] [PubMed] [Google Scholar]
- 12.Major J.L., Meade T.J. Bioresponsive, cell-penetrating, and multimeric MR contrast agents. Acc Chem Res. 2009;42:893–903. doi: 10.1021/ar800245h. [DOI] [PMC free article] [PubMed] [Google Scholar]
- 13.Davies G.L., Kramberger I., Davis J.J. Environmentally responsive MRI contrast agents. Chem Commun. 2013;49:9704–9721. doi: 10.1039/c3cc44268c. [DOI] [PMC free article] [PubMed] [Google Scholar]
- 14.Heffern M.C., Matosziuk L.M., Meade T.J. Lanthanide probes for bioresponsive imaging. Chem Rev. 2014;114:4496–4539. doi: 10.1021/cr400477t. [DOI] [PMC free article] [PubMed] [Google Scholar]
- 15.Hingorani D.V., Bernstein A.S., Pagel M.D. A review of responsive MRI contrast agents: 2005–2014. Contrast Media Mol Imaging. 2015;10:245–265. doi: 10.1002/cmmi.1629. [DOI] [PMC free article] [PubMed] [Google Scholar]
- 16.Moat R.A., Fraser S.E., Meade T.J. A “smart” magnetic resonance imaging agent that reports on specific enzymatic activity. Angew Chem Int Ed. 1997;36:726–728. [Google Scholar]
- 17.Duimstra J.A., Femia F.J., Meade T.J. A gadolinium chelate for detection of β-glucuronidase: a self-immolative approach. J Am Chem Soc. 2005;127:12847–12855. doi: 10.1021/ja042162r. [DOI] [PubMed] [Google Scholar]
- 18.Chen S.H., Kuo Y.T., Singh G., Cheng T.L., Su Y.Z., Wang T.P. Development of a Gd(III)-based receptor-induced magnetization enhancement (RIME) contrast agent for β-glucuronidase activity profiling. Inorg Chem. 2012;51:12426–12435. doi: 10.1021/ic301827p. [DOI] [PubMed] [Google Scholar]
- 19.Ye D., Shuhendler A.J., Pandit P., Brewer K.D., Tee S.S., Cui L. Caspase-responsive smart gadolinium-based contrast agent for magnetic resonance imaging of drug-induced apoptosis. Chem Sci. 2014;5:3845–3852. doi: 10.1039/C4SC01392A. [DOI] [PMC free article] [PubMed] [Google Scholar]
- 20.MacRenaris K.W., Ma Z., Krueger R.L., Carney C.E., Meade T.J. Cell-permeable esterase-activated Ca(II)-sensitive MRI contrast agent. Bioconjugate Chem. 2016;27:465–473. doi: 10.1021/acs.bioconjchem.5b00561. [DOI] [PMC free article] [PubMed] [Google Scholar]
- 21.Gündüz S., Nitta N., Vibhute S., Shibata S., Mayer M.E., Logothetis N.K. Dendrimeric calcium-responsive MRI contrast agents with slow in vivo diffusion. Chem Commun. 2015;51:2782–2785. doi: 10.1039/c4cc07540d. [DOI] [PubMed] [Google Scholar]
- 22.Xiao Y.M., Zhao G.Y., Fang X.X., Zhao Y.X., Wang G.H., Yang W. A smart copper(II)-responsive binuclear gadolinium(III) complex-based magnetic resonance imaging contrast agent. RSC Adv. 2014;4:34421–34427. [Google Scholar]
- 23.Regueiro-Figueroa M., Gündüz S., Patinec V., Logothetis N.K., Esteban-Gómez D., Tripier R. Gd3+-based magnetic resonance imaging contrast agent responsive to Zn2+ Inorg Chem. 2015;54:10342–10350. doi: 10.1021/acs.inorgchem.5b01719. [DOI] [PubMed] [Google Scholar]
- 24.Gianolio E., Porto S., Napolitano R., Baroni S., Giovenzana G.B., Aime S. Relaxometric investigations and MRI evaluation of a liposome-loaded pH-responsive gadolinium(III) complex. Inorg Chem. 2012;51:7210–7217. doi: 10.1021/ic300447n. [DOI] [PubMed] [Google Scholar]
- 25.Bhuiyan M.P.I., Aryal M.P., Janic B., Karki K., Varma N.R., Ewing J.R. Concentration-independent MRI of pH with a dendrimer-based pH-responsive nanoprobe. Contrast Media Mol Imaging. 2015;10:481–486. doi: 10.1002/cmmi.1651. [DOI] [PMC free article] [PubMed] [Google Scholar]
- 26.de Smet M., Langereis S., van den Bosch S., Grüll H. Temperature-sensitive liposomes for doxorubicin delivery under MRI guidance. J Control Release. 2010;143:120–127. doi: 10.1016/j.jconrel.2009.12.002. [DOI] [PubMed] [Google Scholar]
- 27.Bryant D.W., McCalla D.R., Leeksma M., Laneuville P. Type I nitroreductases of Escherichia coli. Can J Microbiol. 1981;27:81–86. doi: 10.1139/m81-013. [DOI] [PubMed] [Google Scholar]
- 28.Kitamura S., Narai N., Tatsumi K. Studies on bacterial nitroreductases. Enzymes involved in reduction of aromatic nitro compounds in Escherichia coli. J Pharmacobiodyn. 1983;6:18–24. doi: 10.1248/bpb1978.6.18. [DOI] [PubMed] [Google Scholar]
- 29.Bryant C., Deluca M. Purification and characterization of an oxygen-insensitive NAD(P)H nitroreductase from Enterobacter cloacae. J Biol Chem. 1991;266:4119–4125. [PubMed] [Google Scholar]
- 30.Spain J.C. Biodegradation of nitroaromatic compounds. Annu Rev Microbiol. 1995;49:523–555. doi: 10.1146/annurev.mi.49.100195.002515. [DOI] [PubMed] [Google Scholar]
- 31.Roldán M.D., Pérez-Reinado E., Castillo F., Moreno-Vivián C. Reduction of polynitroaromatic compounds: the bacterial nitroreductases. FEMS Microbiol Rev. 2008;32:474–500. doi: 10.1111/j.1574-6976.2008.00107.x. [DOI] [PubMed] [Google Scholar]
- 32.Chung K.T., Murdock C.A., Zhou Y., Jr, Stevens S.E., Li Y.S., Wei C.I. Effects of the nitro-group on the mutagenicity and toxicity of some benzamines. Environ Mol Mutagen. 1996;27:67–74. doi: 10.1002/(SICI)1098-2280(1996)27:1<67::AID-EM9>3.0.CO;2-B. [DOI] [PubMed] [Google Scholar]
- 33.Li Z., Gao X., Shi W., Li X., Ma H. 7-((5-Nitrothiophen-2-yl)methoxy)-3H-phenoxazin-3-one as a spectroscopic off-on probe for highly sensitive and selective detection of nitroreductase. Chem Commun. 2013;49:5859–5861. doi: 10.1039/c3cc42610f. [DOI] [PubMed] [Google Scholar]
- 34.Xu J., Sun S., Li Q., Yue Y., Li Y., Shao S. A rapid response “turn-on” fluorescent probe for nitroreductase detection and its application in hypoxic tumor cell imaging. Analyst. 2015;140:574–581. doi: 10.1039/c4an01934b. [DOI] [PubMed] [Google Scholar]
- 35.Shi Y., Zhang S., Zhang X. A novel near-infrared fluorescent probe for selectively sensing nitroreductase (NTR) in an aqueous medium. Analyst. 2013;138:1952–1955. doi: 10.1039/c3an36807f. [DOI] [PubMed] [Google Scholar]
- 36.Wong R.H.F., Kwong T., Yau K.H., Au-Yeung H.Y. Real time detection of live microbes using a highly sensitive bioluminescent nitroreductase probe. Chem Commun. 2015;51:4440–4442. doi: 10.1039/c4cc10345a. [DOI] [PubMed] [Google Scholar]
- 37.Xue C., Lei Y., Zhang S., Sha Y. A cyanine-derived “turn-on” fluorescent probe for imaging nitroreductase in hypoxic tumor cells. Anal Methods. 2015;7:10125–10128. [Google Scholar]
- 38.Zhu D., Xue L., Li G., Jiang H. A highly sensitive near-infrared ratiometric fluorescent probe for detecting nitroreductase and cellular imaging. Sens Actuators B: Chem. 2016;222:419–424. [Google Scholar]
- 39.Iwaki S., Hanaoka K., Piao W., Komatsu T., Ueno T., Terai T. Development of hypoxia-sensitive Gd3+-based MRI contrast agents. Bioorg Med Chem Lett. 2012;22:2798–2802. doi: 10.1016/j.bmcl.2012.02.071. [DOI] [PubMed] [Google Scholar]
- 40.Do Q.N., Ratnakar J.S., Kovács Z., Sherry A.D. Redox- and hypoxia-responsive MRI contrast agents. ChemMedChem. 2014;9:1116–1129. doi: 10.1002/cmdc.201402034. [DOI] [PMC free article] [PubMed] [Google Scholar]
- 41.Yang Y., Aloysius H., Inoyama D. Enzyme-mediated hydrolytic activation of prodrugs. Acta Pharm Sin B. 2011;1:143–159. [Google Scholar]
- 42.Hu L., Fawcett J.P., Gu J. Protein target discovery of drug and its reactive intermediate metabolite by using proteomic strategy. Acta Pharm Sin B. 2012;2:126–136. [Google Scholar]
- 43.Solyanikova I.P., Baskunov B.P., Baboshin M.A., Saralov A.I., Golovleva L.A. Detoxification of high concentrations of trinitrotoluene by bacteria. Appl Biochem Microbiol. 2012;48:21–27. [PubMed] [Google Scholar]
- 44.Aime S., Gianolio E., Terreno E., Giovenzana G.B., Pagliarin R., Sisti M. Ternary Gd(III)L-HSA adducts: evidence for the replacement of inner-sphere water molecules by coordinating groups of the protein. Implications for the design of contrast agents for MRI. J Biol Inorg Chem. 2000;5:488–497. doi: 10.1007/pl00021449. [DOI] [PubMed] [Google Scholar]
- 45.Dickins R.S., Aime S., Batsanov A.S., Beeby A., Botta M., Bruce J.I. Structural, luminescence, and NMR studies of the reversible binding of acetate, lactate, citrate, and selected amino acids to chiral diaqua ytterbium, gadolinium, and europium complexes. J Am Chem Soc. 2002;124:12697–12705. doi: 10.1021/ja020836x. [DOI] [PubMed] [Google Scholar]
Associated Data
This section collects any data citations, data availability statements, or supplementary materials included in this article.
Supplementary Materials
Supplementary material