

Abstract
Background
Rheumatoid arthritis is characterized by chronic polyarticular synovitis and presents systemic changes that impact quality of life, such as impaired muscle function, seen in up to 66% of the patients. This can progress to severely debilitating state known as rheumatoid cachexia—without loss of fat mass and body weight—for which there is little consensus in terms of diagnosis or treatment. This study aims to evaluate whether the collagen‐induced arthritis (CIA) animal model also develops clinical and functional features characteristic of rheumatoid cachexia.
Methods
Male DBA1/J mice were randomly divided into 2 groups: healthy animals (CO, n = 11) and CIA animals (n = 13). The clinical score and edema size, animal weight and food intake, free exploratory locomotion, grip strength, and endurance exercise performance were tested 0, 18, 35, 45, 55, and 65 days after disease induction. After euthanasia, several organs, visceral and brown fat, and muscles were dissected and weighed. Muscles were used to assess myofiber diameter. Ankle joint was used to assess arthritis severity by histological score. Statistical analysis were performed using one‐way and two‐way analyses of variance followed by Tukey's and Bonferroni's test or t‐test of Pearson and statistical difference were assumed for a P value under 0.05.
Results
The CIA had significantly higher arthritis scores and larger hind paw edema volumes than CO. The CIA had decreased endurance exercise performance total time (fatigue; 23, 22, 24, and 21% at 35, 45, 55, and 65 days, respectively), grip strength (27, 55, 63, 60, and 66% at 25, 35, 45, 55, and 65 days, respectively), free locomotion (43, 57, 59, and 66% at 35, 45, 55, and 65 days, respectively), and tibialis anterior and gastrocnemius muscle weight (25 and 24%, respectively) compared with CO. Sarcoplasmic ratios were also reduced in CIA (TA: 23 and GA: 22% less sarcoplasmic ratio), confirming the atrophy of skeletal muscle mass in these animals than in CO. Myofiber diameter was also reduced 45% in TA and 41% in GA in CIA when compared with the CO. Visceral and brown fat were lighter in CIA (54 and 39%, respectively) than CO group.
Conclusions
The CIA model is a valid experimental model for rheumatoid cachexia given that the clinical changes observed were similar to those described in patients with rheumatoid arthritis.
Keywords: Collagen‐induced arthritis, Muscle loss, Cachexia, Rheumatoid arthritis, Muscle wasting
Background
Rheumatoid arthritis (RA) is an autoimmune inflammatory disease characterized by symmetric polyarthritis and significant systemic involvement. It affects 1% of people under 35 years and more than 2% of adults over 60 years old in the USA, a prevalence that has been reported worldwide.1, 2 Furthermore, RA is strongly associated with long‐term disability and premature mortality.3 Skeletal muscle wasting is a common and important complication of RA, and it has been recently reported that low muscle mass is present in 20% of initial RA patients.4 In the established disease stage, 38% of RA patients presented with low muscle mass,5 although previous studies described even higher rates of up to 66%.6, 7
Classical cachexia (from the Greek ‘cacos’, bad, and ‘hexis’, having) has been defined as a complex metabolic shift towards a disease state characterized by rapid loss of body cell mass, led mainly by muscle wasting.8, 9 It represents a state of anabolic resistance in which the muscles fail to synthesize sufficient protein and, given its significant clinical impact, is under increased scrutiny.7, 10 It has been reported that pro‐inflammatory cytokines could trigger many of cachexia effects, spatially TNFα, in this case also called cachectin because of its effects.11 In rheumatoid cachexia, it is observed relative excess of pro‐inflammatory cytokines, including TNFα, IL‐1β, IL‐6, and IFN‐γ.12 Pro‐inflammatory cytokines, the key development of synovitis and extra‐articular manifestations, carry to an increase in muscle proteolysis via the ubiquitin‐proteasome pathway13 and induce anorexia, especially by the IL‐1β cytokine.14 A widely used set of criteria to diagnose cachexia syndrome was recently formulated by Evans et al.8 The criteria were based on a body weight loss of 5% or more within 12 months [or a body mass index (BMI) <20 kg·m−2] and at least three of the following factors: decreased muscle strength, fatigue, anorexia, low fat mass index, and abnormal biochemistry [increased inflammatory markers (CRP, IL‐6), anaemia (Hb <12 g·dL−1), low serum albumin (<3.2 g·dL−1)].8 However, no consensus has been reached to diagnose cachexia, and studies use varying weight loss cut off points or symptoms.15
Although muscle wasting in RA has shared features with the classical form of cachexia, these processes appear to be different, since low BMI is unusual in RA as the fat mass is maintained or increased,16 and decreased BMI was stated to be the first step for classical cachexia diagnosis. Thus, Roubenoff et al.7 have firstly suggested the term rheumatoid cachexia for this state of muscle wasting, then later included the combination with maintenance, or increase, in total fat mass.5, 17, 18 Rheumatoid cachexia has been associated with decreased physical activity, and increased fatigue and weakness, leading to a significant loss of functional capacity and quality of life with an elevated socioeconomic impact.16, 19, 20 Also, rheumatoid cachexia shares similar abnormalities serological biochemistry with classical form of cachexia [increased inflammatory markers (CRP, TNFα, IL‐6), anaemia (Hb < 12 g·dL−1), low serum albumin (<3.2 g·dL−1)].
Animal models of disease can be useful in identifying biological changes associated with human disease because of the ability to control for confounding factors, such as genetic background, food intake, and environmental influences. The collagen‐induced arthritis (CIA) animal model has many of the characteristics of RA, including clinical manifestations and histological and immunological features.21 Previous study of our group described the temporal development of muscle wasting in this animal model, but there are no data concerning other aspects of the cachexia observed in RA patients.22 However, it would be worth as an animal model to confirm if CIA mimic rheumatoid cachexia by showing similar changes observed in patients, as can be listed: decreased muscle mass (muscle atrophy), decreased muscle strength, increased fatigue, and abnormal serological biochemistry [increased inflammatory markers (TNFα, IL‐6), anaemia (Hb < 12 g·dL−1), low serum albumin (<3.2 g·dL−1)]. Thus, the aim of this study was to assess the clinical characteristics of CIA to evaluate whether this animal model develops the clinical and functional features of rheumatoid cachexia.
Material and methods
Animals: Male DBA/1J mice between 8 and 12 weeks of age were randomly divided into two experimental groups: healthy animals (CO, n = 11) and CIA animals (CIA, n = 13). The mice were reared alone at 20°C, with a 12‐h light–dark cycle, food and water were provided ad libitum. Animals were followed up for 65 days, and all measurements were performed prior to the arthritis induction and 18, 25, 35, 45, 55, and 65 days thereafter. All experiments were performed following to the Guiding Principles for Research Involving Animals. This study was approved by the Research Ethics Committee of the Hospital de Clínicas de Porto Alegre (protocol no. 14‐0297). Arthritis was induced with bovine type II collagen (CII; Chondrex, Inc., Redmond, WA, USA; 2 mg·mL−1) dissolved in 0.1‐M acetic acid at 4°C for 12 h and in Complete Freund's Adjuvant (CFA; Sigma, St Louis, USA; 2 mg·mL−1) containing inactivated Mycobacterium tuberculosis.23 Fifty microliters of emulsion (CII + CFA) were injected intradermally at the base of the tail to induce arthritis; this was set as the day zero in this experiment. Eighteen days after the first injection, the animals received a reinforcement of CII emulsified with incomplete Freund's adjuvant (without M. tuberculosis) in another site of the tail (booster injection).22 During the procedures, mice were anaesthetized with isoflurane 10% (Abbott Laboratórios do Brasil Ltda., Brazil) and 90% of oxygen. Healthy controls were manipulated and anaesthetized; however, no injection was made. Animals were euthanized 65 days after the first injection. For the following analysis, a group of researchers was blinded for disease induction. The blindness was ensured until animals developed signs of the disease. In addition, all histological and molecular analyses were performed by blinded researchers.
Clinical severity score and measurement of edema: Arthritis severity was clinically determined for each paw, three times a week, according to the a scale of 0 to 4 (0, no evidence of erythema and swelling; 1, erythema and mild swelling confined to the tarsals or metatarsals; 2, erythema and moderate swelling of tarsal and the metatarsal or tarsal and ankle joints; 3, erythema and severe swelling extending from the ankle to metatarsal joints; and 4, erythema and severe swelling encompassing the ankle, foot and digits, or ankylosis of the limb).21, 23 The highest sum score that a mouse could reach was 16. Hind paw edema volume was measured using a plethysmometer (Insight Ltda., Ribeirão Preto, Brazil). Briefly, it is a small cylinder filled with a buffer connected to a device capable to measure the total fluid volume, we had immersed the hind pawn of the animal inside the cylinder and the total volume added is then measured, the difference between the final volume minus the initial volume results to pawn total volume.
Animal weight and food intake: Animals were weighed for total body mass three times a week starting before the first injection. Animal food was weighed three times a week starting before the first injection. The remaining food was subtracted from the offered food to follow up the food intake of each animal. Mean food intake was calculated through the sum of the total feed period between each interval (0, 18, 25, 35, 45, 55, and 65 days after the first injection) and divided by the total sampling time of each period of time.
Free exploratory locomotion: Animals were put in an acrylic cage with motion sensors (Monitor de Atividades IR; Insight Equipaments Ltda., Ribeirão Preto, Brazil).24 After 30 s of adaptation, all free exploratory locomotion was recorded for 5 min. The total distance covered by each animal was sent to a computer for posterior analysis.
Grip strength: Animals were tested for maximum grip strength with a test adapted from Deacon.25 Briefly, first, we used meshes with proper loads, each one amouting to 5, 20, 35, 50, 65, 80, and 95 g. Each mouse was held by the first third of the tail and suspended until it grasped the lighter weight with all paws. The animal had to hold the load for at least 3 recorded seconds. If the animal succeeded, it rested for 30 s before trying the next weight. If the animal failed three times with a 10‐srest between each attempt, the longest time it was able to hold the weight was recorded. The following equation was used: F max = P 3seg + (5*t <3seg), where F max is the maximum calculated grip strength, P 3seg is the heaviest load the animal held for 3 s, and t <3seg is the longest time the animal held the heaviest load. The final result was expressed in grams (g).
Endurance exercise performance: The endurance exercise performance test was conducted at the beginning of the dark cycle of the mice, when animals are active. The endurance exercise performance test consists in inducing mice into exhaustion. The mice were separately set to run on treadmill developed by Hospital de Clínicas de Porto Alegre engineers. We have followed previous protocol.26, 27, 28, 29 Briefly, animals were left on the treadmill for 5 min to adapt prior the test. After that, the test started at a speed of 8.5 m·min−1 for 9 min, for the animals to warm up, then every 3 min, the speed was increased in a constant ratio of 2.5 m·min−1. Animals reach exhaustion when they are not able to continue running up to maintain the speed (in this case, when the mice stayed for 10 s at the first third of the rear part of the equipment). The exhausted animals were put back into their cages, and the following measurements were recorded: speed at fatigue, total experiment time, and total covered distance. Only the total experiment time was used in this research.
Organs and tissue dissection: Sixty‐five days after the first injection, the tibialis anterior and gastrocnemius muscles were dissected immediately after euthanasia, weighed and collected to measure muscle myofiber diameter by histological analysis with haematoxylin–eosin (HE) staining. The tibia‐tarsal joint was collected to confirm the development of arthritis by histological analysis with HE staining. The following organs were dissected and weighed: heart, liver, spleen, quadriceps, and soleus muscle. For visceral and brown fat dissection, we followed Mann et al.30 All dissected organs and tissues not used for histological analyses were weighed in precision balance and frozen under −80°C.
Histological analysis: The tibia‐tarsal joint, tiabialis anterior, and gastrocnemius muscle of the DBA/1J animals were dissected and immersed in 10% buffered formalin for fixation for up to 3 days. Next, the tibia‐tarsal joints were decalcified in 10% nitric acid for 24 h. All these tissues were dehydrated and embedded in paraffin blocks. Slices 6‐μm thick were arranged on microscope slides. Tibialis anterior and gastrocnemius muscle slices stained with HE were used for myofiber diameter measurement. One transverse section of each muscle was stained with HE and analysed under an optic microscope (×400). Two straight lines crossing at a right angle at the fibre center were drawn in each myofiber. The mean of these diameters (in micrometres) was used to calculate the transverse section mean, based on circle area. For measuring the myofiber diameter of the whole muscle, we took 10 pictures of each section, and 20 fibres were measured from each picture using the Image‐Pro Express software (version 5.1.0.12, Media Cybernetics, Rockville, MD, USA). We used a histological score system to evaluate individual joints and assess arthritis severity. For synovial inflammation, five high‐power magnification fields were scored for the percentage of infiltrating mononuclear cells as follows: 0, absent; 1, mild (1–10%); 2, moderate (11–50%); 3, severe (51–100%); for synovial hyperplasia: 0, absent; 1, mild (5–10 layers); 2, moderate (11–50 layers); 3, severe (>20 layers); for extension of pannus formation based on the reader's impression: 0, absent; 1, mild; 2, moderate; 3, severe; for synovial fibrosis: 0, absent; 1, mild (1–10%); 2, moderate (11–50%); 3, severe (51–100%); for cartilage erosion, that is, the percentage of the cartilage surface that was eroded: 0, absent; 1, mild (1–10%); 2, moderate (11–50%); 3, severe (51–100%); and for bone erosion: 0, none; 1, minor erosion(s) observed only at high‐power magnification fields; 2, moderate erosion(s) observed at low magnification; 3, severe transcortical erosion(s).31
Statistics: Sample size was based on the previous research of our group with CIA,32 in which the main outcome was muscle atrophy accessed by myofiber area. For an alpha of 5% and a power of 90% in TA myofiber area, it was needed an amostral number of seven for each group. Considering a loss of 10% of animals due to death because of the disease induction and chronic inflammation, we used a total n of 11 to CO group and 13 to CIA group. After confirmation of Gaussian distribution by Shapiro–Wilk and Kolmogorov–Smirnov tests, quantitative data were described as mean ± standard error of the mean. Comparison between groups was performed using two‐way analysis of variance followed by Bonferroni's test for variables with two classifications, or independent t‐test of Pearson. All statistical tests were performed in Statistical Package for the Social Science software, version 18. Statistical difference were assumed for a P value under 0.05.
Results
Arthritis score, edema, and arthritis histopathology: First, it was necessary to confirm that the collagen‐induced animals had indeed developed arthritis. Incidence of arthritis was 100% 25 days after immunization (Figure 1A). As expected, CIA animals had significantly higher arthritis scores and hind paw edema volumes than CO, observed from the 35th day after immunization up until the end of the experiment (P < 0.05; Figure 1A and 1B). The histopathology showed that all control animals showed healthy ankle joints (Figure 1C), while it confirmed the disease in all CIA animals (Figure 1D). Cartilage and bone erosions, synovial hyperplasia, invasive pannus formation, and inflammatory cell infiltrates were observed in the CIA animals' ankle joint histology (Figure 1C, Supporting Information, Table S1).
Animal weight and food intake: There was no statistical difference in body weight and food intake between the control group and the CIA group during the experimental period (Figure 2A and 2B). Therefore, the CIA group showed no weight loss or decreased appetite. Besides no difference in body weight between groups, the normalized weights (i.e. divided by the body weight of the animal) for visceral and brown fat were reduced in CIA animals (54 and 39%, respectively; Supporting Information, Figure S1A and S1B). Ankle joint normalized weights and spleen normalized weights were increased in the CIA group when compared with controls (18 and 40%, respectively; Supporting Information, Figure S1C and S1E). The heart and liver normalized weights also showed no statistical difference between the groups (Supporting Information, Figure S1D and S1F).
Free exploratory locomotion, grip strength, and endurance exercise performance: We assessed the animals using mobility, strength, and endurance performance tests. Compared with the control group, free exploratory locomotion in the CIA group was statistically decreased (43, 57, 59, and 66% at 35, 45, 55, and 65 days, respectively), as well as endurance exercise performance total time (23, 22, 24, and 21% at 35, 45, 55, and 65 days, respectively). This was observed the 35th days after immunization until the end of the experiment (P < 0.05; Figure 3A and 3B). The CIA group also had a statistically decreased grip strength (27, 55, 63, 60, and 66% at 25, 35, 45, 55, and 65 days, respectively), which was seen from the 25th days after immunization until the end of the study period (P < 0.05; Figure 3C). We have also normalized grip strength with total animal weigh, which confirmed the decreased strength of CIA groups at 35 days after immunization until the end of the experiment (P < 0.05; 53, 62, 60, and 64% at 35, 45, 55, and 65 days, respectively; data not shown).
Muscle weight, sarcoplasmic ratio, and myofiber diameter: It was also necessary to confirm that animals would present muscle loss even if they did not show weight loss. The dissected tibialis anterior and gastrocnemius muscles weighed less in the CIA than in the control group (25 and 24%, respectively; P < 0.05; Figure 4). Sarcoplasmic ratios were also smaller in CIA, confirming that these animals' muscle mass decreased when compared with controls (23 and 22% less sarcoplasmic ratio, respectively; P < 0.05; Figure 4). Also, the myofiber diameter reduction was 45% in TA and 41% in GA (Figure 5), indicating increased atrophy in CIA animals. Quadriceps and soleus muscle weights showed no statistical difference between groups (Supporting Information, Figure S1G and S1H).
Figure 1.
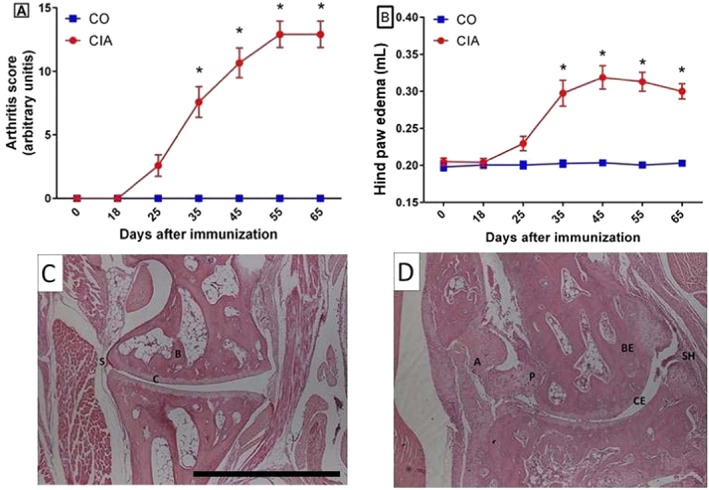
Follow up of experimental arthritis development. Arthritis score (A; ranging from 0 to 16) and hind paw edema volume measured in plethysmometer (B) of mice in the control group (CO) and the collagen‐induced arthritis group (CIA) during the experimental period. Mice with CIA presented progressive development of arthritis score and hindpaw oedema (A and B). Representative histopathology of ankle joint in controls (C) and CIA (D) at 65th day after immunization. Legend: A, angiogenesis; B, bone; BE, bone erosion; C, cartilage; CE, cartilage erosion; P, invasive pannus formation; S, synovial layer; and SH, synovial hyperplasia. Data are presented as mean ± standard error of the mean (SEM). Statistical analysis between groups was performed using two‐way analysis of variance followed by Bonferroni's test. *P < 0.05.
Figure 2.
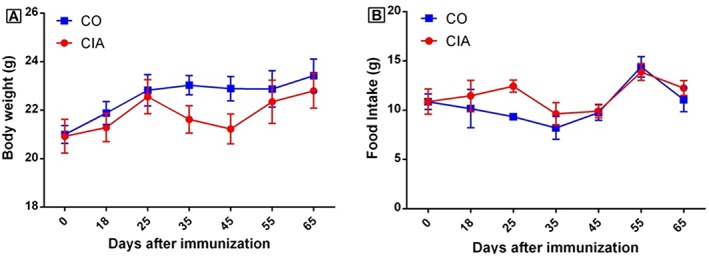
Animal body weight (A) and food intake (B) of mice in the control group (CO) and the collagen‐induced arthritis group (CIA) during the experimental period. No statistical differences were observed between groups in these parameters. Data are presented as mean ± standard error of the mean (SEM). Statistical analysis between groups was performed using two‐way analysis of variance followed by Bonferroni's test.
Figure 3.
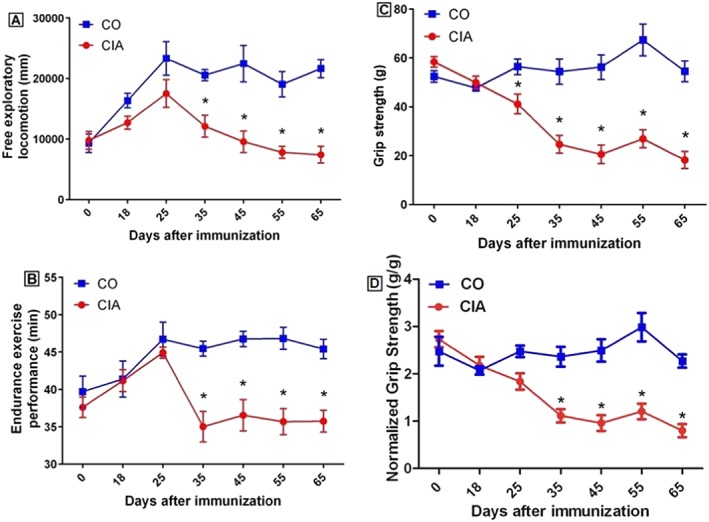
Free exploratory locomotion (A), total time during endurance exercise performance (B), grip strength (C), and grip strength normalized by animal weigh (D) of mice in the control group (CO) and the collagen‐induced arthritis group (CIA) during the experimental period. Mice with CIA presented decreased free locomotion, grip strength, and endurance from day 35 after immunization until the end of the experimental period. Data are presented as mean ± standard error of the mean (SEM). Statistical analysis between groups was performed using two‐way analysis of variance followed by Bonferroni's test. *P < 0.05.
Figure 4.
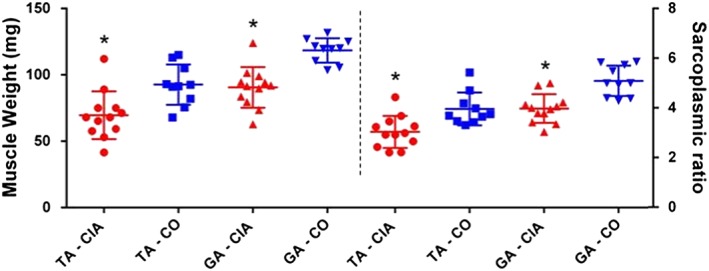
Tibialis anterior (TA) and gastrocnemius (GA) muscle weights and sarcoplasmic ratio (muscle weight in mg divided by animal body weight in grams at 65th day after immunization) of mice in the control group (CO; square and inverted triangle, respectively) and in the collagen‐induced arthritis group (CIA; circle and triangle, respectively) during the experimental period. Mice with CIA presented decreased muscle weight and sarcoplasmatic ratio in both muscles. Data are presented as mean ± standard error of the mean (SEM). Statistical analysis between groups was performed using independent t‐test of Pearson. *P < 0.05.
Figure 5.
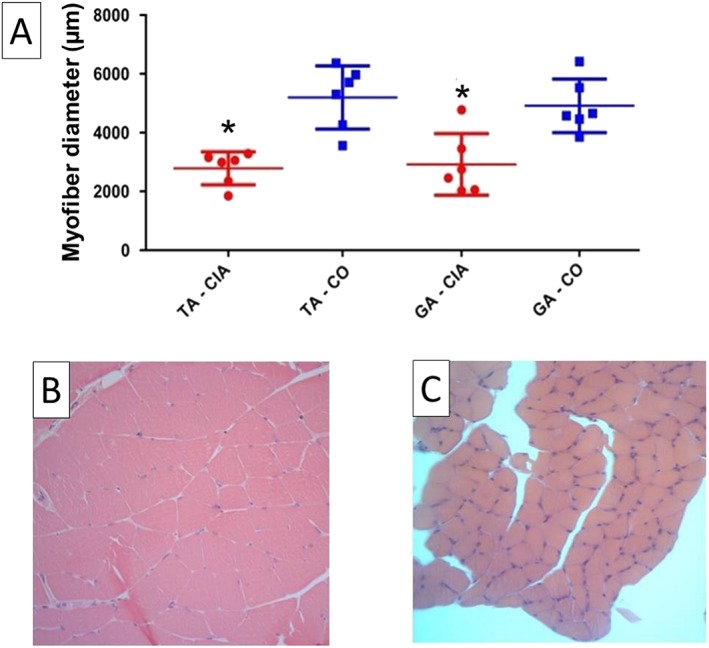
Myofiber diameter of the tibialis anterior (TA) and the gastrocnemius (GA) muscle (A) from mice in the control group (CO; square) and the collagen‐induced arthritis group (CIA; circle) at 65th day after immunization. Representative histology of GA muscle of CO (B) and CIA (C). Mice with CIA presented smaller myofiber diameter in both muscles. Data are presented as mean ± standard error of the mean (SEM). Statistical analysis between groups was performed using independent t‐test of Pearson. *P < 0.05.
Discussion
The combined effect of the systemic inflammation with alterations on energy metabolism and protein metabolism in RA patients causes changes in body composition and increased resting energy expenditure found in cachexia7, 12; nevertheless, the diagnostic criteria for RA cachexia are not totally clear in the literature. In this study, CIA animals developed cachexia with features similar to RA patients. Based on a previous study of our group,22 our hypothesis was that, during this period, the animals should develop strong muscle loss similar to RA patients with cachexia syndrome. As far as we are concerned, this is the first study to propose CIA animal model as an animal model of rheumatoid cachexia. Here, we demonstrate that mice with CIA present similar clinical aspects to RA patients, such as decreased muscle weight, increased fatigue, and weakness, and it is congruent with several aspects from the defining findings of cachexia.
Evans et al.8 proposed, as a main outcome to cachexia syndrome, weight loss of at least 5% in 12 months in the presence of underlying illness. This outcome is not observed in RA patients. Several studies have demonstrated that the increased TNFα and IL‐6 levels observed in RA patients, in conjunction with certain pharmacological treatments (e.g. corticoid use), play important roles in body weight.33 These individuals present increased or unchanged body weight, contrary to what is observed in cancer cachexia.33 Concerning the mentioned information, here we have not studied any pharmacological treatment in the CIA model and still the animals had not lost weight. We observed that the CIA group had specific decrease in muscle weight (tibialis anterior and gastrocnemius) and in fat mass (brown and visceral fat). In a study related to high‐fat diet in CIA, the authors have shown increased lipolysis related to CIA development, higher IL‐17 production, and no difference in animal weight compared with CIA fed with normal diet.34 Furthermore, in adjuvant‐induced arthritis animal model, several authors have found decreased fat mass compared with healthy controls.35, 36, 37 Martín et al.35 suggests that the mechanism is due to a decrease in white adipose mass is secondary to a reduced adipose lipogenesis. Lopez‐Menduina et al.37 have found decreased body weight gain in adjuvant‐induced arthritis rats, suggesting an inhibitory effect of inflammation on body weight, in which diseased animals has lower relative fat mass compared with pair‐fed healthy rats. Despite that lipid metabolism is relevant in RA, the response to treatment is also due to adipose tissue role as a potent source of cytokines and adipokines including TNF.38, 39 Furthermore, a recently published study with Antigen‐Induced Arthritis (AIA) in rabbits has shown increased in C‐reactive protein and GA IL‐1beta40 also corroborates to the inhibitory effect of inflammation on animal fat lipogenesis as well as muscle loss. Furthermore, there are few RA patients that develop severe arthritis that are the most similar to our animal model arthritis development. Those few patients with worse arthritis development have worse prognosis and also have similar phenotype to the classical cachexia. It would shed light on this fat storage incongruence a research with CIA animal model treated with corticoids and followed up until some develop cachexia to check if the visceral and brown fat mass are also increased in CIA as it is observed in most RA patients.
There are many animal models in which muscle loss is observed as a result of the disease development. There are numerous cancer cachexia animal model as cancer itself,41, 42, 43, 44, 45 for the other chronic diseases, the literature shows animal model of sepsis,46 chronic obstructive pulmonary disease,47 chronic renal failure,48 and chronic heart failure.46, 49, 50, 51, 52 However, these animal models are inadequate to be used as a rheumatoid cachexia animal model. Previous reports evaluating muscle alterations in arthritic rodent model showed that adjuvant‐induced arthritis induced weight loss and so could be used as a model for cachexia.53 The adjuvant‐induced arthritis model presented 6% of weight loss and a strong correlation with serum TNF‐α levels.53 In the present study, there was no statistical difference in body weight, meaning that animals gained weight normally as control group. In addition, there was no statistical difference in food intake between groups during the experimental period, demonstrating that the CIA model does not induce anorexia in mice. Therefore, CIA animals had no weight loss or decreased appetite, which corresponds with the observations in RA patients and rheumatoid cachexia.
Regarding physical capacity in RA, patients report a vicious cycle characterized by fatigue, reduced physical activity, loss of aerobic capacity, and increasing physical deterioration.54, 55, 56 In animal models, we observed a decrease in the free exploratory locomotion, probably living the same vicious cycle previously described, and which could be related to the diminished will to move observed in RA patients. Decreased free exploratory locomotion in addition to decreased total time during the endurance exercise performance would be interpreted as increased fatigue condition in the propositions by Evans et al.8 Hartog et al.24 demonstrated a decrease in free locomotion and an inverse correlation between locomotion and muscle weight in CIA. Filippin et al.22 demonstrated that a progressive reduction in free locomotion was related to the development of arthritis, with a strong correlation between muscle loss and the severity of arthritis.
Rheumatoid arthritis patients present a reduction in muscle strength when compared with healthy individuals.57, 58 In an ongoing study by our group, the quadriceps muscle strength in RA patients has a statistical significant decrease if compared with healthy controls (unpublished data). Corroborating these findings, the CIA mouse model has shown reduced muscle strength.59 This demonstrates that the CIA animal model shows alterations in muscle strength similar to those observed in humans. In addition, a previous study by our group showed that the physical capacity related to fatigue in endurance exercise performance testing was worse in the CIA group when compared with control groups.29 In the current study, the CIA group had a statistically decreased total time during the endurance exercise performance from the 35th day after immunization until the end of the experiment.
Increased muscle protein catabolism leads to loss of skeletal muscle mass and consequently to loss of muscle strength and power.60, 61 We have previously demonstrated that in the CIA rat model, muscle wasting is different from disuse‐induced muscle atrophy.62 Our previous research demonstrated that these animals present up to a 30% decrease in myofiber diameter after 45 days of disease induction.22 In addition, a recently published study with autoimmune monoarthritis by AIA has shown several molecular analyses for muscle wasting observed in rabbits, including increased GA atrogin‐1 and MURF‐1 expression.40 The present study confirms that animals had muscle loss even if they did not lose weight. It was observed by the less weigh in tibialis anterior and gastrocnemius muscles in the CIA group (decrease of 25 and 24%, respectively). In addition, sarcoplasmic ratios (reduction of 23% in the TA and 22% in the GA) and myofiber diameter (reduction of 45% in the TA and 41% in the GA) were also reduced in CIA, confirming that there is less muscle mass in these animals than in controls. This points to an increased atrophy in CIA animals and corroborates the findings of muscle weakness and lower levels of physical activity.
We assessed the functional impact of muscle wasting, demonstrating decrease of up to 66% in free exploratory locomotion, 66% in grip strength, and 24% in the total time during endurance exercise performance from days 35 to 65 after immunization. This fulfils some of the clinical criteria for cachexia proposed by Evans et al.,8 with the exception of clear weight loss and anorexia. However, it is relevant to note that muscle mass wasting without weight loss is also observed in RA patients. These observations suggest that these animals are reproducing similar mechanisms of muscle wasting as RA patients and thus may be considered as a useful animal model to study this syndrome. This study has the following weakness: blindness could be ensured up to disease development because of clear disease development (e.g. edema); however, blindness was kept in all experiments after euthanasia.
This study was the first to assess whether the CIA animal model also develops the clinical and functional features of rheumatoid cachexia. The main limitation was that it did not assess biochemistry parameters. In our study, we observed 100% of incidence of arthritis and development of several muscle features related to cachexia, including reduced locomotion and strength, increased fatigue, lighter muscle weight, no anorexia, and no weight loss. Those muscle‐related observations are also compatible to diagnose criteria of cachexia suggested by Evans et al.8; however, there is incompatibility of clear weight loss as their first criteria factor, this main feature is also not observed in RA patients with muscle wasting. In conclusion, the CIA animal model with DBA/1J male mice seems to be a suitable animal model for rheumatoid cachexia, as it allows for the control of confounding factors such as genetic background, food intake, and environmental influences. Our results are relevant to future studies because they help understand the biological and molecular mechanisms of rheumatoid cachexia. It is important that future studies follow the protocol established in our research when performing several different types of treatments.
Perspectives
A molecular analysis of rheumatoid cachexia development in a CIA animal model is still needed. Also, it would be interesting to research for molecules that could be used to facilitate diagnosis of the disease as well as follow up its progress. In addition, it would be interesting to research the effect of CIA between type I from type II myofiber in muscle during disease progress.
Author contribution
PVGA and VONT have contributed to planning, cachexia model follow up, statistics analysis, scientific discussion, and writing. PSL, JMSS, and RCES have contributed to planning, cachexia model follow up, statistics, scientific discussion, and writing. ASA and MSO have contributed to cachexia model follow up and writing. MI has contributed to cachexia model follow up. ECF has contributed to planning, cachexia model follow up, and scientific discussion. LIF has the original idea of cachexia model and scientific discussion. RMX was the supervisor for all experiments and has contributed to planning, scientific discussion, and paper corrections.
Funding
We also thank the Coordination for the Improvement of Higher Level Personnel (Coordenação de Aperfeiçoamento de Pessoal de Nível Superior—CAPES) institution and the Foundation for Research Support of the Rio Grande do Sul State (Fundação de Amparo à Pesquisa do Estado do Rio Grande do Sul—FAPERGS) for granting scholarships to the students that helped develop this study. This work was supported by the Research and Events Incentive Fund (Fundo de Incentivo à Pesquisa e Eventos—FIPE) of HCPA and by the http://www.bv.fapesp.br/en/178/national-council-for-scientific-and-technological-development-cnpq/ (Conselho Nacional de Desenvolvimento Científico e Tecnológico—CNPq).
The authors certify that they comply with the ethical guidelines for publishing in the Journal of Cachexia, Sarcopenia and Muscle: update 2015.63
Conflicts of interest
The authors have no conflict of interest to declare.
Supporting information
Supplementary Figure S1. Normalized weight of tissues (tissue weight in mg divided by animal weight in g) from mice in the control group (CO) and the collagen‐induced arthritis group (CIA) at 65th day after the disease induction. Mice with CIA presented reduced normalized visceral fat and brown fat weights and increased normalized ankle joint and spleen weights. Normalized liver, heart and quadriceps weights remained similar between groups. (A) Visceral fat; (B) Brow fat; (C) Ankle joint; (D) Liver; (E) Spleen; (F) Heart; (G) Quadriceps muscle; and (H) Soleus muscle. Data is presented as mean ± standard error of the mean (SEM). Statistical analysis between groups was performed using independent t‐test of Pearson. * p<0.05.
Supplementary Table S1: Histopathology parameters of ankle joints from mice in the control group (CO) and in the collagen‐induced arthritis group (CIA). Cartilage and bone erosion, synovial hyperplasia, invasive pannus formation, and inflammatory cellsinfiltrates were measured. Mice with CIA presented increased alterations in all parameters. Statistical analysis between groups was performed using chi‐square analysis and results are shown in median (interquartile range).
Acknowledgements
We thank the Animal Experimentation Unit from the Hospital de Clínicas de Porto Alegre (HCPA) for their help during animal experimentation.
Alabarse, P. V. G. , Lora, P. S. , Silva, J. M. S. , Santo, R. C. E. , Freitas, E. C. , de Oliveira, M. S. , Almeida, A. S. , Immig, M. , Teixeira, V. O. N. , Filippin, L. I. , and Xavier, R. M. (2018) Collagen‐induced arthritis as an animal model of rheumatoid cachexia. Journal of Cachexia, Sarcopenia and Muscle, 9: 603–612. doi: 10.1002/jcsm.12280.
References
- 1. Navarro‐Millan I, Singh JA, Curtis JR. Systematic review of tocilizumab for rheumatoid arthritis: a new biologic agent targeting the interleukin‐6 receptor. Clin Ther 2012;34:788–802. [DOI] [PMC free article] [PubMed] [Google Scholar]
- 2. von Haehling S, Anker MS, Anker SD. Prevalence and clinical impact of cachexia in chronic illness in Europe, USA, and Japan: facts and numbers update 2016. J Cachexia Sarcopenia Muscle 2016;7:507–509. [DOI] [PMC free article] [PubMed] [Google Scholar]
- 3. Sindhu G, Ratheesh M, Shyni GL, Nambisan B, Helen A. Anti‐inflammatory and antioxidative effects of mucilage of Trigonella foenum graecum (Fenugreek) on adjuvant induced arthritic rats. Int Immunopharmacol 2012;12:205–211. [DOI] [PubMed] [Google Scholar]
- 4. van Bokhorst‐de van der Schueren MAE, Konijn NPC, Bultink IEM, Lems WF, Earthman CP, van Tuyl LHD. Relevance of the new pre‐cachexia and cachexia definitions for patients with rheumatoid arthritis. Clin Nutr 2012;31:1008–1010. [DOI] [PubMed] [Google Scholar]
- 5. Elkan A‐C, Håkansson N, Frostegård J, Cederholm T, Hafström I, Hakansson N, et al. Rheumatoid cachexia is associated with dyslipidemia and low levels of atheroprotective natural antibodies against phosphorylcholine but not with dietary fat in patients with rheumatoid arthritis: a cross‐sectional study. Arthritis Res Ther 2009;11:R37. [DOI] [PMC free article] [PubMed] [Google Scholar]
- 6. Munro R, Capell H. Prevalence of low body mass in rheumatoid arthritis: association with the acute phase response. Ann Rheum Dis 1997;56:326–329. [DOI] [PMC free article] [PubMed] [Google Scholar]
- 7. Roubenoff R, Roubenoff RA, Ward LM, Holland SM, Hellmann DB. Rheumatoid cachexia—depletion of lean body‐mass in rheumatoid‐arthritis—possible association with tumor‐necrosis‐factor. J Rheumatol 1992;19:1505–1510. [PubMed] [Google Scholar]
- 8. Evans WJ, Morley JE, Argiles J, Bales C, Baracos V, Guttridge D, et al. Cachexia: a new definition. Clin Nutr 2008;27:793–799. [DOI] [PubMed] [Google Scholar]
- 9. Muscaritoli M, Lucia S, Molfino A, Cederholm T, Rossi Fanelli F. Muscle atrophy in aging and chronic diseases: is it sarcopenia or cachexia? Intern Emerg Med 2013;8:553–560. [DOI] [PubMed] [Google Scholar]
- 10. Lok C. The last illness. Nature 2015;528:182–183. [DOI] [PubMed] [Google Scholar]
- 11. Tracey KJ, Morgello S, Koplin B, Fahey TJ, Fox J, Aledo A, et al. Metabolic effects of cachectin/tumor necrosis factor are modified by site of production. Cachectin/tumor necrosis factor‐secreting tumor in skeletal muscle induces chronic cachexia, while implantation in brain induces predominantly acute anorexia. J Clin Invest 1990;86:2014–2024. [DOI] [PMC free article] [PubMed] [Google Scholar]
- 12. Roubenoff RA, Roubenoff RA, Cannon JG, Kehayias JJ, Zhuang H, Dawson‐Hughes B, et al. Rheumatoid cachexia—cytokine‐driven hypermetabolism accompanying reduced body cell mass in chronic inflammation. J Clin Invest 1994;93:2379–2386. [DOI] [PMC free article] [PubMed] [Google Scholar]
- 13. Morley JE, Thomas DR. Wilson M‐MGMG. Cachexia: pathophysiology and clinical relevance. Am J Clin Nutr 2006;83:735–743. [DOI] [PubMed] [Google Scholar]
- 14. Masuko K. Rheumatoid cachexia revisited: a metabolic co‐morbidity in rheumatoid arthritis. Front Nutr 2014;1:20. [DOI] [PMC free article] [PubMed] [Google Scholar]
- 15. Ali S, Garcia JM. Sarcopenia, cachexia and aging: diagnosis, mechanisms and therapeutic options—a mini‐review. Gerontology 2014;60:294–305. [DOI] [PMC free article] [PubMed] [Google Scholar]
- 16. Summers GD, Deighton CM, Rennie MJ, Booth AH. Rheumatoid cachexia: a clinical perspective. Rheumatology 2008;47:1124–1131. [DOI] [PubMed] [Google Scholar]
- 17. Elkan A‐CC, Engvall I‐LL, Cederholm T, Hafström I. Rheumatoid cachexia, central obesity and malnutrition in patients with low‐active rheumatoid arthritis: feasibility of anthropometry, Mini Nutritional Assessment and body composition techniques. Eur J Nutr 2009;48:315–322. [DOI] [PubMed] [Google Scholar]
- 18. Engvall I‐LLIL, Elkan A‐CCA, Tengstrand B, Cederholm T, Brismar K, Hafstrom I, et al. Cachexia in rheumatoid arthritis is associated with inflammatory activity, physical disability, and low bioavailable insulin‐like growth factor. Scand J Rheumatol 2008;37:321–328. [DOI] [PubMed] [Google Scholar]
- 19. Dunlop DD, Manheim LM, Yelin EH, Song J, Chang RW. The costs of arthritis. Arthritis Rheum Care Res 2003;49:101–113. [DOI] [PubMed] [Google Scholar]
- 20. Palus S, von Haehling S, Springer J. Muscle wasting: an overview of recent developments in basic research. Int J Cardiol 2014;176:640–644. [DOI] [PubMed] [Google Scholar]
- 21. Oliveira PG, Grespan R, Pinto LG, Meurer L, Brenol JCT, Roesler R, et al. Protective effect of RC‐3095, an antagonist of the gastrin‐releasing peptide receptor, in experimental arthritis. Arthritis Rheum 2011;63:2956–2965. [DOI] [PubMed] [Google Scholar]
- 22. Filippin LI, Teixeira VN, Viacava PR, Lora PS, Xavier LL, Xavier RM. Temporal development of muscle atrophy in murine model of arthritis is related to disease severity. J Cachexia Sarcopenia Muscle 2013;4:231–238. [DOI] [PMC free article] [PubMed] [Google Scholar]
- 23. Rosloniec EF, Cremer M, Kang AH, Myers LK, Brand DD. Collagen‐induced arthritis. Curr Protoc Immunol 2010;Chapter 15:Unit 15.5;1–25. [DOI] [PubMed] [Google Scholar]
- 24. Hartog A, Hulsman J, Garssen J. Locomotion and muscle mass measures in a murine model of collagen‐induced arthritis. BMC Musculoskelet Disord 2009;10:59. [DOI] [PMC free article] [PubMed] [Google Scholar]
- 25. Deacon RMJ. Measuring the strength of mice. Jove‐Journal Vis Exp 2013;https://doi.org/10.3791/2610. [DOI] [PMC free article] [PubMed] [Google Scholar]
- 26. Kregel KC, Allen DL, Booth FW, Fleshner MR, Henriksen EJ, Musch TI et al Resource book for the design of animal exercise protocols. 2007. doi:https://doi.org/10.2460/ajvr.68.6.583.
- 27. Massett MP, Berk BC. Strain‐dependent differences in responses to exercise training in inbred and hybrid mice. Am J Physiol Regul Integr Comp Physiol 2005;288:R1006–R1013. [DOI] [PubMed] [Google Scholar]
- 28. Zachwieja NJ, O'Connell GC, Stricker JC, Allen J, Vona‐Davis L, Bryner R, et al. Loss of adipocyte VEGF impairs endurance exercise capacity in mice. Med Sci Sports Exerc 2015;47:2329–2339. [DOI] [PMC free article] [PubMed] [Google Scholar]
- 29. Cavalheiro R, Miranda J, Silva DS, Oliveira V, Teixeira N, Vinicius P, et al. Individualized moderate aerobic exercise improves physical capacity and prevents weight loss in collagen‐induced arthritis. Int J Clin Exp Med 2016;9:22696–22703. [Google Scholar]
- 30. Mann A, Thompson A, Robbins N, Blomkalns AL. Localization, identification, and excision of murine adipose depots. J Vis Exp 2014;https://doi.org/10.3791/52174. [DOI] [PMC free article] [PubMed] [Google Scholar]
- 31. Brenner M, Meng HC, Yarlett NC, Griffiths MM, Remmers EF, Wilder RL, et al. The non‐major histocompatibility complex quantitative trait locus Cia10 contains a major arthritis gene and regulates disease severity, pannus formation, and joint damage. Arthritis Rheum 2005;52:322–332. [DOI] [PubMed] [Google Scholar]
- 32. Filippin LI, Moreira AJ, Marroni NP, Xavier RM. Nitric oxide and repair of skeletal muscle injury. Nitric Oxide‐Biology Chem 2009;21:157–163. [DOI] [PubMed] [Google Scholar]
- 33. Castillo‐Hernandez J, Maldonado‐Cervantes MI, Reyes JP, Patiño‐Marin N, Maldonado‐Cervantes E, Solorzano‐Rodriguez C, et al. A obesidade é um determinante da resistência à insulina mais importante do que os níveis circulantes de citocinas pró‐inflamatórias em pacientes com artrite reumatoide. Rev Bras Reumatol 2016;https://doi.org/10.1016/j.rbr.2016.10.005. [Google Scholar]
- 34. Na HS, J‐EE K, Lee SH, Jhun JY, SMS‐YS‐MSY K, SMS‐YS‐MSY K, et al. Th17 and IL‐17 cause acceleration of inflammation and fat loss by inducing α2‐Glycoprotein 1 (AZGP1) in rheumatoid arthritis with high‐fat diet. Am J Pathol 2017;187:1049–1058. [DOI] [PubMed] [Google Scholar]
- 35. Martín AI, Castillero E, Granado M, López‐Menduiña M, Villanúa MA, López‐Calderón A. Adipose tissue loss in adjuvant arthritis is associated with a decrease in lipogenesis, but not with an increase in lipolysis. J Endocrinol 2008;197:111–119. [DOI] [PubMed] [Google Scholar]
- 36. Hamaguchi K, Itabashi A, Kuroe Y, Nakano M, Fujimoto E, Kato T, et al. Analysis of adipose tissues and stromal vascular cells in a murine arthritis model. Metabolism 2012;61:1687–1695. [DOI] [PubMed] [Google Scholar]
- 37. Lopez‐Menduina M, Martin AI, Castillero E, Villanua MA, Lopez‐Calderon A, López‐Menduiña M, et al. Systemic IGF‐I administration attenuates the inhibitory effect of chronic arthritis on gastrocnemius mass and decreases atrogin‐1 and IGFBP‐3. Am J Physiol Integr Comp Physiol 2010;299:R541–R551. [DOI] [PubMed] [Google Scholar]
- 38. Hotamisligil GS, Arner P, Caro JF, Atkinson RL, Spiegelman BM. Increased adipose tissue expression of tumor necrosis factor‐alpha in human obesity and insulin resistance. J Clin Invest 1995;95:2409–2415. [DOI] [PMC free article] [PubMed] [Google Scholar]
- 39. Sime K, Choy EH, Williams AS. Alterations to adipose tissue morphology during inflammatory arthritis is indicative of vasculopathology in DBA/1 mice. Adipocyte 2017;6:87–101. [DOI] [PMC free article] [PubMed] [Google Scholar]
- 40. Little RD, Prieto‐Potin I, Pérez‐Baos S, Villalvilla A, Gratal P, Cicuttini F, et al. Compensatory anabolic signaling in the sarcopenia of experimental chronic arthritis. Sci Rep 2017;7:6311. [DOI] [PMC free article] [PubMed] [Google Scholar]
- 41. Giles K, Guan C, Jagoe TR, Mazurak V. Diet composition as a source of variation in experimental animal models of cancer cachexia. J Cachexia Sarcopenia Muscle 2016;7:110–125. [DOI] [PMC free article] [PubMed] [Google Scholar]
- 42. Toneto AT, Ferreira Ramos LA, Salomão EM, Tomasin R, Aereas MA, MCC Gomes‐Marcondes. Nutritional leucine supplementation attenuates cardiac failure in tumour‐bearing cachectic animals. J Cachexia Sarcopenia Muscle 2016;7:577–586. [DOI] [PMC free article] [PubMed] [Google Scholar]
- 43. das Neves W, Alves CRR, de Almeida NR, Guimarães FLR, Ramires PR, Brum PC, et al. Loss of strength capacity is associated with mortality, but resistance exercise training promotes only modest effects during cachexia progression. Life Sci 2016;163:11–22. [DOI] [PubMed] [Google Scholar]
- 44. Terawaki K, Sawada Y, Kashiwase Y, Hashimoto H, Yoshimura M, Suzuki M, et al. New cancer cachexia rat model generated by implantation of a peritoneal dissemination‐derived human stomach cancer cell line. AJP Endocrinol Metab 2014;306:E373–E387. [DOI] [PubMed] [Google Scholar]
- 45. Mueller TC, Bachmann J, Prokopchuk O, Friess H, Martignoni ME. Molecular pathways leading to loss of skeletal muscle mass in cancer cachexia—can findings from animal models be translated to humans? BMC Cancer 2016;16:75. [DOI] [PMC free article] [PubMed] [Google Scholar]
- 46. Holecek M. Muscle wasting in animal models of severe illness. Int J Exp Pathol 2012;93:157–171. [DOI] [PMC free article] [PubMed] [Google Scholar]
- 47. Dong Y, Li Y, Sun Y, Mao J, Yao F, Tian Y, et al. Bufei Jianpi granules improve skeletal muscle and mitochondrial dysfunction in rats with chronic obstructive pulmonary disease. BMC Complement Altern Med 2015;15:51. [DOI] [PMC free article] [PubMed] [Google Scholar]
- 48. Kir S, Komaba H, Garcia AP, Economopoulos KP, Liu W, Lanske B, et al. PTH/PTHrP receptor mediates cachexia in models of kidney failure and cancer. Cell Metab 2016;23:315–323. [DOI] [PMC free article] [PubMed] [Google Scholar]
- 49. Ishida J, Saitoh M, Doehner W, von Haehling S, Anker MS, Anker SD, et al. Animal models of cachexia and sarcopenia in chronic illness: cardiac function, body composition changes and therapeutic results. Int J Cardiol 2017;238:12–18. [DOI] [PubMed] [Google Scholar]
- 50. Ishida J, Konishi M, Saitoh M, Springer J. Significance of animal models of cardiac cachexia and impact of gender on cardiac cachexia. Int J Cardiol 2016;223:852–853. [DOI] [PubMed] [Google Scholar]
- 51. Molinari F, Malara N, Mollace V, Rosano G, Ferraro E. Animal models of cardiac cachexia. Int J Cardiol 2016;219:105–110. [DOI] [PubMed] [Google Scholar]
- 52. DeBoer MD. Animal models of anorexia and cachexia. Expert Opin Drug Discov 2009;4:1145–1155. [DOI] [PMC free article] [PubMed] [Google Scholar]
- 53. Roubenoff R, Freeman LM, Smith DE, Abad LW, Dinarello CA, Kehayias JJ. Adjuvant arthritis as a model of inflammatory cachexia. Arthritis Rheum 1997;40:534–539. [DOI] [PubMed] [Google Scholar]
- 54. Balsamo S, Diniz LR. dos Santos‐Neto LL, da Mota LMH. Exercise and fatigue in rheumatoid arthritis. Isr Med Assoc J 2014;16:57–60. [PubMed] [Google Scholar]
- 55. Cooney JK, Law RJ, Matschke V, Lemmey AB, Moore JP, Ahmad Y, et al. Benefits of exercise in rheumatoid arthritis. J Aging Res 2011;2011:681640. [DOI] [PMC free article] [PubMed] [Google Scholar]
- 56. Roubenoff R. Exercise and inflammatory disease. Arthritis Rheum 2003;49:263–266. [DOI] [PubMed] [Google Scholar]
- 57. Bilberg A, Bremell T, Balogh I, Mannerkorpi K. Significantly impaired shoulder function in the first years of rheumatoid arthritis: a controlled study. Arthritis Res Ther 2015;17:261. [DOI] [PMC free article] [PubMed] [Google Scholar]
- 58. Oliveira SCG, Oliveira LM, Jones A, Natour J. Avaliação isocinética do tornozelo de pacientes com artrite reumatoide. Rev Bras Reumatol 2015;55:318–324. [DOI] [PubMed] [Google Scholar]
- 59. Yamada T, Place N, Kosterina N, Ostberg T, Zhang SJ, Grundtman C, et al. Impaired myofibrillar function in the soleus muscle of mice with collagen‐induced arthritis. Arthritis Rheum 2009;60:3280–3289. [DOI] [PubMed] [Google Scholar]
- 60. Matschke V, Murphy P, Lemmey AB, Maddison PJ, Thom JM. Muscle quality, architecture, and activation in cachectic patients with rheumatoid arthritis. J Rheumatol 2010;37:282–284. [DOI] [PubMed] [Google Scholar]
- 61. Neuberger GB, Aaronson LS, Gajewski B, Embretson SE, Cagle PE, Loudon JK, et al. Predictors of exercise and effects of exercise on symptoms, function, aerobic fitness, and disease outcomes of rheumatoid arthritis. Arthritis Rheum 2007;57:943–952. [DOI] [PubMed] [Google Scholar]
- 62. de Nunes Teixeira VO, Filippin LI, Viacava PR, de Oliveira PG, Xavier RM. Muscle wasting in collagen‐induced arthritis and disuse atrophy. Exp Biol Med 2013;238:1421–1430. [DOI] [PubMed] [Google Scholar]
- 63. von Haehling S, Morley JE, Coats AJS, Anker SD. Ethical guidelines for publishing in the Journal of Cachexia, Sarcopenia and Muscle: update 2015. J Cachexia Sarcopenia Muscle 2015;6:315–316. [DOI] [PMC free article] [PubMed] [Google Scholar]
Associated Data
This section collects any data citations, data availability statements, or supplementary materials included in this article.
Supplementary Materials
Supplementary Figure S1. Normalized weight of tissues (tissue weight in mg divided by animal weight in g) from mice in the control group (CO) and the collagen‐induced arthritis group (CIA) at 65th day after the disease induction. Mice with CIA presented reduced normalized visceral fat and brown fat weights and increased normalized ankle joint and spleen weights. Normalized liver, heart and quadriceps weights remained similar between groups. (A) Visceral fat; (B) Brow fat; (C) Ankle joint; (D) Liver; (E) Spleen; (F) Heart; (G) Quadriceps muscle; and (H) Soleus muscle. Data is presented as mean ± standard error of the mean (SEM). Statistical analysis between groups was performed using independent t‐test of Pearson. * p<0.05.
Supplementary Table S1: Histopathology parameters of ankle joints from mice in the control group (CO) and in the collagen‐induced arthritis group (CIA). Cartilage and bone erosion, synovial hyperplasia, invasive pannus formation, and inflammatory cellsinfiltrates were measured. Mice with CIA presented increased alterations in all parameters. Statistical analysis between groups was performed using chi‐square analysis and results are shown in median (interquartile range).