

Abstract
Background
Cancer cachexia increases morbidity and mortality, and blocking of activin receptor ligands has improved survival in experimental cancer. However, the underlying mechanisms have not yet been fully uncovered.
Methods
The effects of blocking activin receptor type 2 (ACVR2) ligands on both muscle and non‐muscle tissues were investigated in a preclinical model of cancer cachexia using a recombinant soluble ACVR2B (sACVR2B‐Fc). Treatment with sACVR2B‐Fc was applied either only before the tumour formation or with continued treatment both before and after tumour formation. The potential roles of muscle and non‐muscle tissues in cancer cachexia were investigated in order to understand the possible mechanisms of improved survival mediated by ACVR2 ligand blocking.
Results
Blocking of ACVR2 ligands improved survival in tumour‐bearing mice only when the mice were treated both before and after the tumour formation. This occurred without effects on tumour growth, production of pro‐inflammatory cytokines or the level of physical activity. ACVR2 ligand blocking was associated with increased muscle (limb and diaphragm) mass and attenuation of both hepatic protein synthesis and splenomegaly. Especially, the effects on the liver and the spleen were observed independent of the treatment protocol. The prevention of splenomegaly by sACVR2B‐Fc was not explained by decreased markers of myeloid‐derived suppressor cells. Decreased tibialis anterior, diaphragm, and heart protein synthesis were observed in cachectic mice. This was associated with decreased mechanistic target of rapamycin (mTOR) colocalization with late‐endosomes/lysosomes, which correlated with cachexia and reduced muscle protein synthesis.
Conclusions
The prolonged survival with continued ACVR2 ligand blocking could potentially be attributed in part to the maintenance of limb and respiratory muscle mass, but many observed non‐muscle effects suggest that the effect may be more complex than previously thought. Our novel finding showing decreased mTOR localization in skeletal muscle with lysosomes/late‐endosomes in cancer opens up new research questions and possible treatment options for cachexia.
Keywords: Activin, Myostatin, MDSC, Protein synthesis, Acute phase response, Physical activity
Introduction
Cancer cachexia is a debilitating condition without an effective treatment. It is usually associated with marked loss of muscle and fat mass, reduced physical activity and function, decreased tolerance to cancer therapies and increased mortality.1, 2 Skeletal muscle has been an underappreciated tissue in health and disease,3 but a growing body of evidence suggests a beneficial role for treating muscle tissue in cachectic conditions associated with different diseases, such as cancer.4
Muscle wasting in cancer cachexia is a consequence of decreased muscle protein synthesis,5, 6 impaired regeneration7 and/or increased protein degradation,6 but their relative importance and mechanisms are not well known. One possible mechanism for muscle wasting in cachexia is increased signalling through activin receptor ligands, such as myostatin and activins.8, 9, 10, 11 Myostatin and activins negatively regulate muscle mass through binding to their receptors activin receptor type 2 (ACVR2) A and B.12, 13 Blocking these ligands or their receptors can increase muscle mass and prevent muscle wasting in various animal models,12, 13, 14, 15, 16 but also in humans.17, 18
Prevention of cancer associated cachexia by blocking ACVR2 ligands with either soluble receptor (sACVR2B)9, 16 or neutralizing antibody against the receptors14 has previously been shown to improve survival without an effect on primary tumour growth in preclinical animal models. In addition, many other strategies to prevent muscle loss in different experimental models suggest causality between reduced muscle loss and survival in cachexia. For example, inhibition of NF‐κB signalling reduced denervation‐ and Lewis lung carcinoma (LLC) tumour‐induced muscle loss which was associated with improved survival rate.19 Blocking GDF15, and consequently cachexia, significantly improved survival in fibrosarcoma (HT‐1080) and in LNCaP tumour‐bearing mice.20 Furthermore, preventing the loss of muscle mass in C26 tumour‐bearing mice by histone deacetylace inhibitor21 and by inhibiting TWEAK/Fn14 signalling in the tumour22 have prolonged survival.
If indeed treating cachexia and especially muscle loss by strategies such as blocking ACVR2 ligands can improve survival in cancer, this may occur at least in part through preventing the loss of respiratory muscle mass and function.23 However, also other factors, such as haematological changes, acute phase response (APR), inflammatory cytokines, and myeloid‐derived suppressor cells (MDSCs), have recently been identified as potential contributors to either the development of cancer cachexia or to the poor prognosis associated with it.24, 25, 26, 27, 28 The contribution of these factors to the improved survival, when treating cachexia by blocking of ACVR2 ligands, is unknown.
In the present study, we aimed to study the effects of blocking ACVR2 ligands in a preclinical model of cancer cachexia on both muscle and non‐muscle tissues. Two different treatment protocols were applied to compare the effects of blocking ACVR2 ligands only before the tumour formation, and thus increasing muscle size only prior to the onset of cachexia, or continued treatment both before and after the onset of cachexia. This comparison was performed to investigate whether increased muscle mass alone before the onset of cachexia is enough for the improved survival or if the continued treatment is crucial. We aimed to gain more insight into the potential mechanisms of muscle wasting and the role of non‐muscle tissues in cancer cachexia, in order to understand the sACVR2B‐mediated improved survival.
Materials and methods
Animals
BALB/c (BALB/cAnNCrl) male mice aged 5–6 weeks (Charles River Laboratories, Germany) were used in all experiments. Mice were housed under standard conditions (temperature 22°C, 12:12 h light/dark cycle) with free access to food pellets (R36; 4% fat, 55.7% carbohydrate, 18.5% protein, 3 kcal/g, Labfor, Stockholm Sweden) and water.
The treatment of the animals was in strict accordance with the European Convention for the protection of vertebrate animals used for experimental and other scientific purposes. The protocols were approved by the National Animal Experiment Board, and all the experiments were carried out in accordance with the guidelines of that committee (permit number: ESAVI/10137/04.10.07/2014) and with the ethical standards laid down in the 1964 Declaration of Helsinki and its later amendments.
Tumour cell culture
Colon 26 carcinoma (C26) cells (provided by Dr Fabio Penna, obtained from Prof. Mario P. Colombo and originally characterized by Corbett et al.29) were maintained in complete Dulbecco's Modified Eagle's Medium (high glucose, GlutaMAX™ Supplement, pyruvate, Gibco™, Life Technologies) supplemented with penicillin (100 U/mL), streptomycin (100 μg/mL), and 10% FBS. Our pilot experiments showed that injecting mice with C26 cells (5 × 10⁵), resulted in marked cachexia and considerably higher tumour gene expression of Activin A, Interleukin‐6 (Il‐6) and Myostatin in comparison to our previously conducted experiment using the LLC tumour model (Online Resource 1: Figure S1) with the same number of cells injected (5 × 10⁵), but larger tumour15 (data not shown).
Experimental design
The mice were randomized into one of four groups (matched by body weight): (i) healthy control mice (CTRL), (ii) C26 tumour‐bearing mice receiving vehicle treatment throughout the experiment (C26 + PBS), (iii) C26 tumour‐bearing mice receiving sACVR2B‐Fc treatment before tumour formation (until Day 1 after C26 cell inoculation) followed by vehicle treatment until the end of the experiment (C26 + sACVR/b), and (iv) C26 tumour‐bearing mice receiving continued sACVR2B‐Fc treatment throughout the experiment (C26 + sACVR/c). The experimental design and the treatment protocols are shown in Figure 1. Body mass and food intake of the mice were monitored daily in all the experiments.
Figure 1.
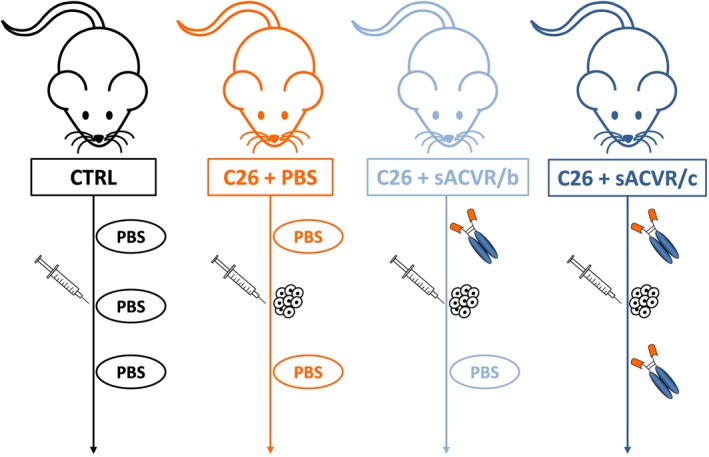
Schematic representation of the experimental design and the treatments. C26 cells were injected on Day 0, and sACVR2B‐Fc or PBS vehicle were administered on Days ‐11, ‐7, ‐3, 1, 5, and 9 in all experiments.
Survival experiment
The mice were followed until the predetermined humane end‐point criteria were fulfilled, or until 3 weeks after C26 cell inoculation at the latest, to investigate survival. The end‐point criteria combined the body mass loss and the overall condition of the mice. In the evaluation of the overall health status of the mice, the following aspects were taken into account in addition to the body mass loss: appearance and posture (lack of grooming, piloerection, and hunched posture), natural and provoked behaviour (inactivity, impaired locomotion, and reduced reactivity to external stimuli), and food intake/ability to eat and drink. Mice were euthanized when two researchers confirmed the fulfilment of the end‐point criteria. During the experiment, seven mice needed to be euthanized due to reasons unrelated to study purposes (e.g. tumour ulceration or self‐mutilation), and three mice were excluded from analysis due to delayed tumour growth. This did not have any major effect on the results.
Short‐term experiments
To study the potential mechanisms, another experiment was conducted with a predetermined end‐point at Day 11 after C26 cell inoculation (Figure 1). This experiment was repeated with three groups: CTRL, C26 + PBS and C26 + sACVR/c groups in order to replicate the findings of the first short‐term experiment and to collect more samples and data for further analysis.
Experimental treatments
An intraperitoneal injection of sACVR2B‐Fc (5 mg/kg) or PBS (100 μl) was administered twice a week, three times before and three times after C26 cell inoculation (on Days ‐11, ‐7, ‐3, 1, 5, and 9) in all experiments (Figure 1). On Day 0, mice were anaesthetized by intraperitoneal administration of ketamine and xylazine (Ketaminol® and Rompun®, respectively) and inoculated with 5 × 10⁵ C26 cells in 100 μl of PBS (tumour‐bearing mice) or with an equal volume of vehicle (PBS) only (CTRL) into the intrascapular subcutis.
The production of soluble ACVR2B
The ectodomain of ACVR2B was fused with an IgG1 Fc domain and the fusion protein was expressed in house in Chinese hamster ovary cells grown in a suspension culture as explained earlier in detail.30 The protein is similar but not identical to that originally generated by Lee and colleagues.12
Home cage physical activity
Home cage physical activity was recorded by our validated force plate system as previously described31, 32 at baseline and on Day 10 after C26 cell inoculation (22 h recording). The mice were housed in pairs and the activity index of each cage reflects the total locomotive activity in all directions (y, x, and z axes) of the two mice housing the same cage (from the same experimental group).
Tissue collection
At the end of each experiment, the mice were anaesthetized by an intraperitoneal injection of ketamine and xylazine (Ketaminol® and Rompun®, respectively) and euthanized by cardiac puncture followed by cervical dislocation. A sample of the collected blood was taken to EDTA tubes for the analysis of basic haematology. The rest of the blood was collected in serum collection tubes, and centrifuged at 2000 g for 10 min (Biofuge 13, Heraeus). The diaphragm, the heart, tibialis anterior (TA), and gastrocnemius muscles, as well as the liver, the spleen, epididymal fat pads, and the tumour were rapidly excised, weighed, and snap‐frozen in liquid nitrogen. The right TA and a sample of the spleen were embedded in Tissue‐Tek® O.C.T. compound and snap‐frozen in isopentane cooled with liquid nitrogen. All tissue masses were normalized to the length of the tibia (TL, mm), which was unaltered by the tumour or the continued sACVR2B‐Fc treatment, but slightly increased in the C26 + sACVR/b group as compared to C26 + PBS (Online Resource 3: Figure S2).
Muscle protein synthesis: in vivo surface sensing of translation
Muscle protein synthesis was analysed using surface sensing of translation method33, 34 as earlier in our laboratory.15, 30, 35 Briefly, on Day 11 after C26 cell inoculation, mice were anaesthetized and subsequently injected i.p. with 0.040 μmol/g puromycin (Calbiochem, Darmstadt, Germany) dissolved in 200 μl of PBS. At exactly 25 min after puromycin administration, mice were euthanized by cardiac puncture followed by cervical dislocation. The left TA muscle and the heart, the diaphragm, as well as a sample of the median lobe of the liver were isolated, weighed and snap‐frozen in liquid nitrogen at exactly 30, 35, and 40 min, respectively, after puromycin administration.
Basic haematology
Basic haematology was analysed from whole blood (EDTA) samples diluted 1:25 in saline solution with an automated haematology analyser (Sysmex XP 300 analyzator Sysmex Inc, Kobe, Japan). For the analysis of the platelet count, whole blood was diluted 1:250 due to high platelet counts in the samples.
Multiplex cytokine assay
A multiplex cytokine assay (Q‐Plex Array 16‐plex ELISA, Quansys Biosciences, Logan, Utah, USA) was performed in accordance with manufacturer's instructions from 25 μl of serum at 11 days post cancer cell inoculation.
RNA extraction, cDNA synthesis, and quantitative real‐time PCR
Total RNA was extracted from tumour, gastrocnemius, and spleen samples using QIAzol and purified with RNeasy Universal Plus kit (Qiagen) according to manufacturer's instructions resulting in high quality RNA. RNA was reverse transcribed to complementary DNA (cDNA) with iScriptTM Advanced cDNA Synthesis Kit (Bio‐Rad Laboratories) following kit instructions. Real‐time qPCR was performed according to standard procedures using iQ SYBR Supermix (Bio‐Rad Laboratories) and CFX96 Real‐Time PCR Detection System combined with CFX Manager software (Bio‐Rad Laboratories). Data analysis was carried out by using efficiency corrected ΔΔCt method. Based on the lowest variation between and within the groups of the potential housekeeping genes (Rn18S, Gapdh, 36b4, or Tbp), Tbp was selected for the spleen whereas 36b4 was chosen for the tumour and the muscle. Primers used are listed in Online Resource 2: Supplementary methods (Table S1).
Protein extraction and content
Tibialis anterior (TA), diaphragm, heart, and liver samples were homogenized in ice‐cold buffer with proper protease and phosphatase inhibitors and further treated as earlier30 with slight modifications. The samples were centrifuged at 500 g for 5 min at +4°C for the analysis of the protein synthesis, and at 10 000 g for 10 min at +4°C for other analyses. Total protein content was determined using the bicinchoninic acid protein assay (Pierce, Thermo Scientific) with an automated KoneLab device (Thermo Scientific).
Citrate synthase activity assay
Citrate synthase activity was measured from TA, diaphragm, and heart homogenates using a kit (Sigma‐Aldrich) with an automated KoneLab device (Thermo Scientific).
Western blotting
Western blot analysis was performed as previously described.15, 30, 36 Briefly, tissue homogenates containing 30 μg of protein were solubilized in Laemmli sample buffer and heated at 95°C (except at 50°C for the analysis of OXPHOS proteins) to denature proteins, separated by SDS‐PAGE and then transferred to PVDF membrane followed by overnight probing with primary antibodies at +4°C. Proteins were visualized by enhanced chemiluminescence using a ChemiDoc XRS device and quantified with Quantity One software version 4.6.3 (Bio‐Rad Laboratories, Hercules, California, USA). In the case of the analysis of puromycin‐incorporated proteins and ubiquitinated proteins, the intensity of the whole lane was quantified. Ponceau S staining and GAPDH were used as loading controls and all the protein level results were normalized to the mean of Ponceau S and GAPDH. Antibodies used are listed in Online Resource 2: Supplementary methods.
Histology and immunohistochemistry
For histological analysis, 10 μm thick frozen sections were cut from O.C.T.‐embedded (Tissue‐Tek) TA and spleen samples. Antibodies used in the immunofluorescence analyses are listed in Online Resource 2: Supplementary methods.
For mechanistic target of rapamycin (mTOR)‐LAMP2 colocalization analysis, TA sections were air‐dried and fixed in −20°C acetone for 10 min. After PBS washes, sections were blocked with 5% goat serum and 0.3% CHAPS in PBS for 1 h, washed with PBS, and incubated overnight at +4°C with primary antibodies against mTOR, dystrophin, and LAMP2 diluted in PBS containing 0.5% BSA and 0.3% CHAPS. After PBS washes, sections were incubated with secondary antibodies (Goat anti‐rabbit Alexa Fluor 555, Goat anti‐mouse Alexa Fluor 405 and Goat anti‐rat Alexa Fluor 488) for 1 h at room temperature, washed and mounted.
Spleen sections were stained using haematoxylin and eosin for basic histology. For immunofluorescence staining, frozen sections were air‐dried for 15 min and fixed with 4% PFA for 10 min, followed by washes with PBS. The sections were blocked with 5% goat serum in PBS for 1 h, washed with PBS, and incubated with primary antibodies against LY‐6G and LY‐6C (GR‐1) or CD11b diluted in 0.5% BSA in PBS at +4°C overnight. After washing, the sections were incubated with Alexa fluorochrome conjugated secondary antibody (Goat anti‐rat Alexa Fluor 488) diluted in 5% goat serum in PBS for 1 h.
The samples were mounted with Mowiol‐DABCO. Fluorescently labelled samples were imaged using Zeiss LSM 700 confocal microscope and analysed from 10 images (mTOR‐LAMP2) or from 6–11 images (CD11b and GR‐1) in each sample using ImageJ. The colocalization of mTOR with LAMP2 was analysed according to Costes et al.37 using the Colocalization Threshold plugin. All the steps were performed blinded to the sample identification.
Statistical analyses
Differences in survival were analysed with the Kaplan–Meier method [log‐rank (Mantel‐Cox) test]. Cox regression analysis was used to determine factors predicting survival. The C26 cancer effect (CTRL vs. C26 + PBS or CTRL vs. C26 groups pooled) was examined with Student's t‐test or non‐parametric Mann–Whitney U test, and the effect of sACVR2B‐Fc in the tumour‐bearing groups with one‐way analysis of variance or Kruskall–Wallis test followed by Holm–Bonferroni corrected LSD or Mann–Whitney U post hoc tests, respectively, when appropriate. Pearson correlation coefficient was used to analyse correlations. Statistical significance was set at P < 0.05. All values are presented as means ± SEM unless otherwise stated.
Results
Blocking activin receptor type 2B ligands improves survival of C26 tumour‐bearing mice
Mice treated with sACVR2B started to gain body mass soon after the beginning of the treatment (Online Resource 3: Figure S2). The body mass of the tumour‐bearing mice started to decrease after C26 cell inoculation. There was no significant difference in the survival time between C26 + PBS and C26 + sACVR/b groups (Figure 2A). However, the survival was significantly improved when sACVR2B‐Fc administration was continued also after tumour formation (Figure 2A).
Figure 2.
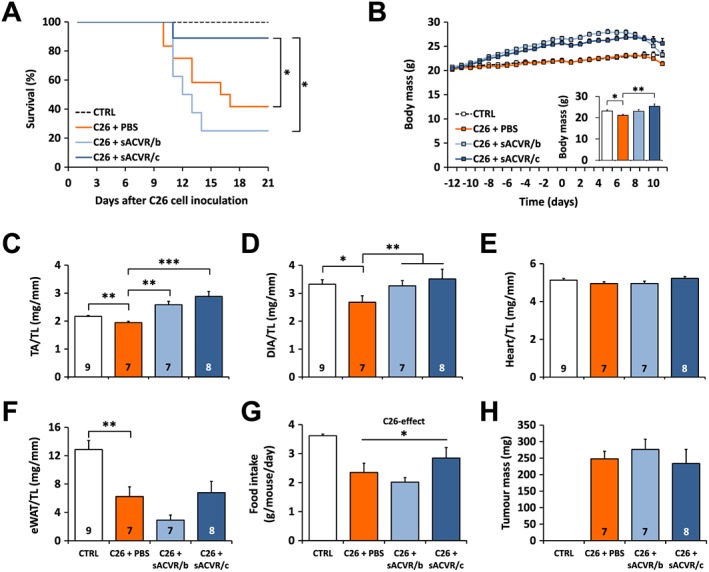
The effects of sACVR2B‐Fc administration on survival, tissue masses and food intake in C26 cancer cachexia. (A) A 3‐week Kaplan–Meier survival curve (log‐rank (Mantel‐Cox) test). N = 6, 12, 8, and 9 in CTRL, C26 + PBS, C26 + sACVR/b, and C26 + sACVR/c, respectively. (B) Body mass and the final tumour‐free body mass, in the short‐term experiment. There was a significant time × group interaction (P = 0.006, repeated measures ANOVA). Masses of (C) tibialis anterior (TA), (D) diaphragm (DIA), (E) the heart, and (F) epididymal white adipose tissue (eWAT) normalized to the length of the tibia in mm (TL) at 11 days after C26 cell inoculation. (G) Average food intake during Days 8–10 of the short term experiment, in which N = 3–4 cages/group, 2 mice/cage. (H) Tumour mass on Day 11 after C26 cell inoculation. *, ** and *** = P < 0.05, 0.01 and 0.001, respectively. CTRL vs. C26 + PBS difference was analysed by Student's t‐test (B–G), and differences between the C26‐groups with one‐way ANOVA with Holm–Bonferroni corrected LSD (B–H). Lines without vertical ends show a pooled effect: (D) sACVR2B‐Fc combined and (G) C26‐groups combined. N‐sizes are depicted in the bar graphs.
To study the potential mechanisms underlying the improved survival with only the continued sACVR2B‐Fc administration, another experiment was conducted. Associations between the body mass change and survival time were analysed with Cox regression analysis, which revealed that especially the body weight change from Day 10 to Day 11 after cancer cell inoculation predicted survival (B = 1.82, P < 0.001). Thus, Day 11 was determined as the end‐point for the second experiment to target the early phase of cachexia. At this time point, vehicle treated tumour‐bearing mice exhibited cachexia manifested by significantly decreased body mass accompanied by lower TA, diaphragm, and adipose tissue mass compared with healthy controls (Figure 2B–F, Body mass in Online Resource 3: Figure S2). Both sACVR2B‐Fc administered groups had significantly greater TA masses compared with vehicle treated tumour‐bearing controls, and similar trend was also apparent in diaphragm (Figure 2C and 2D). sACVR2B‐Fc administration had no effect on adipose tissue mass when compared to the PBS‐treated mice, but discontinuation of the treatment seemed to result in more prominent fat wasting compared with the continued treatment (ns) (Figure 2F). Increased fat wasting together with non‐significantly smaller muscle masses compared with continued treatment protocol probably explains why body mass had started to decrease especially rapidly in C26 + sACVR/b group. Heart mass was unaffected by the tumour and the sACVR2B‐Fc administration at this time point (Figure 2E), although mild cardiac cachexia was observed in our pilot study at 2 weeks after cancer cell inoculation (Online Resource 1: Figure S1). During the last days of the experiment, all tumour‐bearing groups had reduced food intake compared to healthy controls (Figure 2G).
Administration of sACVR2B‐Fc had no effect on tumour mass (Figure 2H). To find out if the mRNA expression of the potential cachexia‐inducing factors was nonetheless modulated by sACVR2B‐Fc administration, gene expressions were analysed from the tumours. Consistent with no effects on tumour mass, sACVR2B‐Fc administration had no major effect on tumour Activin A (Inhibin βA) mRNA expression, but it increased Il‐6 mRNA expression independent of the treatment protocol (Online Resource 3: Figure S2). In the gastrocnemius muscles of the tumour‐bearing mice, the mRNA expression of Activin A slightly, but significantly decreased while Il‐6 strongly increased and Myostatin (Gdf8) tended to increase without an effect of the treatment (Online Resource 3: Figure S2).
Muscle protein synthesis and mTOR signalling are decreased in C26 cancer cachexia alongside reduced mTOR localization to lysosomes/late‐endosomes
To clarify the mechanisms underlying C26 cancer‐induced muscle atrophy, muscle protein synthesis was analysed from TA, diaphragm, and the heart. Tumour‐bearing mice had markedly blunted protein synthesis in all of these tissues and especially in TA, whereas sACVR2B‐Fc administration had no effect (Figure 3A). The mTOR, a regulator of protein synthesis, is at least in part regulated by its subcellular localization: localization to the lysosomal/late‐endosome membrane is associated with mTOR activation.38, 39 To analyse whether decreased muscle protein synthesis was associated with altered mTOR localization, TA cross‐sections were labelled with antibodies against mTOR and a lysosome/late‐endosome marker LAMP2. The results demonstrate that colocalization of mTOR with LAMP2 was decreased in the tumour‐bearing mice compared with the control group and restored by continued sACVR2B‐Fc administration (Figure 3B), reflecting the levels of phosphorylation of ribosomal protein S6, a marker of mTOR signalling (Figure 3C). Also the phosphorylation of S6 kinase 1 at Thr389 was decreased in the tumour‐bearing mice without consistent restoration by the continued sACVR2B‐Fc treatment (Online Resource 4: Figure S3). The total amount of mTOR analysed with western blotting was similar between the groups (data not shown). Interestingly, mTOR colocalization with LAMP2 correlated well with muscle protein synthesis (r = 0.751; P < 0.01, Figure 3D) and the body mass change of the last day (r = 0.630; P < 0.01) in the untreated mice.
Figure 3.
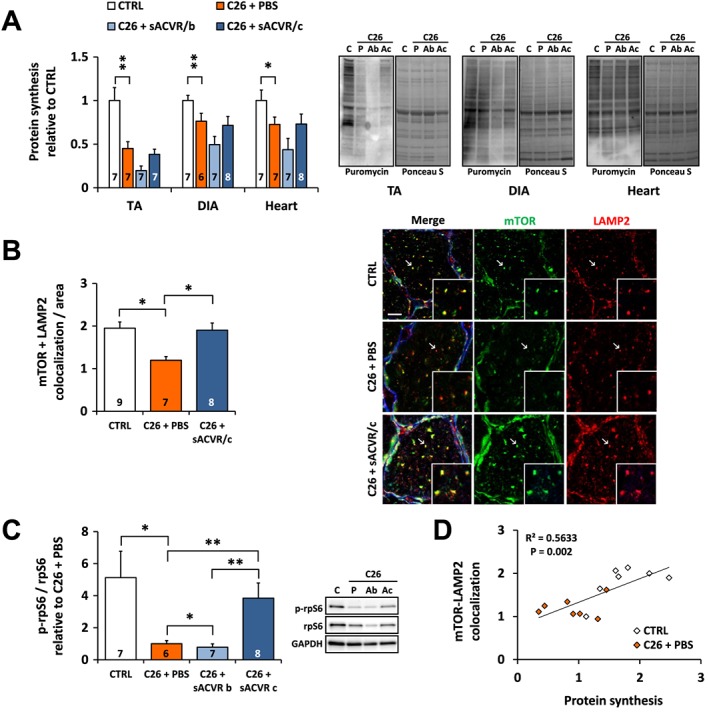
Decreased protein synthesis is associated with altered mTOR localization in the tumour‐bearing mice at 11 days after C26 cell inoculation. (A) Protein synthesis analysed by SUnSET in TA, diaphragm (DIA) and the heart (left) and the representative blots (right, C = CTRL, P = C26 + PBS, Ab = C26 + sACVR/b, Ac = C26 + sACVR/c). (B) Quantification of mTOR‐LAMP2 colocalization in TA and the representative images (scale bar = 10 μm). Membranes were excluded from the analysis, but this did not have major impact on the results (data not shown). (C) Phosphorylation of rpS6 on Ser240/244 in TA (left) and the representative blots (right). (D) Correlation between mTOR‐LAMP2 colocalization and protein synthesis in CTRL and C26 + PBS groups (Pearson correlation coefficient). * and ** = P < 0.05 and 0.01, respectively. Kruskall–Wallis with Holm–Bonferroni corrected Mann–Whitney U (A, C); Student's t‐test (B, C26‐ and sACVR2B‐Fc‐effects). Lines without vertical ends show a pooled effect of all C26‐groups combined. N‐sizes are depicted in the bar graphs.
C26 cancer cachexia is associated with elevated content of ubiquitinated proteins in skeletal muscle
The content of ubiquitinated proteins was slightly but significantly increased in TA and diaphragm of the tumour‐bearing mice (Online Resource 4: Figure S3). In line with this result, the mRNA expression of the major muscle‐specific E3 ubiquitin ligases Murf1 and Atrogin1 was markedly increased in the tumour‐bearing mice, similar trend being observed also in recently characterized muscle ubiquitin ligase of the SCF complex in atrophy‐1 (Musa1)40 (Online Resource 4: Figure S3). sACVR2B‐Fc administration did not have significant effects on the markers of ubiquitin–proteasome system (Online Resource 4: Figure S3). Other protein degradation pathways may also contribute to muscle atrophy in tumour‐bearing mice. Indeed, our data suggests potentially increased autophagy in tumour‐bearing mice (Hentilä et al. unpublished observations).
Reduced physical activity in C26 cancer cachexia is not rescued by soluble ACVR2B and is associated with minor alterations in skeletal muscle oxidative properties
Home cage physical activity of the mice was recorded at baseline and on Day 10 after the injection of cancer cells or vehicle control. On Day 10, the tumour‐bearing mice were significantly less active compared with the control mice, and sACVR2B‐Fc administration had no effect on the level of physical activity (Figure 4A). Reduced physical activity was accompanied by minor decreases in citrate synthase activity, but not in the markers of mitochondrial content in skeletal muscle and the heart of the tumour‐bearing mice compared with healthy controls (Figure 4B–E, Online Resource 5: Figure S4). However, OXPHOS complex IV subunit 1 (MTCO1) was increased in tumour‐bearing mice in both skeletal muscle and the heart (Figure 4D and 4E; Online Resource 5: Figure S4).
Figure 4.
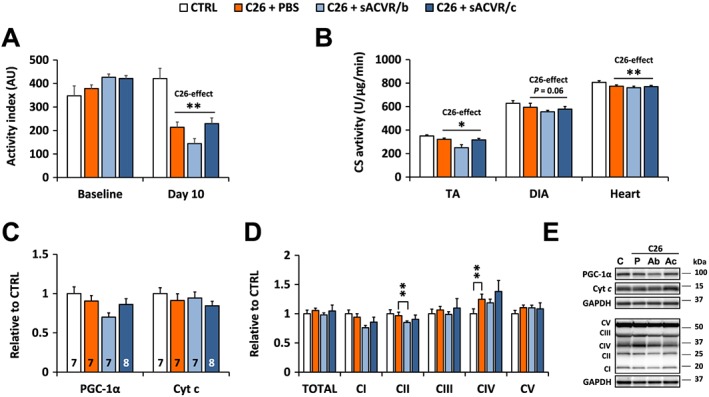
Home cage physical activity and muscle oxidative properties at early phase of C26 cancer cachexia. (A) Activity indexes (AU) at baseline and at Day 10 after C26 cell injection. N = 2–3 cages/group, 2 mice/cage. This result was replicated in the second short‐term experiment (data not shown). (B) Citrate synthase activities in TA, diaphragm, and the heart on Day 11 after C26 cell injection. (C) PGC‐1α and cytochrome (Cyt) c, and (D) mitochondrial OXPHOS protein content in TA on Day 11 after C26 cell inoculation. (E) Representative blots. * and ** = P < 0.05 and 0.01, respectively. C26‐effect was analysed by Student's t‐test (A, B), and group differences by Kruskall–Wallis with Holm–Bonferroni corrected Mann–Whitney U (C, D). N = 7–9/group.
Increased circulating levels of pro‐inflammatory cytokines are not affected by blocking activin receptor ligands
To investigate the possible effects of C26 cancer and sACVR2B‐Fc administration on circulating cytokines, a multiplex assay was conducted. Of the 16 cytokines analysed, the levels of pro‐inflammatory IL‐6 and monocyte chemoattractant protein (MCP‐1), also known as Chemokine (C‐C motif) ligand 2 (CCL2), were highly elevated (P < 0.001) in the sera of the C26 mice while chemokine RANTES (CCL5) was decreased from already low values of the healthy mice (Online Resource 6: Table S2). The sACVR2B treatment did not have any effect on IL‐6 (P = 0.67) or on RANTES (P = 0.89), while it even further increased MCP‐1 (P = 0.042), when the treatment was continued (Online Resource 6: Table S2). The treatment with sACVR2B‐Fc also resulted in slightly elevated serum IL‐1β (P < 0.05) independent of the treatment protocol, but its levels were very close to the detection limit in most of the samples (Online Resource 6: Table S2).
Increased hepatic protein synthesis and acute phase response in tumour‐bearing mice are partially blocked by soluble ACVR2B
Liver mass was unaltered by C26 tumour and the treatments (Figure 5A). However, C26 tumour‐bearing mice had significantly increased liver protein synthesis (Figure 5B) supported by increased phosphorylation of ribosomal protein S6, a marker of mTOR signalling (Figure 5C). This cancer effect was attenuated by sACVR2B‐Fc administration independent of the treatment protocol (Figure 5B and 5C). Administration of sACVR2B‐Fc alone in healthy mice did not affect liver protein synthesis as analysed from our previous experiment30 (data not shown).
Figure 5.
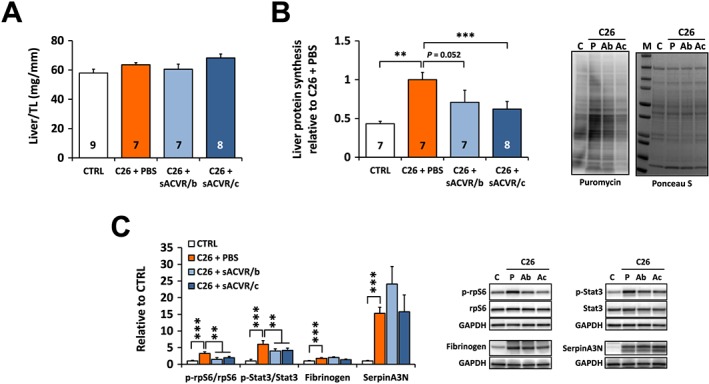
Liver mass, protein synthesis and markers of acute phase response on Day 11 after C26 cell injection. (A) Liver mass normalized to the length of the tibia (TL). (B) Liver protein synthesis (left) and representative blots (right). (C) Phosphorylation of rpS6 on Ser240/244 and Stat3 on Tyr705, and protein contents of fibrinogen and serpinA3N in liver (left) and the representative blots (right). N = 6–9/group. ** and *** = P < 0.01 and 0.001, respectively. Student's t‐test and one‐way ANOVA with Holm–Bonferroni corrected LSD (A), Kruskall–Wallis with Holm–Bonferroni corrected Mann–Whitney U (B, C). Lines without vertical ends in (C) show a pooled effect of both sACVR2B‐Fc groups combined. N‐sizes are depicted in the bar graphs.
In line with increased protein synthesis, the C26 tumour‐bearing mice had increased levels of fibrinogen and serpinA3N compared to healthy controls together with the increased phosphorylation of Stat3 indicating activation of APR (Figure 5C). Increased Stat3 phosphorylation was partially attenuated by sACVR2B‐Fc administration (Figure 5C). The protein contents of fibrinogen and serpinA3N correlated with the body mass loss during the last day in the tumour‐bearing mice (r = −0.659, P = 0.001, and r = −0.845, P < 0.001, respectively).
C26 cancer associated splenomegaly is partially prevented by soluble ACVR2B independent of splenic myeloid‐derived suppressor cells
C26 tumour‐bearing mice treated with PBS had significantly (over 2.5‐fold) increased spleen mass compared with healthy control mice, which was partially prevented by sACVR2B‐Fc administration independent of the treatment protocol (Figure 6A). We replicated the experiment with all groups except the discontinued sACVR2B‐Fc treatment and showed again the same effects (Online Resource 7: Figure S5). Analysis of the spleen histology from this experiment revealed well‐organized and clear red and white pulp areas in the control mice whereas in the tumour‐bearing mice, moderate structural disorganization of the white pulp areas occurred, especially in sACVR2B treated mice (Figure 6B). To identify possible myeloid‐derived suppressor cell (MDSC) expansion, spleen tissue was more specifically labelled with antibodies against GR‐1 (LY‐6C/G) and CD11b and the expression of typical MDSC marker genes was analysed by qPCR.42 The density of CD11b positive cells (count/area) was increased in the C26 tumour‐bearing mice compared with the control mice without changes in the density of GR‐1 (LY‐6C/G) positive cells (Figure 6C). As spleen size was increased in the tumour‐bearing mice, counts/area were multiplied by the spleen mass to get an idea of the total abundance of CD11b and GR‐1 (LY‐6C/G) positive cells. This analysis showed a more pronounced increase in both CD11b and GR‐1 (LY‐6C/G) positive cells in the tumour‐bearing mice (Online Resource 7: Figure S5).
Figure 6.
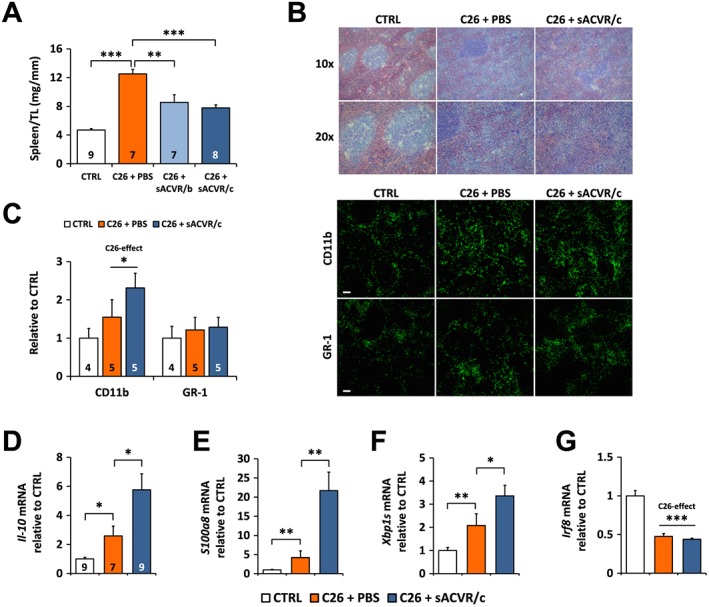
Administration of sACVR2B‐Fc attenuates C26 cancer‐induced splenomegaly independent of splenic MDSCs. (A) Spleen mass normalized to the length of the tibia (TL) on Day 11 after C26 cell injection. (B) Haematoxylin and eosin staining of the spleen on Day 13 after C26 cell injection. (C) CD11b and GR‐1 (LY‐6C/G) count in spleen on Day 13 after C26 cell injection and representative immunofluorescence images. Scale bar = 100 μm. The mRNA expression of MDSC markers (D) interleukin‐10 (Il‐10, (E) S100 calcium binding protein A8 (S100a8), and (F) the splice variant of X‐box Binding Protein 1 (Xbp1s) as well as (G) Interferon Regulatory Factor 8 (Irf8), a negative regulator of MDSCs,41 on Day 13 after C26 cell injection. *, **, and *** = P < 0.05, 0.01, and 0.001, respectively. Student's t‐test and one‐way ANOVA with Holm–Bonferroni corrected LSD (A, C, D), Mann–Whitney U (E–G). Lines without vertical ends show a pooled effect of all C26‐groups combined. N‐sizes are depicted in the bar graphs. N = 7–9/group in (E–G).
The expression of genes previously related to presence and development of MDSCs42 was increased in the tumour‐bearing mice, and this effect was even more pronounced in the sACVR2B‐Fc treated mice (Figure 6D–G). These results suggest an increased abundance of splenic MDSCs in the tumour‐bearing mice, and this effect is even accentuated by sACVR2B administration. Thus, changes in MDSCs do not explain the effect of sACVR2B‐Fc on the spleen mass, and the cell population responsible for this effect is still to be identified. Nevertheless, as a possible mechanism, sACVR2B‐Fc treated group showed increased mRNA expression of Cyclin Dependent Kinase Inhibitor 1A (Cdkn1a/p21), an inhibitor of proliferation (Online Resource 7: Figure S5).
Activin receptor ligand blocking reverses the mild anaemia observed in tumour‐bearing mice
In the tumour‐bearing mice, red blood cell count, haemoglobin, and haematocrit were slightly, but significantly decreased (Figure 7A–C). All of these parameters were at least partially restored by sACVR2B‐Fc administration (Figure 7A–C). In contrast, platelet count was robustly augmented in the tumour‐bearing mice independent of sACVR2B‐Fc administration (Figure 7D). White blood cell count tended to increase by continued sACVR2B‐Fc administration (Figure 7E).
Figure 7.
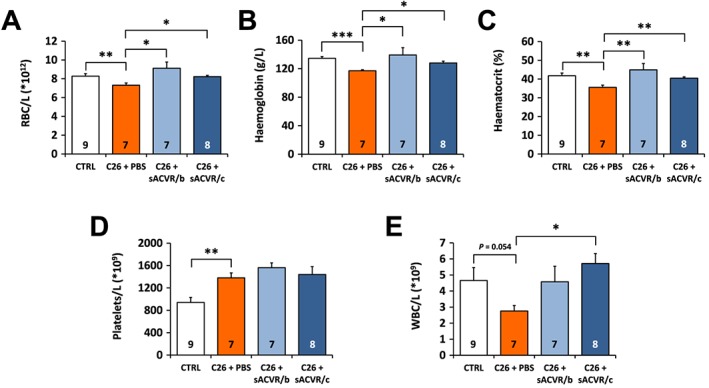
Haematological parameters in C26 tumour‐bearing mice and the effects of sACVR2B‐Fc. (A) Red blood cell count (RBC), (B) haemoglobin, (C) haematocrit, (D) platelet count, and (E) white blood cell count (WBC) on Day 11 after C26 cell injection. *, **, and *** = P < 0.05, 0.01 and 0.001, respectively. Kruskall–Wallis with Holm–Bonferroni corrected Mann–Whitney U (A–C) or Student's t‐test and one‐way ANOVA with Holm–Bonferroni corrected LSD (D, E). N‐sizes are depicted in the bar graphs. These results were replicated in the second short‐term experiment (data not shown).
Discussion
In the present study, we show that preventing cachexia by continued blocking of ACVR2B ligands improved survival in tumour‐bearing mice without affecting primary tumour growth similarly as earlier.9, 14, 16 These findings together with results from treatments affecting other pathways19, 20, 21, 22 as well as epidemiological evidence in humans2 have led to suggestions for a possible causal link between preservation of muscle mass and improved survival.4 This hypothesis is in part supported by the present study showing that increasing muscle mass and maintaining it by continued blocking of ACVR2B ligands improves survival. In comparison, the discontinuation of the treatment before the tumour formation led to a systematically worse outcome and also shorter survival. This may be due to the fact that the discontinuation of the treatment may in itself have adverse effects on the host or because larger muscles at the onset of the disease may result in more robust cachexia, as shown earlier.43 Nevertheless, if the preservation of muscle per se indeed improved survival, the exact mechanisms still remain unresolved. It is possible, for instance, that the preservation of some specific vital muscles, such as the major respiratory muscles,44, 45 is paramount rather than muscle tissue in general. Indeed, diaphragm atrophy and weakness accompanied by ventilatory dysfunction have been reported in C26 tumour‐bearing mice.46, 47 Interestingly, ACVR2 ligand blocking restored diaphragm mass in the present study, which may at least in part have explained the prolonged survival of these mice, although the differences between the treatment protocols were quite marginal at the time point investigated.
In addition to skeletal muscles, cardiac cachexia and associated pathological changes such as arrhythmias may be linked to survival in cancer cachexia.48, 49 In our hands, however, the C26 tumour burden resulted in only mild cardiac cachexia and sACVR2B treatment did not affect heart size, similarly as earlier.35 This differs from the results of Zhou et al. who reported significant cardiac atrophy which was fully reversed by sACVR2B. This may be explained by more severe cachexia that was treated with higher doses of sACVR2B‐Fc.9 However, we have recently demonstrated that sACVR2B‐Fc has markedly smaller effects on cardiac than skeletal muscle in chemotherapy‐induced cachexia model.35 Future studies should better elucidate the effects of blocking ACVR2 ligands on the heart and the importance of cardiac cachexia on cancer prognosis.
Liver acute phase response (APR) has been associated with impaired survival in cancer cachexia in humans.26 It is an early‐defence system driven by cytokines such as IL‐6, which induces Stat3 activation and consequently increased expression of acute phase proteins.26, 50 We showed induced hepatic APR in tumour‐bearing mice supporting previous findings.25 Also the liver protein synthesis was increased in the tumour‐bearing mice, a finding that is consistent with an earlier study with C26 cancer,51 and also with human cancer cachexia, assuming that increased synthesis of circulating fibrinogen reflects mainly increased liver protein synthesis.52 Increased liver protein synthesis in tumour‐bearing mice may reflect increased synthesis of exported APR proteins, because no significant changes in liver mass were observed in any of the experiments. Both ACVR2 ligand blocking protocols reduced the increased protein synthesis and Stat3 phosphorylation again without an effect on liver mass. Although no differences in these results were observed between the two treated groups, the discontinued sACVR2B‐Fc treatment was associated with much worse prognosis perhaps arguing against these hepatic changes being important for the survival benefit of continued ACVR2 ligand blocking. Interestingly, however, the level of hepatic APR proteins correlated with body mass loss suggesting that the importance of these pathways should be further investigated in the future as well as the mechanisms of blocking ACVR2 ligands on liver protein synthesis in cancer.
Pro‐inflammatory cytokines are thought to be important for the development of cancer cachexia53 and on its prognosis.27, 54 Of multiple cytokines analysed, IL‐6 and MCP‐1 were strongly elevated in the sera of the C26 tumour‐bearing mice, which is in agreement with previous findings in the same experimental model.9, 20 In humans, high levels of MCP‐127 and IL‐654 have been related to shorter survival time in pancreatic ductal adenocarcinoma and lung cancer, respectively. Recently, elevated MCP‐1 was associated with cachexia in treatment naïve pancreatic cancer patients.55 However, in the present study, these responses were not attenuated by the sACVR2B treatment suggesting that continued blocking of ACVR2B pathway enhances survival and prevents muscle loss independent of the elevated circulating pro‐inflammatory cytokines similarly as suggested by Zhou et al. based on IL‐6, IL‐1β, and TNF‐α.9 Continued sACVR2B‐Fc treatment even increased serum MCP‐1 and IL‐1β, but the mechanism and physiological importance of this effect is unknown and further studies are needed. We also analysed sera from the survival experiment at the day of euthanasia (n = 4–5 per group), where MCP‐1 was even further elevated in the C26 + sACVR/c group of mice. This may be due to prolonged survival and thus more advanced disease at euthanasia (data not shown).
Interestingly, increased spleen size (splenomegaly) typically observed in experimental cancer,28, 56, 57 was attenuated in sACVR2B‐Fc treated mice. In addition, expansion of splenic MDSCs has previously been associated with potential effects on cachexia development and survival.28 Interestingly, although the increase in spleen size was prevented, the markers of MDSCs in spleen were not decreased with ACVR2 ligand blocking. Moreover, the increase in spleen size was prevented by sACVR2B‐Fc treatment independent of the treatment protocol suggesting that spleen may not play a major role in enhanced survival with the continued ACVR2 ligand blocking. Nevertheless, an overall reduction in red pulp area by sACVR2B was recently observed in an animal model of β‐thalassemia intermedia, and this was associated with alleviation of anaemia and splenomegaly.58 We found that the white pulp areas were clearly visible in healthy control mice, whereas in the tumour‐bearing mice, these areas were disorganized, and this tended to occur especially in sACVR2B treated mice. We also found changes in basic haematological parameters such as decreased blood haemoglobin and haematocrit in C26 tumour‐bearing mice, which is in line with previous studies,59 and those were reversed in the sACVR2B treated mice. Importantly, however, these factors did not differ between the treated groups, at least at this time point where the loss of body mass had already started with the discontinued treatment, suggesting that the attenuation of anaemia unlikely results in improved survival with continued ACVR2 ligand blocking. However, the effect of preventing anaemia per se may have other benefits as erythropoietin can improve health in C26 tumour‐bearing mice.24, 60
Physical activity has been shown to be beneficial for health and also for cancer incidence and potentially for tumour host survival.61, 62 Our results showed that tumour‐bearing mice were less active than healthy controls supporting earlier evidence of decreased physical activity in tumour‐bearing mice.16, 59, 63 Decreased physical activity was not due to muscle wasting per se as preventing muscle wasting by blocking ACVR2 ligands did not prevent the decrease in physical activity. Our results also argue against physical activity being an important factor for improved survival with continued sACVR2B‐Fc treatment. Similar results of the effects of sACVR2B treatment on physical activity have been reported earlier in LLC tumour‐bearing mice.16 The reduction in physical activity was associated with only minor changes in some of the mitochondrial markers in skeletal muscle and the heart.
Similarly to Zhou et al.,9 we report that sACVR2B‐Fc did not affect C26 tumour mass showing that C26 tumour growth is not regulated by ACVR2 ligands. We extended this finding by showing that the gene expression of Activin A and Il‐6, which are important proteins in cachexia,8 were not reduced by sACVR2B‐Fc further showing that sACVR2B‐Fc improved survival in this experimental model of cancer without marked effects on the tumour. However, the circulating ACVR2 ligands may also be directly or indirectly related to the cancer prognosis at least in part independent of cachexia. High circulating Activin A levels predict poor prognosis in colorectal and lung cancer patients.10, 64 This may be explained by increased Activin A levels reflecting the severity or the extent of the cancer or cachexia. However, also direct effects of Activin A,65, 66 and perhaps of other ACVR2 ligands, on non‐muscle tissues may also affect survival in cancer cachexia, and thus more studies are needed to further investigate this phenomenon.
Muscle wasting in cancer cachexia can be attributed to decreased protein synthesis,5, 6 impaired regeneration7 as well as increased protein degradation6 in skeletal muscle. At the time point in which body mass loss started to accelerate and predicted survival, increased mRNA expression of muscle specific E3 ubiquitin ligases and the content of ubiquitinated proteins were observed, suggesting increased protein degradation via the ubiquitin‐proteasome system. At the same time, robustly decreased muscle protein synthesis in TA, diaphragm, and the heart of the tumour‐bearing mice was observed. In the present study, as predicted from decreased mTOR signalling activity, mTOR colocalization with the lysosomes/late‐endosomes was decreased in skeletal muscles of C26 tumour‐bearing mice. Interestingly, our correlation data suggests that this novel finding may explain at least in part the cachexia and decreased muscle protein synthesis in the untreated tumour‐bearing mice. Targeting of mTOR to lysosomes/late‐endosomes has previously been shown to be sufficient to activate mTOR signalling while mTOR inactivation by, e.g. amino acid starvation is associated with mTOR dissociation from lysosomes/late‐endosomes.38, 39 Even though continued sACVR2B‐Fc administration had no effect on protein synthesis at this time point, it was able to partially restore S6 phosphorylation and the colocalization of mTOR with the lysosomes/late‐endosomes. The reason for this discordance is unknown, but may be due to decreased food intake or simply the refractory nature of cancer cachexia at this time point in most of the animals.67 Indeed, the increased skeletal muscle masses with ACVR2B ligand blocking are probably due to earlier changes in protein synthesis and/or degradation, as we have previously reported increased protein synthesis with ACVR2B ligand blocking in healthy and chemotherapy receiving mice.15, 30
In conclusion, we showed that increased muscle size with ACVR2 ligand blocking was associated with improved survival in C26 tumour‐bearing mice only when the treatment was continued after the tumour formation. The prolonged survival could potentially be attributed in part to maintenance of muscle mass and, in theory, the respiratory muscle mass. However, more specific strategies in preventing total and specific loss of muscle (limb, respiratory, and heart) without possible non‐muscle effects should be investigated in the future. Moreover, our results suggest that circulating pro‐inflammatory cytokines, physical activity, or altered hepatic and splenic physiology may not be determining factors for improved survival with activin receptor ligand blocking. In addition, our novel result of decreased muscle protein synthesis and mTOR localization with lysosomes/late endosomes opens up possible future research questions and treatment options for cachexia.
Conflict of interest
Tuuli A. Nissinen, Jaakko Hentilä, Fabio Penna, Anita Lampinen, Juulia H. Lautaoja, Vasco Fachada, Tanja Holopainen, Olli Ritvos, Riikka Kivelä, and Juha J. Hulmi declare that they have no conflicts of interest.
Supporting information
Figure S1 C26 cancer decreases (a) body mass (time x group interaction P < 0.001) and masses of (b) tibialis anterior (TA), (c) gastrocnemius (GA), (d) heart and (e) epididymal fat (eWAT). TL = tibial length. C26 tumour expresses substantially higher levels of (f) Activin A, (g) Il‐6, and (h) Myostatin mRNA than LLC tumour. *, ** and *** = P < 0.05, P < 0.01 and P < 0.001, respectively. Students t‐test (a–e), Mann‐Whitney U (f–h). N‐sizes are depicted in the bar graphs, except in (a) where N = 8 per group. Data is presented as means ± SEM, except in (a), where data is presented as mean ± SD.
Supplementary Table S1 Primer information for qPCR analyses.
Figure S2 The effects of C26 cancer and sACVR2B‐Fc administration on body mass and tumour and muscle gene expression. (a) Length of the tibia on day 11 after C26 cell inoculation. (b) Body masses in the survival experiment. Tumour (c) Activin A (Inhibin βA) and (d) Il‐6 mRNA expression. Gastrocnemius (e) Activin A (Inhibin βA), (f) Il‐6 and (g) Myostatin (Gdf8) mRNA expression at day 11 after tumour inoculation. C26 cells were inoculated at day 0. mRNA‐results were normalized to 36b4 mRNA. FC = fold change. * and ** = P < 0.05, and P < 0.01, respectively. Student's t‐test and one‐way ANOVA with Holm‐Bonferroni corrected LSD (a, e–g). Kruskall‐Wallis with Holm‐Bonferroni corrected Mann‐Whitney U (c, d). N‐sizes are depicted in the bar graph except in (b) in which n = 6, 12, 8, and 9 in CTRL, C26 + PBS, C26 + sACVR/b, and C26 + sACVR/c, respectively.
Figure S3 (a) Phosphorylation of S6K1 at Thr389 was decreased in tumour‐bearing mice on day 11 after C26 cell inoculation. C26 cancer cachexia was associated with increased ubiquitinated proteins in (b) tibialis anterior and (c) diaphragm, and increased mRNA expression of ubiquitin ligases (d) Murf1, (e) Atrogin1 and (f) Musa1, which were not affected by sACVR2B‐Fc administration in gastrocnemius on day 11 after C26 cell inoculation. C = CTRL, P = C26 + PBS, Ab = C26 + sACVR/b, Ac = C26 + sACVR/c. FC = fold change. * and ** = P < 0.05 and P < 0.01, respectively. Kruskall‐Wallis with Holm‐Bonferroni corrected Mann‐Whitney U (a–e), Student's t‐test and one‐way ANOVA with Holm‐Bonferroni corrected LSD (f). N‐sizes are depicted in the bar graphs.
Figure S4 Mitochondrial markers in the heart on day 11 after C26 cell injection. (a) PGC‐1α and cytochrome c (Cyt c) protein levels were not altered by the C26 tumour or the sACVR2B‐Fc treatment in the heart. N‐sizes are depicted in the bar graphs. (b) OXPHOS complex IV (MTCO1) was significantly increased in the hearts of the vehicle treated tumour‐bearing mice (C26 + PBS). In addition, when all C26 tumour‐bearing groups were pooled, a significant increase was seen also in complexes CI (NDUFB8) and CIII (UQCRC2) as well as the sum of all complexes (total). This pooled C26‐effect is depicted by the lines without vertical ends. N = 7–9/group. C = CTRL, P = C26 + PBS, Ab = C26 + sACVR/b, Ac = C26 + sACVR/c. * and *** = P < 0.05 and P < 0.001, respectively (Mann‐Whitney U).
Supplementary Table S2 Serum cytokine levels at 11 days after C26 cell injection. N = 8, 7, 6 and 8 in CTRL, C26 + PBS, C26 + sACVR/b and C26 + sACVR/c groups, respectively. The values are presented in pg/ml. If over half of the values in the group were below or close to the detection limit, the concentration is not presented (depicted as N/A in the table). Cytokines with at least 3/4 of all values below or close to the detection limit are not shown (IL‐1a, IL‐2, IL‐3, IL‐4, IL‐10, IL‐17, IFNy, TNF‐α, MIP‐1a and GM‐CSF). In statistical analysis, the C26‐effect was analysed by pooling all the tumour‐bearing groups. The sACVR‐effect P‐value designates the lowest sACVR2B‐Fc P‐value in comparison to C26 + PBS and if the significance is found, the sACVR2B‐Fc group significantly different compared with C26 + PBS is indicated with *.
Figure S5 Effects of C26 tumour and sACVR2B‐Fc on the spleen on day 13 after C26 cell inoculation. (a) C26 cancer‐induced splenomegaly is attenuated by sACVR2B‐Fc administration. Splenic (b) CD11b and (c) GR‐1 contents were increased in C26 cancer when multiplied by spleen mass to reflect the total abundance of CD11b and GR‐1 positive cells. (d) sACVR2B‐Fc administration resulted in increased splenic Cdkn1a (p21) mRNA. * and ** = P < 0.05 and P < 0.01, respectively. C26 and sACVR2B‐Fc effects were analysed with Student's t‐test (a, b, d) or Mann‐Whitney U test (c). N‐sizes are depicted in the bar graphs.
Acknowledgements
This work was supported by the Academy of Finland [grant No. 275922 (JJH) and 297245 (RK)], Cancer Society of Finland (JJH), and Jenny and Antti Wihuri Foundation (TAN, RK). We also thank Dr Philippe Pierre for kindly providing the anti‐puromycin antibody. We acknowledge Arja Pasternack, Mika Silvennoinen, Maarit Lehti, Sanna Lensu, Sira Karvinen, Mervi Matero, Jouni Härkönen, Aila Ollikainen, Risto Puurtinen, Kaisa‐Leena Tulla, Eliisa Kiukkanen, Minna Savela, and Jouni Tukiainen for their valuable help and technical assistance.
The authors certify that they comply with the ethical guidelines for authorship and publishing of the Journal of Cachexia, Sarcopenia, and Muscle.68
Nissinen, T. A. , Hentilä, J. , Penna, F. , Lampinen, A. , Lautaoja, J. H. , Fachada, V. , Holopainen, T. , Ritvos, O. , Kivelä, R. , and Hulmi, J. J. (2018) Treating cachexia using soluble ACVR2B improves survival, alters mTOR localization, and attenuates liver and spleen responses. Journal of Cachexia, Sarcopenia and Muscle, 9: 514–529. doi: 10.1002/jcsm.12310.
Contributor Information
Tuuli A. Nissinen, Email: tuuli.a.m.nissinen@jyu.fi.
Juha J. Hulmi, Email: juha.hulmi@jyu.fi.
References
- 1. Fearon K, Arends J, Baracos V. Understanding the mechanisms and treatment options in cancer cachexia. Nat Rev Clin Oncol 2013;10:90–99. [DOI] [PubMed] [Google Scholar]
- 2. Kazemi‐Bajestani SM, Mazurak VC, Baracos V. Computed tomography‐defined muscle and fat wasting are associated with cancer clinical outcomes. Semin Cell Dev Biol 2015;54:2–10. [DOI] [PubMed] [Google Scholar]
- 3. Wolfe RR. The underappreciated role of muscle in health and disease. Am J Clin Nutr 2006;84:475–482. [DOI] [PubMed] [Google Scholar]
- 4. Lee SJ, Glass DJ. Treating cancer cachexia to treat cancer. Skelet Muscle 2011;1:2. [DOI] [PMC free article] [PubMed] [Google Scholar]
- 5. Horstman AM, Olde Damink SW, Schols AM, van Loon LJ. Is cancer cachexia attributed to impairments in basal or postprandial muscle protein metabolism? Forum Nutr 2016;8. [DOI] [PMC free article] [PubMed] [Google Scholar]
- 6. Smith KL, Tisdale MJ. Increased protein degradation and decreased protein synthesis in skeletal muscle during cancer cachexia. Br J Cancer 1993;67:680–685. [DOI] [PMC free article] [PubMed] [Google Scholar]
- 7. Talbert EE, Guttridge DC. Impaired regeneration:a role for the muscle microenvironment in cancer cachexia. Semin Cell Dev Biol 2016;54:82–91. [DOI] [PMC free article] [PubMed] [Google Scholar]
- 8. Chen JL, Walton KL, Qian H, Colgan TD, Hagg A, Watt MJ, et al. Differential Effects of IL6 and Activin A in the development of cancer‐associated cachexia. Cancer Res 2016;76:5372–5382. [DOI] [PubMed] [Google Scholar]
- 9. Zhou X, Wang JL, Lu J, Song Y, Kwak KS, Jiao Q, et al. Reversal of cancer cachexia and muscle wasting by ActRIIB antagonism leads to prolonged survival. Cell 2010;142:531–543. [DOI] [PubMed] [Google Scholar]
- 10. Loumaye A, de Barsy M, Nachit M, Lause P, van Maanen A, Trefois P, et al. Circulating Activin A predicts survival in cancer patients. J Cachexia Sarcopenia Muscle 2017;8:768–777.> [DOI] [PMC free article] [PubMed] [Google Scholar]
- 11. Costelli P, Muscaritoli M, Bonetto A, Penna F, Reffo P, Bossola M, et al. Muscle myostatin signalling is enhanced in experimental cancer cachexia. Eur J Clin Investig 2008;38:531–538. [DOI] [PubMed] [Google Scholar]
- 12. Lee SJ, Reed LA, Davies MV, Girgenrath S, Goad ME, Tomkinson KN, et al. Regulation of muscle growth by multiple ligands signaling through activin type II receptors. Proc Natl Acad Sci U S A 2005;102:18117–18122. [DOI] [PMC free article] [PubMed] [Google Scholar]
- 13. Morvan F, Rondeau JM, Zou C, Minetti G, Scheufler C, Scharenberg M, et al. Blockade of activin type II receptors with a dual anti‐ActRIIA/IIB antibody is critical to promote maximal skeletal muscle hypertrophy. Proc Natl Acad Sci U S A 2017;114:12448–12453.> [DOI] [PMC free article] [PubMed] [Google Scholar]
- 14. Hatakeyama S, Summermatter S, Jourdain M, Melly S, Minetti GC, Lach‐Trifilieff E. ActRII blockade protects mice from cancer cachexia and prolongs survival in the presence of anti‐cancer treatments. Skelet Muscle 2016;6:2. [DOI] [PMC free article] [PubMed] [Google Scholar]
- 15. Nissinen TA, Degerman J, Rasanen M, Poikonen AR, Koskinen S, Mervaala E, et al. Systemic blockade of ACVR2B ligands prevents chemotherapy‐induced muscle wasting by restoring muscle protein synthesis without affecting oxidative capacity or atrogenes. Sci Rep 2016;6:32695. [DOI] [PMC free article] [PubMed] [Google Scholar]
- 16. Toledo M, Busquets S, Penna F, Zhou X, Marmonti E, Betancourt A, et al. Complete reversal of muscle wasting in experimental cancer cachexia: additive effects of activin type II receptor inhibition and beta‐2 agonist. Int J Cancer 2016;138:2021–2029. [DOI] [PubMed] [Google Scholar]
- 17. Attie KM, Borgstein NG, Yang Y, Condon CH, Wilson DM, Pearsall AE, et al. A single ascending‐dose study of muscle regulator ACE‐031 in healthy volunteers. Muscle Nerve 2013;47:416–423. [DOI] [PubMed] [Google Scholar]
- 18. Rooks D, Praestgaard J, Hariry S, Laurent D, Petricoul O, Perry RG, et al. Treatment of Sarcopenia with Bimagrumab: results from a Phase II, randomized, controlled, proof‐of‐concept study. J Am Geriatr Soc 2017;65:1988–1995. [DOI] [PubMed] [Google Scholar]
- 19. Cai D, Frantz JD, Tawa NE, Jr MPA, Oh BC, Lidov HG, et al. IKKbeta/NF‐kappaB activation causes severe muscle wasting in mice. Cell 2004;119:285–298. [DOI] [PubMed] [Google Scholar]
- 20. Lerner L, Tao J, Liu Q, Nicoletti R, Feng B, Krieger B, et al. MAP3K11/GDF15 axis is a critical driver of cancer cachexia. J Cachexia Sarcopenia Muscle 2016;7:467–482. [DOI] [PMC free article] [PubMed] [Google Scholar]
- 21. Tseng YC, Kulp SK, Lai IL, Hsu EC, He WA, Frankhouser DE, et al. Preclinical investigation of the novel histone deacetylase inhibitor AR‐42 in the treatment of cancer‐induced cachexia. J Natl Cancer Inst 2015;107:djv274. [DOI] [PMC free article] [PubMed] [Google Scholar]
- 22. Johnston AJ, Murphy KT, Jenkinson L, Laine D, Emmrich K, Faou P, et al. Targeting of Fn14 prevents cancer‐induced cachexia and prolongs survival. Cell 2015;162:1365–1378. [DOI] [PubMed] [Google Scholar]
- 23. Tisdale MJ. Mechanisms of cancer cachexia. Physiol Rev 2009;89:381–410. [DOI] [PubMed] [Google Scholar]
- 24. Penna F, Busquets S, Toledo M, Pin F, Massa D, Lopez‐Soriano FJ, et al. Erythropoietin administration partially prevents adipose tissue loss in experimental cancer cachexia models. J Lipid Res 2013;54:3045–3051. [DOI] [PMC free article] [PubMed] [Google Scholar]
- 25. Bonetto A, Aydogdu T, Kunzevitzky N, Guttridge DC, Khuri S, Koniaris LG, et al. STAT3 activation in skeletal muscle links muscle wasting and the acute phase response in cancer cachexia. PLoS One 2011;6:e22538. [DOI] [PMC free article] [PubMed] [Google Scholar]
- 26. Stephens NA, Skipworth RJ, Fearon KC. Cachexia, survival and the acute phase response. Curr Opin Support Palliat Care 2008;2:267–274. [DOI] [PubMed] [Google Scholar]
- 27. Lewis HL, Chakedis JM, Talbert E, Haverick E, Rajasekera P, Hart P, et al. Perioperative cytokine levels portend early death after pancreatectomy for ductal adenocarcinoma. J Surg Oncol 2017;https://doi.org/10.1002/jso.24940. [DOI] [PubMed] [Google Scholar]
- 28. Cuenca AG, Cuenca AL, Winfield RD, Joiner DN, Gentile L, Delano MJ, et al. Novel role for tumor‐induced expansion of myeloid‐derived cells in cancer cachexia. J Immunol 2014;192:6111–6119.> [DOI] [PMC free article] [PubMed] [Google Scholar]
- 29. Corbett TH, Griswold DP, Roberts BJ, Peckham JC, Schabel FM. Tumor induction relationships in development of transplantable cancers of the colon in mice for chemotherapy assays, with a note on carcinogen structure. Cancer Res 1975;35:2434–2439. [PubMed] [Google Scholar]
- 30. Hulmi JJ, Oliveira BM, Silvennoinen M, Hoogaars WM, Ma H, Pierre P, et al. Muscle protein synthesis, mTORC1/MAPK/Hippo signaling, and capillary density are altered by blocking of myostatin and activins. Am J Physiol Endocrinol Metab 2013;304:41. [DOI] [PubMed] [Google Scholar]
- 31. Kainulainen H, Papaioannou KG, Silvennoinen M, Autio R, Saarela J, Oliveira BM, et al. Myostatin/activin blocking combined with exercise reconditions skeletal muscle expression profile of mdx mice. Mol Cell Endocrinol 2015;399:131–142. [DOI] [PubMed] [Google Scholar]
- 32. Silvennoinen M, Rantalainen T, Kainulainen H. Validation of a method to measure total spontaneous physical activity of sedentary and voluntary running mice. J Neurosci Methods 2014;235:51–58. [DOI] [PubMed] [Google Scholar]
- 33. Goodman CA, Mabrey DM, Frey JW, Miu MH, Schmidt EK, Pierre P, et al. Novel insights into the regulation of skeletal muscle protein synthesis as revealed by a new nonradioactive in vivo technique. FASEB J 2011;25:1028–1039. [DOI] [PMC free article] [PubMed] [Google Scholar]
- 34. Schmidt EK, Clavarino G, Ceppi M, Pierre P. SUnSET, a nonradioactive method to monitor protein synthesis. Nat Methods 2009;6:275–277. [DOI] [PubMed] [Google Scholar]
- 35. Hulmi JJ, Nissinen TA, Rasanen M, Degerman J, Lautaoja JH, Hemanthakumar KA, et al. Prevention of chemotherapy‐induced cachexia by ACVR2B ligand blocking has different effects on heart and skeletal muscle. J Cachexia Sarcopenia Muscle 2017;https://doi.org/10.1002/jcsm.12265. [DOI] [PMC free article] [PubMed] [Google Scholar]
- 36. Hulmi JJ, Oliveira BM, Silvennoinen M, Hoogaars WM, Pasternack A, Kainulainen H, et al. Exercise restores decreased physical activity levels and increases markers of autophagy and oxidative capacity in myostatin/activin‐blocked mdx mice. Am J Physiol Endocrinol Metab 2013;305:171. [DOI] [PubMed] [Google Scholar]
- 37. Costes SV, Daelemans D, Cho EH, Dobbin Z, Pavlakis G, Lockett S. Automatic and quantitative measurement of protein‐protein colocalization in live cells. Biophys J 2004;86:3993–4003. [DOI] [PMC free article] [PubMed] [Google Scholar]
- 38. Jacobs BL, Goodman CA, Hornberger TA. The mechanical activation of mTOR signaling: an emerging role for late endosome/lysosomal targeting. J Muscle Res Cell Motil 2014;35:11–21. [DOI] [PMC free article] [PubMed] [Google Scholar]
- 39. Sancak Y, Bar‐Peled L, Zoncu R, Markhard AL, Nada S, Sabatini DM. Ragulator‐Rag complex targets mTORC1 to the lysosomal surface and is necessary for its activation by amino acids. Cell 2010;141:290–303. [DOI] [PMC free article] [PubMed] [Google Scholar]
- 40. Sartori R, Schirwis E, Blaauw B, Bortolanza S, Zhao J, Enzo E, et al. BMP signaling controls muscle mass. Nat Genet 2013;45:1309–1318. [DOI] [PubMed] [Google Scholar]
- 41. Waight JD, Netherby C, Hensen ML, Miller A, Hu Q, Liu S, et al. Myeloid‐derived suppressor cell development is regulated by a STAT/IRF‐8 axis. J Clin Invest 2013;123:4464–4478. [DOI] [PMC free article] [PubMed] [Google Scholar]
- 42. Bronte V, Brandau S, Chen SH, Colombo MP, Frey AB, Greten TF, et al. Recommendations for myeloid‐derived suppressor cell nomenclature and characterization standards. Nat Commun 2016;7:12150. [DOI] [PMC free article] [PubMed] [Google Scholar]
- 43. Benny Klimek ME, Aydogdu T, Link MJ, Pons M, Koniaris LG, Zimmers TA. Acute inhibition of myostatin‐family proteins preserves skeletal muscle in mouse models of cancer cachexia. Biochem Biophys Res Commun 2010;391:1548–1554. [DOI] [PubMed] [Google Scholar]
- 44. Azoulay E, Thiery G, Chevret S, Moreau D, Darmon M, Bergeron A, et al. The prognosis of acute respiratory failure in critically ill cancer patients. Medicine (Baltimore) 2004;83:360–370. [DOI] [PubMed] [Google Scholar]
- 45. Schapira DV, Studnicki J, Bradham DD, Wolff P, Jarrett A. Intensive care, survival, and expense of treating critically ill cancer patients. JAMA 1993;269:783–786. [PubMed] [Google Scholar]
- 46. Murphy KT, Chee A, Trieu J, Naim T, Lynch GS. Importance of functional and metabolic impairments in the characterization of the C‐26 murine model of cancer cachexia. Dis Model Mech 2012;5:533–545. [DOI] [PMC free article] [PubMed] [Google Scholar]
- 47. Roberts BM, Ahn B, Smuder AJ, Al‐Rajhi M, Gill LC, Beharry AW, et al. Diaphragm and ventilatory dysfunction during cancer cachexia. FASEB J 2013;27:2600–2610. [DOI] [PMC free article] [PubMed] [Google Scholar]
- 48. Kalantar‐Zadeh K, Rhee C, Sim JJ, Stenvinkel P, Anker SD, Kovesdy CP. Why cachexia kills: examining the causality of poor outcomes in wasting conditions. J Cachexia Sarcopenia Muscle 2013;4:89–94. [DOI] [PMC free article] [PubMed] [Google Scholar]
- 49. Murphy KT. The pathogenesis and treatment of cardiac atrophy in cancer cachexia. Am J Physiol Heart Circ Physiol 2016;310:466. [DOI] [PubMed] [Google Scholar]
- 50. Cray C, Zaias J, Altman NH. Acute phase response in animals: a review. Comp Med 2009;59:517–526. [PMC free article] [PubMed] [Google Scholar]
- 51. Samuels SE, McLaren TA, Knowles AL, Stewart SA, Madelmont JC, Attaix D. Liver protein synthesis stays elevated after chemotherapy in tumour‐bearing mice. Cancer Lett 2006;239:78–83. [DOI] [PubMed] [Google Scholar]
- 52. Barber MD, Fearon KC, McMillan DC, Slater C, Ross JA, Preston T. Liver export protein synthetic rates are increased by oral meal feeding in weight‐losing cancer patients. Am J Physiol Endocrinol Metab 2000;279:707. [DOI] [PubMed] [Google Scholar]
- 53. Argiles JM, Busquets S, Toledo M, Lopez‐Soriano FJ. The role of cytokines in cancer cachexia. Curr Opin Support Palliat Care 2009;3:263–268. [DOI] [PubMed] [Google Scholar]
- 54. Martin F, Santolaria F, Batista N, Milena A, Gonzalez‐Reimers E, Brito MJ, et al. Cytokine levels (IL‐6 and IFN‐gamma), acute phase response and nutritional status as prognostic factors in lung cancer. Cytokine 1999;11:80–86. [DOI] [PubMed] [Google Scholar]
- 55. Talbert EE, Lewis HL, Farren MR, Ramsey ML, Chakedis JM, Rajasekera P, et al. Circulating monocyte chemoattractant protein‐1 (MCP‐1) is associated with cachexia in treatment‐naive pancreatic cancer patients. J Cachexia Sarcopenia Muscle 2018;https://doi.org/10.1002/jcsm.12251. [DOI] [PMC free article] [PubMed] [Google Scholar]
- 56. Aulino P, Berardi E, Cardillo VM, Rizzuto E, Perniconi B, Ramina C, et al. Molecular, cellular and physiological characterization of the cancer cachexia‐inducing C26 colon carcinoma in mouse. BMC Cancer 2010;10:363. [DOI] [PMC free article] [PubMed] [Google Scholar]
- 57. Mundy‐Bosse BL, Lesinski GB, Jaime‐Ramirez AC, Benninger K, Khan M, Kuppusamy P, et al. Myeloid‐derived suppressor cell inhibition of the IFN response in tumor‐bearing mice. Cancer Res 2011;71:5101–5110. [DOI] [PMC free article] [PubMed] [Google Scholar]
- 58. Suragani RN, Cawley SM, Li R, Wallner S, Alexander MJ, Mulivor AW, et al. Modified activin receptor IIB ligand trap mitigates ineffective erythropoiesis and disease complications in murine beta‐thalassemia. Blood 2014;123:3864–3872. [DOI] [PMC free article] [PubMed] [Google Scholar]
- 59. Toledo M, Penna F, Busquets S, Lopez‐Soriano FJ, Argiles JM. Distinct behaviour of sorafenib in experimental cachexia‐inducing tumours: the role of STAT3. PLoS One 2014;9:e113931. [DOI] [PMC free article] [PubMed] [Google Scholar]
- 60. Pin F, Busquets S, Toledo M, Camperi A, Lopez‐Soriano FJ, Costelli P, et al. Combination of exercise training and erythropoietin prevents cancer‐induced muscle alterations. Oncotarget 2015;6:43202–43215. [DOI] [PMC free article] [PubMed] [Google Scholar]
- 61. Friedenreich CM, Neilson HK, Farris MS, Courneya KS. Physical activity and cancer outcomes: a precision medicine approach. Clin Cancer Res 2016;22:4766–4775. [DOI] [PubMed] [Google Scholar]
- 62. Moore SC, Lee IM, Weiderpass E, Campbell PT, Sampson JN, Kitahara CM, et al. Association of leisure‐time physical activity with risk of 26 types of cancer in 1.44 million adults. JAMA Intern Med 2016;176:816–825. [DOI] [PMC free article] [PubMed] [Google Scholar]
- 63. van Norren K, Kegler D, Argiles JM, Luiking Y, Gorselink M, Laviano A, et al. Dietary supplementation with a specific combination of high protein, leucine, and fish oil improves muscle function and daily activity in tumour‐bearing cachectic mice. Br J Cancer 2009;100:713–722. [DOI] [PMC free article] [PubMed] [Google Scholar]
- 64. Hoda MA, Rozsas A, Lang E, Klikovits T, Lohinai Z, Torok S, et al. High circulating Activin A level is associated with tumor progression and predicts poor prognosis in lung adenocarcinoma. Oncotarget 2016;7:13388–13399. [DOI] [PMC free article] [PubMed] [Google Scholar]
- 65. Antsiferova M, Huber M, Meyer M, Piwko‐Czuchra A, Ramadan T, MacLeod AS, et al. Activin enhances skin tumourigenesis and malignant progression by inducing a pro‐tumourigenic immune cell response. Nat Commun 2011;2:576. [DOI] [PMC free article] [PubMed] [Google Scholar]
- 66. Li Q, Kumar R, Underwood K, O'Connor AE, Loveland KL, Seehra JS, et al. Prevention of cachexia‐like syndrome development and reduction of tumor progression in inhibin‐deficient mice following administration of a chimeric activin receptor type II‐murine Fc protein. Mol Hum Reprod 2007;13:675–683. [DOI] [PubMed] [Google Scholar]
- 67. Fearon K, Strasser F, Anker SD, Bosaeus I, Bruera E, Fainsinger RL, et al. Definition and classification of cancer cachexia: an international consensus. Lancet Oncol 2011;12:489–495. [DOI] [PubMed] [Google Scholar]
- 68. von Haehling S, Morley JE, Coats AJS, Anker SD. Ethical guidelines for publishing in the journal of cachexia, sarcopenia and muscle: update 2017. J Cachexia Sarcopenia Muscle 2017;8:1081–1083. [DOI] [PMC free article] [PubMed] [Google Scholar]
Associated Data
This section collects any data citations, data availability statements, or supplementary materials included in this article.
Supplementary Materials
Figure S1 C26 cancer decreases (a) body mass (time x group interaction P < 0.001) and masses of (b) tibialis anterior (TA), (c) gastrocnemius (GA), (d) heart and (e) epididymal fat (eWAT). TL = tibial length. C26 tumour expresses substantially higher levels of (f) Activin A, (g) Il‐6, and (h) Myostatin mRNA than LLC tumour. *, ** and *** = P < 0.05, P < 0.01 and P < 0.001, respectively. Students t‐test (a–e), Mann‐Whitney U (f–h). N‐sizes are depicted in the bar graphs, except in (a) where N = 8 per group. Data is presented as means ± SEM, except in (a), where data is presented as mean ± SD.
Supplementary Table S1 Primer information for qPCR analyses.
Figure S2 The effects of C26 cancer and sACVR2B‐Fc administration on body mass and tumour and muscle gene expression. (a) Length of the tibia on day 11 after C26 cell inoculation. (b) Body masses in the survival experiment. Tumour (c) Activin A (Inhibin βA) and (d) Il‐6 mRNA expression. Gastrocnemius (e) Activin A (Inhibin βA), (f) Il‐6 and (g) Myostatin (Gdf8) mRNA expression at day 11 after tumour inoculation. C26 cells were inoculated at day 0. mRNA‐results were normalized to 36b4 mRNA. FC = fold change. * and ** = P < 0.05, and P < 0.01, respectively. Student's t‐test and one‐way ANOVA with Holm‐Bonferroni corrected LSD (a, e–g). Kruskall‐Wallis with Holm‐Bonferroni corrected Mann‐Whitney U (c, d). N‐sizes are depicted in the bar graph except in (b) in which n = 6, 12, 8, and 9 in CTRL, C26 + PBS, C26 + sACVR/b, and C26 + sACVR/c, respectively.
Figure S3 (a) Phosphorylation of S6K1 at Thr389 was decreased in tumour‐bearing mice on day 11 after C26 cell inoculation. C26 cancer cachexia was associated with increased ubiquitinated proteins in (b) tibialis anterior and (c) diaphragm, and increased mRNA expression of ubiquitin ligases (d) Murf1, (e) Atrogin1 and (f) Musa1, which were not affected by sACVR2B‐Fc administration in gastrocnemius on day 11 after C26 cell inoculation. C = CTRL, P = C26 + PBS, Ab = C26 + sACVR/b, Ac = C26 + sACVR/c. FC = fold change. * and ** = P < 0.05 and P < 0.01, respectively. Kruskall‐Wallis with Holm‐Bonferroni corrected Mann‐Whitney U (a–e), Student's t‐test and one‐way ANOVA with Holm‐Bonferroni corrected LSD (f). N‐sizes are depicted in the bar graphs.
Figure S4 Mitochondrial markers in the heart on day 11 after C26 cell injection. (a) PGC‐1α and cytochrome c (Cyt c) protein levels were not altered by the C26 tumour or the sACVR2B‐Fc treatment in the heart. N‐sizes are depicted in the bar graphs. (b) OXPHOS complex IV (MTCO1) was significantly increased in the hearts of the vehicle treated tumour‐bearing mice (C26 + PBS). In addition, when all C26 tumour‐bearing groups were pooled, a significant increase was seen also in complexes CI (NDUFB8) and CIII (UQCRC2) as well as the sum of all complexes (total). This pooled C26‐effect is depicted by the lines without vertical ends. N = 7–9/group. C = CTRL, P = C26 + PBS, Ab = C26 + sACVR/b, Ac = C26 + sACVR/c. * and *** = P < 0.05 and P < 0.001, respectively (Mann‐Whitney U).
Supplementary Table S2 Serum cytokine levels at 11 days after C26 cell injection. N = 8, 7, 6 and 8 in CTRL, C26 + PBS, C26 + sACVR/b and C26 + sACVR/c groups, respectively. The values are presented in pg/ml. If over half of the values in the group were below or close to the detection limit, the concentration is not presented (depicted as N/A in the table). Cytokines with at least 3/4 of all values below or close to the detection limit are not shown (IL‐1a, IL‐2, IL‐3, IL‐4, IL‐10, IL‐17, IFNy, TNF‐α, MIP‐1a and GM‐CSF). In statistical analysis, the C26‐effect was analysed by pooling all the tumour‐bearing groups. The sACVR‐effect P‐value designates the lowest sACVR2B‐Fc P‐value in comparison to C26 + PBS and if the significance is found, the sACVR2B‐Fc group significantly different compared with C26 + PBS is indicated with *.
Figure S5 Effects of C26 tumour and sACVR2B‐Fc on the spleen on day 13 after C26 cell inoculation. (a) C26 cancer‐induced splenomegaly is attenuated by sACVR2B‐Fc administration. Splenic (b) CD11b and (c) GR‐1 contents were increased in C26 cancer when multiplied by spleen mass to reflect the total abundance of CD11b and GR‐1 positive cells. (d) sACVR2B‐Fc administration resulted in increased splenic Cdkn1a (p21) mRNA. * and ** = P < 0.05 and P < 0.01, respectively. C26 and sACVR2B‐Fc effects were analysed with Student's t‐test (a, b, d) or Mann‐Whitney U test (c). N‐sizes are depicted in the bar graphs.