Abstract
Tyrosine kinase Src is overexpressed and activated in various tumors, including breast cancer, and is supposed to promote cancer formation and development. Src inhibitors have been developed recently and have shown efficacy in breast cancer as a single agent or in combination with anti‐HER2 antibodies or chemotherapy. Unfortunately, the potency of Src inhibitor is limited by the development of drug resistance. In our study, we established an Src inhibitor saracatinib‐resistant breast cancer cell line (SKBR‐3/SI) for the first time and by evaluating mRNA expression profile, we found that plasminogen activator inhibitor‐1 (PAI‐1) was upregulated in saracatinib‐resistant cells compared to the parent cells. Further study demonstrated that PAI‐1 might induce saracatinib resistance in breast cancer cells by increasing the secretion of chemokine (C‐C motif) ligand 5 (CCL5). Functional assays showed that PAI‐1 and CCL5 overexpression promoted cell proliferation and migration in breast cancer cells, while inhibition of PAI‐1 and CCL5 decreased cell proliferation and migration in saracatinib‐resistant cells. We also showed that targeting PAI‐1 or CCL5 could reverse saracatinib resistance, which deserves more attention in clinical settings.
Keywords: breast cancer, CCL5, drug resistance, PAI‐1, Src inhibitor
1. INTRODUCTION
Breast cancer is the most frequent malignancy, and is the second most common cause of cancer death among women according to the latest data.1, 2 Targeted therapies have resulted in huge improvements in breast cancer treatment. Take trastuzumab as an example. Addition of trastuzumab to chemotherapy has strikingly reduced the mortality rate of HER2‐positive breast cancer and has emerged as a first‐line treatment strategy for patients with HER2‐positive breast cancer.3 However, primary and/or acquired resistance occurs in the majority of patients receiving targeted therapy and eventually leads to the failure of treatment.4 Regretfully, because of the complexity of breast cancer and the unique traits of targeted therapy, resistance to targeted therapy remains an obstacle in cancer treatment.
Src, an intracellular tyrosine kinase, plays a central role in cellular signaling pathways controlling proliferation and survival.5, 6, 7 Src family kinases are confirmed in signal transduction downstream of multiple signaling networks, including ErbB receptor.8 Increased Src activity has been observed in various cancers, such as breast, colon, liver, lung and pancreatic cancer.7, 9, 10, 11 Moreover, a series of laboratory and clinical trials have implied that combination of Src inhibitor and anti‐HER2 therapy showed efficacy in human breast cancer cells and primary tumors.6, 12 Several studies have reported that the activation of Src might be an important factor in the process of trastuzumab resistance.13 Furthermore, Rexer and colleagues confirmed that increased Src kinase activity contributes to lapatinib resistance and proved that the combination of HER2 antagonists with Src inhibitors was a potent strategy to prevent or overcome HER2 inhibitor resistance in HER‐positive breast cancer.8 Unfortunately, acquired resistance to Src inhibitor is an inevitably critical issue at this time and the exact mechanisms underlying the resistance remain unclear. To take advantage of Src inhibitor, it is urgent to investigate the potential mechanisms of Src inhibitor resistance. Thus, we established an Src inhibitor resistant cell line (named SKBR‐3/SI) from SKBR‐3 cells and demonstrated that the high expression of plasminogen activator inhibitor‐1 (PAI‐1) promoted the acquired resistance to Src inhibitor by inducing chemokine (C‐C motif) ligand 5 (CCL5) secretion.
2. MATERIALS AND METHODS
2.1. Cell lines and animals
The HER2‐positive breast cancer cell line SKBR‐3 was purchased in 2016‐2017 from the Chinese Academy of Science Committee Type Culture Collection Cell Bank (Shanghai, China). The authenticity of these cell lines was conducted by the Chinese Academy of Science Committee Type Culture Collection Cell Bank before purchase by STR DNA typing methodology. Cells were cultured in RPMI 1640 Medium (Gibco, USA) that was supplemented with 10% FBS (HyClone, USA) and then incubated in a humified atmosphere with 5% CO2 at 37°C. SKBR‐3 cells were consistently exposed to medium with increased concentrations of saracatinib. Finally, cells were obtained that grew exponentially in the presence of 13 μmol/L saracatinib, and were named SKBR‐3/SI. In experiments with SKBR‐3/SI cells, cells were cultured for at least 4 weeks without saracatinib.
BALB/c athymic nude mice (female, age 4‐6 weeks) were purchased from Jinling Hospital (Nanjing, China) and maintained in a pathogen‐free facility. SKBR‐3 or SKBR‐3/SI cells (2 × 10⁵) were subcutaneously injected into the right anterior inguinal region of BALB/c nude mice. Animal studies were performed in accordance with institutional guidelines.
2.2. Reagents
Saracatinib was purchased from MedChem Express (Shanghai, China). Human recombinant PAI‐1 and CCL5 (PeproTech, Rocky Hill, NJ, USA) were dissolved in culture medium, and a bioavailable PAI‐1 antagonist, PAI‐039 (PeproTech), was dissolved in DMSO (Sigma‐Aldrich) and stored at −80°C as a 1 mg/mL stock solution. The antibodies used included the following: BCRP/ABCG2 (Abcam, ab108312), PAI‐1 (Abcam, ab187262), CCL5 (Abcam, ab9666) and Ki‐67 (Abcam, ab15580).
2.3. Cell viability assay
Cell viability was measured with CCK8 assay. Briefly, 1 × 10³ cells per were plated into a 96‐well plate with 6 repeats. After 24 hours, the cells were treated with fresh medium including 1, 2 and 4 μmol/L saracatinib or 1, 10 and 100 μmol/L human recombinant PAI‐1 for 24, 48 and 72 hours. Then, CCK8 solution (100 μL, 10 mg/mL) (KeyGEN BioTECH, NanJing, China) was added into each well at 37°C for 1‐4 hours. The absorbance value (OD) was measured using a microplate reader (Bio RadModel 450) with 490 nm filter. The half maximal inhibitory concentration (IC50), which is an important indicator for drug sensitivity assay, was calculated using SPSS software through a probit model using logit‐transformed dose‐response data.
2.4. Colony formation assay
The SKBR‐3 and SKBR‐3/SI cells were seeded in 6‐well plates at a density of 500‐1000 cells per well for approximately 24 hours under standard conditions. After specific treatments, the cells then were exposed to saracatinib or human recombinant PAI‐1. After 15 days of incubation, the colonies were fixed with methanol, stained with 0.5% crystal violet in absolute ethanol, and colonies with ≥50 cells were counted under a dissection microscope. These experiments were repeated at least 3 times.
2.5. Flow cytometry analysis
The SKBR‐3 and SKBR‐3/SI cells were treated with saracatinib or human recombinant PAI‐1 for 48 hours, then harvested by trypsinization (not with EDTA), centrifuged and washed with PBS. Cell pellets were resuspended and incubated in 500 μL binding buffer. After 15 minutes incubation with 5 μL annexin V‐fluorescein isothiocyanate (FITC) and 5 μL propidium iodide (PI) in the dark at room temperature, the rate of early apoptosis was monitored with a flow cytometer (BD FACSCalibur, USA). Each sample was tested in triplicate.
2.6. Wound healing and migration assay
Cells were seeded in 12‐well plates and incubated to generate confluent cultures. Wounds were scratched in the cell monolayer using a 200‐μL sterile pipette tip. The cells were rinsed with PBS. The migration of the cells at the edge of the scratch was photographed at time 0 and at 24 hours.
Cell migration was measured by using 24‐well Transwell chambers (Costar, USA). In brief, approximately 2 × 10⁴ cells/200 μL were plated in white medium where human recombinant PAI‐1 or CCL5 and PAI‐039 or CCL5 neutralizing antibody were attached in the top chamber of each Transwell. Then, 800 μL of full medium including 10% FBS was injected into the lower chamber. After 24 hours of incubation, the inserts were fixed with 100% methanol, subsequently stained with crystal violet, and photographed under a microscope.
2.7. Quantitative real‐time PCR
Total RNA was extracted from cultured cells using Trizol Reagent (Invitrogen, Carlsbad, CA, USA) according to the manufacturers’ recommendations. For quantitative real‐time PCR (qRT‐PCR) analysis of PAI‐1, CCL5 and CCR5 mRNA expression, cDNA obtained by reverse transcription of 2 μg total RNA was synthesized using a PrimeScript RT Master Mix (Perfect Real Time) Kit (RR036A, Takara, China), followed by PCR using Power SYBR Green PCR Master Mix (Life Technology, USA). β‐actin was used as an internal control. The primer sequences (forward and reverse, respectively) were as follows: PAI‐1‐forward, 5′‐GAGAACCTGGGAATGACCGAC‐3′ and reverse, 5′‐TGCCACTCTCGTTCACCTCG‐3′; CCL5‐forward, 5′‐CCCTCGCTGTCATCCTCATTG‐3′ and reverse, 5′‐ACACACTTGGCGGTTCTTTCG‐3′; CCR5‐forward, 5′‐GAGACTCTTGGGATGACGCACT‐3′ and reverse, 5′‐TAAACTGAGCTTGCTCGCTCG‐3′; β‐actin‐forward, 5′‐GTGGCCGAGGACTTTGATTG‐3′ and reverse, 5′‐CCTGTAACAACGCATCTCATATT‐3′. All PCR were performed in triplicate. The relative expression of PAI‐1, CCL5 and CCR5 was determined using the 2−ΔΔCt method.
2.8. ELISA assay
Concentrations of PAI‐1 and CCL5 in cell conditioned medium were determined using commercially available CCL5 (KEYGEN, KEGHC143, Nan Jing, China) and PAI‐1 (KEYGEN, KEGHX025, Nan Jing, China) ELISA kits. ELISA were performed according to the manufacturer's instructions.
2.9. Western blot analysis
Total protein was extracted using RIPA buffer supplemented with protease inhibitors and quantified using a BCA Kit (Thermo Scientific, Pittsburgh PA, USA). Cell lysates were resolved by SDS‐PAGE electrophoresis (30 μg/sample) and electro‐transferred onto PVDF membranes. After incubation in blocking buffer, the membranes were probed overnight at 4°C with the primary antibodies: GAPDH (CST), 1: 5000; BCRP/ABCG2 (Abcam ab108312), 1: 5000; PAI‐1 (Abcam ab187262), 1: 2000. The subsequent steps were performed as previously described.14
2.10. Transient transfection
PAI‐1 siRNA and nonspecific control siRNA were chemically synthesized by RiboBio (Guangzhou, China). Target sequences for siRNA are as follows: PAI‐11: 5′‐TGACCGACATGTTCAGACA‐3′; PAI‐12: 5′‐GAGCCAGATTCATCATCAA‐3′; PAI‐13: 5′‐CTGACAACAGGAGGAGAAA‐3′; and negative control: 5′‐GTTCTCCGAACGTGTCACGT‐3′. siRNA targeting PAI‐1 were transfected into cells using LipoFilter according its protocol (HanHeng, Shanghai, China). Protein extracts and drug treatments were started 48 hours after transfection.
2.11. Immunohistochemistry
Following deparaffinization, sections were rehydrated and subjected to antigen retrieval using citrate buffer (BioGenex, USA). The slides were incubated with PAI‐1 or CCL5 antibodies (1:200) at 4°C overnight. The following steps were performed as previously described. The percentages of positive cells and staining intensities were scored as previously described.15
2.12. Statistical analysis
SPSS Statistics 19.0 (SPSS) was used for statistical analysis. Data were analyzed using one‐way ANOVA or a Student's t test. Data are presented as means ± SD of 3 independent experiments. All analyses were performed with significance levels of *P < .05, **P < .01 and ***P < .001.
3. RESULTS
3.1. Saracatinib‐resistant breast cancer cell line was successfully established
To investigate the underlying mechanisms for saracatinib resistance, we continuously exposed saracatinib‐sensitive cells (SKBR‐3) to saracatinib and established a saracatinib‐resistant breast cancer cell subline, SKBR‐3/SI. Using CCK8 and colony formation assays, we revealed that the cell proliferation of SKBR‐3 was significantly inhibited by saracatinib, while SKBR‐3/SI cell line was not suppressed (Figure 1A,B). As for cell apoptosis, saracatinib markedly increased the early and later apoptosis rate of SKBR‐3 but had no effect on SKBR‐3/SI, suggesting the stable proliferation of resistant breast cancer cells (Figure 1C). Previous studies verified that breast cancer resistance protein (BCRP/ABCG2) was implicated in the development of anticancer resistance.16 We also confirmed that BCRP was upregulated in SKBR‐3/SI compared with SKBR‐3 (Figure 1D). These data indicated that the saracatinib‐resistant cell line was successfully established.
Figure 1.
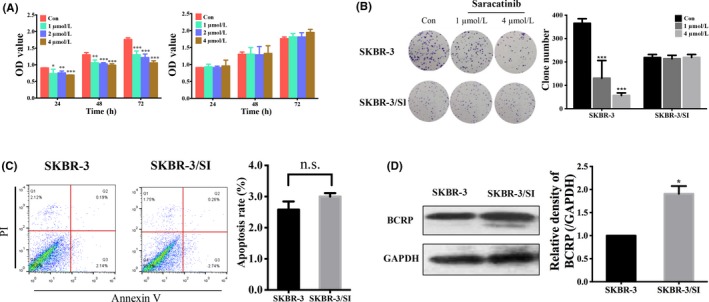
Saracatinib‐resistant breast cancer cell line was successfully established. A, OD value in 2 different breast cell lines (SKBR‐3 and SKBR‐3/SI) was shown after treatment of saracatinib with indicated concentrations for 24, 48 and 72 h. B, Colony formation showed the proliferation of SKRB‐3 and SKBR‐3/SI after exposure to 1 or 4 μmol/L saracatinib. C, Cell apoptosis of SKBR‐3 and SKBR‐3/SI cells after exposure to 4 μmol/L saracatinib were analyzed by flow cytometry. The histogram represents the proportion of apoptotic cells. D, Breast cancer resistance protein (BCRP/ABCG2) expression was determined by western blot. The error bars represent the mean of 3 separate determinations ± SD. *P < .05, **P < .01, ***P < .001
3.2. PAI‐1 was upregulated in saracatinib‐resistant cell line
To explore whether certain factors conferred to resistance of saracatinib, we evaluated the mRNA expression profile between parental cell line SKBR‐3 and resistant cell line SKBR‐3/SI. On the basis of our laboratory's previous study results, which hint that PAI‐1 accelerates malignancy in breast cancer and is a prominent factor during tumor development and progression,17 we further found that mRNA expression of PAI‐1 was increased in the resistant cell line. Interestingly, gene ontology analysis of genes with over 2‐fold change between SKBR‐3/SI and SKBR‐3 revealed an enrichment of factors involved in positive regulation of monocyte chemotaxis, which also was reported to interact with PAI‐1 to enhance disease progression of breast cancer in our early data (Figure 2A).17 Hence, we chose PAI‐1 for further research and confirmed that expression of PAI‐1 in SKBR‐3/SI was relatively higher in mRNA and protein levels than in SKBR‐3 (Figure 2B,C).
Figure 2.
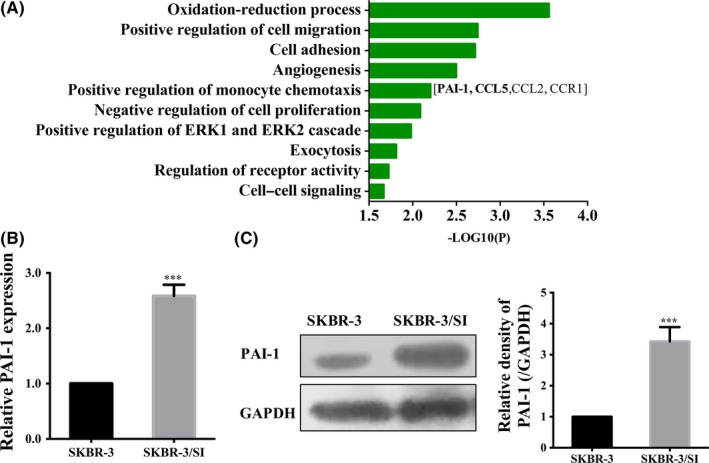
Upregulation of PAI‐1 in saracatinib‐resistant cells. A, Gene ontology analysis of gene differentially expressed in SKBR‐3 and SKBR‐3/SI was performed. B, Relative mRNA expression of PAI‐1 in SKBR‐3 and SKBR‐3/SI cells. C, PAI‐1 expression in SKBR‐3 and SKBR‐3/SI cells was detected by western blot. The error bars represent the mean of 3 separate determinations ± SD. ***P < .001
3.3. PAI‐1 promoted Src inhibitor resistance, cell proliferation and migration in breast cancer cells
Next, to investigate the impact of PAI‐1, we treated SKBR‐3 or SKBR‐3/SI with recombinant human PAI‐1 (rPAI‐1) or a bioavailable PAI‐1 antagonist, PAI‐039, respectively. We found that rPAI‐1, which can mimic the function of PAI‐1, decreased SKBR‐3 cell sensitivity to saracatinib, while PAI‐039, inhibiting PAI‐1 activity, led to increased SKBR‐3/SI cell sensitivity to saracatinib (Figure 3A). As shown in Figure 3B,C, the treatment of rPAI‐1 promoted cell proliferation in SKBR‐3 while proliferation was inhibited by PAI‐039 in SKBR‐3/SI by using CCK8 assay and colony formation assay. We also observed that neither rPAI‐1 nor PAI‐039 had an effect on apoptosis (Figure 3D). Furthermore, transwell migration assay found that PAI‐1could promote cell migration, while PAI‐039 suppressed the cell migration in SKBR‐3/SI (Figure 3E). In conclusion, these results showed that PAI‐1 not only induces resistance to Src inhibitor in HER2‐positive breast cancer cells, but also promotes the formation of tumor malignancy phenotype, such as proliferation and migration, which suggested that targeting PAI‐1 might be a therapeutic option to restore sensitivity to saracatinib in resistant cells.
Figure 3.
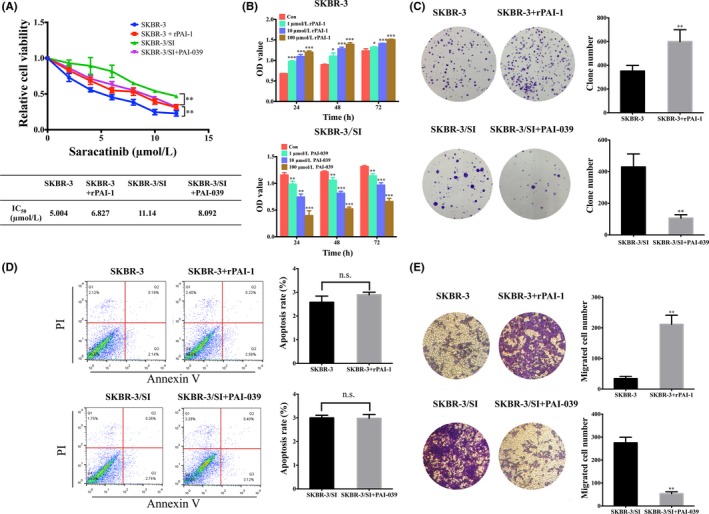
PAI‐1 promoted Src inhibitor resistance, cell proliferation and migration in breast cells. A, Relative cell viability was determined in SKBR‐3 and SKBR‐3/SI cells following treatment with 10 ng/mL rPAI‐1 and PAI‐039 for 72 h by CCK8 assay. IC50 values of SKBR‐3 and SKBR‐3/SI cells were presented in the mini‐tables. B, OD value in SKBR‐3 and SKBR‐3/SI after treatment of 1, 10 or 100 μmol/L rPAI‐1 and PAI‐039, respectively, for 24, 48 and 72 h. C, Colony formation showed the proliferation of SKRB‐3 and SKBR‐3/SI after treatment of 10 ng/mL rPAI‐1 and PAI‐039, respectively. D, Cell apoptosis of SKBR‐3 and SKBR‐3/SI after exposure to 10 ng/mL rPAI‐1 or PAI‐039 for 48 h was shown. E, Cell migration analysis in SKBR‐3 and SKBR‐3/SI cells treated with 10 ng/mL rPAI‐1 and PAI‐039 were performed. The error bars represent the mean of 3 separate determinations ± SD. *P < .05, **P < .01, ***P < .001
3.4. PAI‐1 upregulated the expression of the CCL5 in SKBR‐3 cells
Our previous study found that PAI‐1 activated the CCL5/CCR5 axis in endothelial cells. In turn, CCL5 could induce PAI‐1 expression and secretion in breast cells, thus forming a positive feedback loop and facilitating the invasion behavior of cancer cells.17 Therefore, we speculated whether PAI‐1‐conferred Src inhibitor resistance was via CCL5. Notably, we observed increased expression of CCL5 in the resistant cell lines by examining the mRNA expression (Figures 2A,4A). As shown in Figure 4B,C, rPAI‐1 treatment, indeed, induced CCL5 secretion in SKBR‐3. In contrast, CCL5 secretion was inhibited by PAI‐039 in SKBR‐3/SI cells. Then, we synthesized 3 PAI‐1 small interfering RNA (siPAI‐1) and transfected them into SKBR‐3/SI. SiPAI‐11 and siPAI‐12 were the most transfection‐efficient and were chosen for additional study (Figure 4D). After treatment with PAI‐1 knockdown, lower expression of CCL5 was observed in SKBR‐3/SI cells (Figure 4E). This further confirmed our speculation that PAI‐1 upregulates the expression of CCL5 in the saracatinib‐resistant cell line SKBR‐3/SI.
Figure 4.
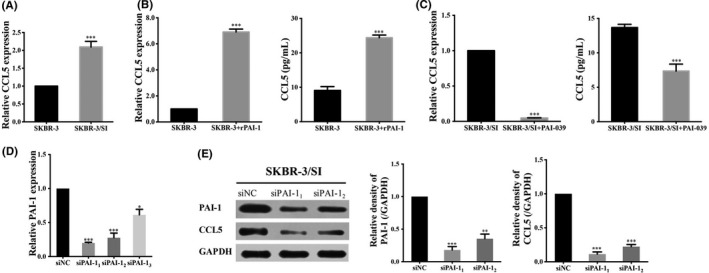
PAI‐1 upregulated the expression of CCL5 in SKBR‐3/SI cells. A, qRT‐PCR verified the increased expression of CCL5 in SKBR‐3/SI cells. B,C, The expression level of CCL5 and the secretion level of CCL5 were detected in SKBR‐3 after treated with 10 ng/mL of rPAI‐1and PAI‐039 for 48 h by qRT‐PCR and ELISA, respectively. D, qRT‐PCR analysis of PAI‐1 mRNA expression post‐siRNA knockdown of PAI‐1 in SKBR‐3/SI cells. E, PAI‐1 and CCL5 expression were determined in SKBR‐3/SI after knockdown of PAI‐1 by western blot. The error bars represent the mean of 3 separate determinations ± SD. *P < .05, **P < .01, ***P < .001
3.5. Effects of CCL5 on breast cancer cells
To further clarify the molecular mechanisms of saracatinib resistance, we treated SKBR‐3 or SKBR‐3/SI with recombinant human CCL5, which serves as exogenous CCL5, or a neutralizing CCL5 antibody (ab), respectively. It was observed that treatment with CCL5 decreased SKBR‐3 cell sensitivity to saracatinib, whereas CCL5 ab induced increased SKBR‐3/SI cell sensitivity to saracatinib (Figure 5A). Colony formation assay also confirmed that CCL5 promoted cell proliferation in SKBR‐3, while proliferation was inhibited by CCL5 ab in SKBR‐3/SI (Figure 5B). Next, it was observed that cell apoptosis of SKBR‐3 was not influenced by CCL5 and CCL5 ab, as shown in Figure 5C. To assess the effect of CCL5 on cell migration, we performed a wound‐healing assay and a transwell migration assay. As shown in Figure 5D,E, it was observed that CCL5 treatment promoted SKBR‐3 cell migration, whereas administration of CCL5 ab inhibited cell migration in SKBR‐3/SI. Conclusively, CCL5 could contribute to Src inhibitor resistance and played a critical role in cancer development by promoting cell proliferation and migration. Taken together, our observations suggested that overexpressed PAI‐1 might result in resistance to Src inhibitor in SKBR‐3 by upregulating CCL5.
Figure 5.
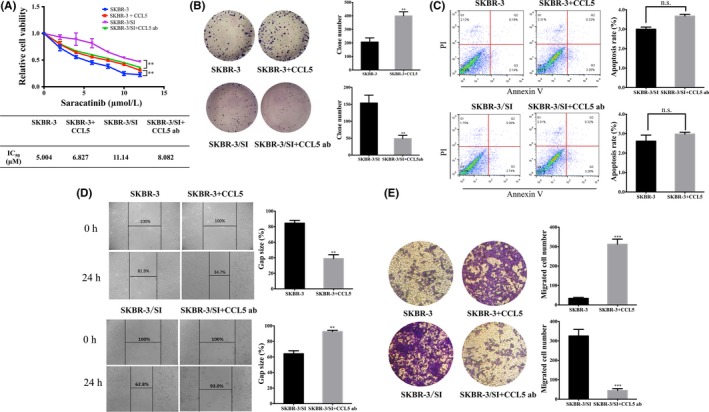
Effects of CCL5 on breast cancer cells. A, CCK8 determined cell viability in SKBR‐3 and SKBR‐3/SI cells following treatment with 10 pg/mL recombinant human CCL5 and neutralizing CCL5 ab for 72 h. IC50 values are presented in the mini‐tables. B,C, Cell proliferation and apoptosis of SKBR‐3 and SKBR‐3/SI cells treated by 10 pg/mL recombinant human CCL5 and neutralizing CCL5 ab by colony formation assay and flow cytometry, respectively. D, Wound‐healing assay indicated cell migration of SKBR‐3 and SKBR‐3/SI treated with 10 pg/mL CCL5 or neutralizing CCL5 ab. E, Migration assay of SKBR‐3 and SKBR‐3/SI treated with CCL5 or CCL5 ab was performed. The error bars represent the mean of 3 separate determinations ± SD. **P < .01, ***P < .001
3.6. PAI‐1 and CCL5 expression was higher in SKBR‐3/SI tumors compared to SKBR‐3 tumors in vivo
To widen our scope of observations in vitro, we established a xenograft mouse model to evaluate the correlation between CCL5 and PAI‐1 in vivo. As shown in Figure 6A, the mice treated with SKBR‐3/SI had a bigger tumor size compared to the SKBR‐3 group. Moreover, tumor weights in the SKBR‐3/SI group on day 42 after injection were significantly higher than in the SKBR‐3 group (Figure 6B). Figure 6C shows the HE staining of xenograft tissues and indicates that there is no difference in cell morphology between the SKBR‐3 group and the SKBR‐3/SI group. Furthermore, it was demonstrated that SKBR‐3/SI tumors showed higher PAI‐1 and CCL5 expression than SKBR‐3 tumors, consistent with our in vitro data. Besides, Ki67 stain of SKBR‐3/SI tumors was also stronger than for SKBR‐3 tumors, indicating the higher cell proliferation (Figure 6D).
Figure 6.
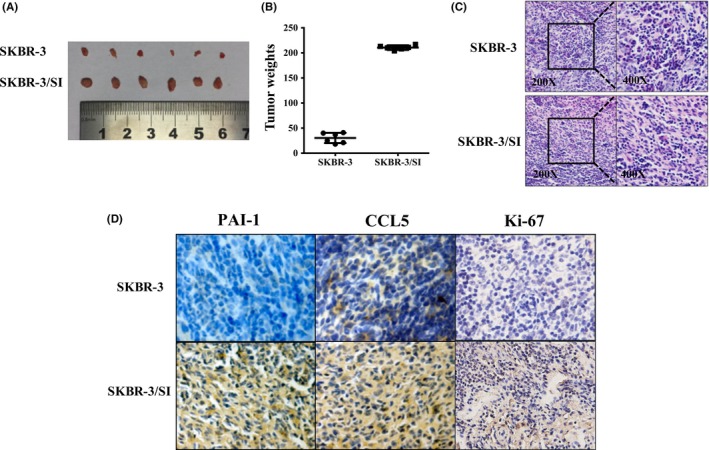
PAI‐1 and CCL5 expression was higher in SKBR‐3/SI tumors compared to SKBR‐3 tumors in vivo. A,B, The gross morphology of tumors and the final xenograft tumor weights measured on day 42 after injection of tumor cells (n = 6, **P < .01). C, The final xenograft tumor stained with routine H&E staining (200×, 400×). D, Representative images of expression of PAI‐1, CCL5 and Ki‐67 in 2 groups of tumor xenografts identified by immunohistochemistry. **P < .01
4. DISCUSSION
Nowadays, drug resistance poses a huge threat to treatment for breast cancer. Although Src inhibitors are promising in reversing resistance of HER2 antagonists in patients with HER2‐positive breast cancer, the potency of Src inhibitors is weakened by quickly acquired resistance.8, 18 In our study, we first identified the mRNA expression profile in cancer cells resistant to Src inhibitor and discovered that increased PAI‐1 might contribute to Src inhibitor resistance. Moreover, based on our previous findings, we further showed that PAI‐1 could promote saracatinib resistance by inducing the secretion of CCL5.
In breast cancer, Src is activated mainly via the ErbB family and insulin‐like growth factor‐I receptor pathways. Src signaling, which is closely associated with the ErbB family, plays a crucial role in various aspects, including tumorigenesis and tumor metastasis.5, 6, 8 Inhibitors of Src signaling pathway, such as saracatinib, have been confirmed to have significant anti‐tumor activity. In clinical experiments, Src inhibitors have continued to show promise as effective targeted therapy.6 In view of the close relationship between Src signaling and ErbB receptor, it is reasonable to combine Src inhibitor and trastuzumab to prevent trastuzumab resistance in HER2‐postive breast cancer patients.8 Regretfully, the therapeutic potential of Src inhibitor is limited by acquired resistance.19
PAI‐1 has been demonstrated to be involved in the development of tumors, contributing to tumor progression and angiogenesis. Expression of PAI‐1 has also been identified as negatively associated with the prognosis of breast cancer patients.20, 21, 22 Our recent study revealed that there might exist a positive feedback loop between PAI‐1 and CCL5 in breast cancer. PAI‐1 produced by breast cancer cells could induce CCL5 secretion from endothelial cells, which, in turn, stimulates the secretion of PAI‐1 from breast cancer cells, mutually leading to tumor progression.17 CCL5 is one of the members of the CC chemokine family of proteins, and notably CCL5 cooperating with its cognate receptor, CCR5, regulates various cell processes, including cell proliferation, motility and invasion in tumors. It has also been verified that overexpressed CCL5 facilitates tumor progression.23, 24, 25, 26 It has been reported that CCL5 can activate PI3K/Akt and STAT3 signaling pathway, which plays a vital role in tumor progression, adhesion and drug resistance.27, 28, 29, 30 Yi et al31 demonstrate that CCL5 autocrine signaling perpetuated tamoxifen resistance in breast cancer by activating STAT3. It has also been revealed that CCL5 secretion derived from cancer‐associated fibroblasts promoted ovarian cancer cell resistance to cisplatin by aberrantly activating PI3K/Akt and STAT3 signal pathways.27 Based on these studies, we speculate that saracatinib resistance induced by CCL5 may be related to the abnormal activation of these 2 pathways, but further study is required to confirm this point. Besides, T.J. Curiel and his colleagues found that ovarian cancer stem‐like cells, with the potential to develop drug resistance, displayed elevated expression of CCL5, which can recruit regulatory T cells.32 Therefore, it is supposed that upregulated CCL5 in saracatinib‐resistant SKBR‐3/SI might interact with CCR5 on the surface of regulatory T cells, eventually leading to drug resistance.
In conclusion, our findings provide reliable evidence that the overexpression of PAI‐1 contributes to Src inhibitor resistance in breast cancer via upregulating CCL5, and PAI‐1 inhibitor could reverse saracatinib resistance in saracatinib‐resistant cells. To make full use of Src inhibitor, it might be an option to combine agents targeting PAI‐1 or CCL5 with Src inhibitor.
CONFLICT OF INTEREST
The authors declare no competing financial interest.
Fang H, Jin J, Huang D, Yang F, Guan X. PAI‐1 induces Src inhibitor resistance via CCL5 in HER2‐positive breast cancer cells. Cancer Sci. 2018;109:1949–1957. https://doi.org/10.1111/cas.13593
Funding information
National Natural Science Foundation of China (grant nos. 81773102 and 81470357); Foundation for Clinical Medicine Science and Technology Special Project of the Jiangsu Province (grant no. BL2014071).
Fang and Jin equally contributed to this study.
REFERENCES
- 1. Siegel RL, Miller KD, Jemal A. Cancer statistics, 2017. CA Cancer J Clin. 2017;67:7‐30. [DOI] [PubMed] [Google Scholar]
- 2. DeSantis CE, Ma J, Sauer AG, Newman LA, Jemal A. Breast cancer statistics, 2017, racial disparity in mortality by state. CA Cancer J Clin. 2017;67:439‐448. [DOI] [PubMed] [Google Scholar]
- 3. Mitra D, Brumlik MJ, Okamgba SU, et al. An oncogenic isoform of HER2 associated with locally disseminated breast cancer and trastuzumab resistance. Mol Cancer Ther. 2009;8:2152‐2162. [DOI] [PubMed] [Google Scholar]
- 4. Su F, Geng J, Li X, et al. SP1 promotes tumor angiogenesis and invasion by activating VEGF expression in an acquired trastuzumabresistant ovarian cancer model. Oncol Rep. 2017;38:2677‐2684. [DOI] [PMC free article] [PubMed] [Google Scholar]
- 5. Thomas SM, Brugge JS. Cellular functions regulated by Src family kinases. Annu Rev Cell Dev Biol. 1997;13:513‐609. [DOI] [PubMed] [Google Scholar]
- 6. Mayer EL, Baurain JF, Sparano J, et al. A phase 2 trial of dasatinib in patients with advanced HER2‐positive and/or hormone receptor‐positive breast cancer. Clin Cancer Res. 2011;17:6897‐6904. [DOI] [PubMed] [Google Scholar]
- 7. Ishizawar R, Parsons SJ. c‐Src and cooperating partners in human cancer. Cancer Cell. 2004;6:209‐214. [DOI] [PubMed] [Google Scholar]
- 8. Rexer BN, Ham AJ, Rinehart C, et al. Phosphoproteomic mass spectrometry profiling links Src family kinases to escape from HER2 tyrosine kinase inhibition. Oncogene. 2011;30:4163‐4174. [DOI] [PMC free article] [PubMed] [Google Scholar]
- 9. Dehm SM, Bonham K. SRC gene expression in human cancer: the role of transcriptional activation. Biochem Cell Biol. 2004;82:263‐274. [DOI] [PubMed] [Google Scholar]
- 10. Bild AH, Yao G, Chang JT, et al. Oncogenic pathway signatures in human cancers as a guide to targeted therapies. Nature. 2006;439:353‐357. [DOI] [PubMed] [Google Scholar]
- 11. Chu I, Sun J, Arnaout A, et al. p27 phosphorylation by Src regulates inhibition of cyclin E‐Cdk2. Cell. 2007;128:281‐294. [DOI] [PMC free article] [PubMed] [Google Scholar]
- 12. Belsches‐Jablonski AP, Biscardi JS, Peavy DR, Tice DA, Romney DA, Parsons SJ. Src family kinases and HER2 interactions in human breast cancer cell growth and survival. Oncogene. 2001;20:1465‐1475. [DOI] [PubMed] [Google Scholar]
- 13. Takeda T, Yamamoto H, Kanzaki H, et al. Yes1 signaling mediates the resistance to Trastuzumab/Lap atinib in breast cancer. PLoS ONE. 2017;12:e0171356. [DOI] [PMC free article] [PubMed] [Google Scholar]
- 14. Luo JY, Jin J, Yang F, et al. The correlation between PARP1 and BRCA1 in AR positive triple‐negative breast cancer. Int J Biol Sci. 2016;12:1500‐1510. [DOI] [PMC free article] [PubMed] [Google Scholar]
- 15. Song W, Tang L, Xu YM, et al. PARP inhibitor increases chemosensitivity by upregulating miR‐664b‐5p in BRCA1‐mutated triple‐negative breast cancer. Sci Rep. 2017;7:44346. [DOI] [PMC free article] [PubMed] [Google Scholar]
- 16. Khunweeraphong N, Stockner T, Kuchler K. The structure of the human ABC transporter ABCG2 reveals a novel mechanism for drug extrusion. Sci Rep. 2017;7:13767. [DOI] [PMC free article] [PubMed] [Google Scholar]
- 17. Zhang W, Xu J, Fang H, et al. Endothelial cells promote triple‐negative breast cancer cell metastasis via PAI‐1 and CCL5 signaling. FASEB J. 2018;32:276‐288. [DOI] [PubMed] [Google Scholar]
- 18. Jin MH, Nam AR, Park JE, Bang JH, Bang YJ, Oh DY. Resistance mechanism against trastuzumab in HER2‐positive cancer cells and its negation by Src inhibition. Mol Cancer Ther. 2017;16:1145‐1154. [DOI] [PubMed] [Google Scholar]
- 19. Chen Y, Guggisberg N, Jorda M, et al. Combined Src and aromatase inhibition impairs human breast cancer growth in vivo and bypass pathways are activated in AZD0530‐resistant tumors. Clin Cancer Res. 2009;15:3396‐3405. [DOI] [PubMed] [Google Scholar]
- 20. Declerck PJ, Gils A. Three decades of research on plasminogen activator inhibitor‐1: a multifaceted serpin. Semin Thromb Hemost. 2013;39:356‐364. [DOI] [PubMed] [Google Scholar]
- 21. Witzel I, Milde‐Langosch K, Schmidt M, et al. Role of urokinase plasminogen activator and plasminogen activator inhibitor mRNA expression as prognostic factors in molecular subtypes of breast cancer. Onco Targets Ther. 2014;7:2205‐2213. [DOI] [PMC free article] [PubMed] [Google Scholar]
- 22. Zemzoum I, Kates RE, Ross JS, et al. Invasion factors uPA/PAI‐1 and HER2 status provide independent and complementary information on patient outcome in node‐negative breast cancer. J Clin Oncol. 2003;21:1022‐1028. [DOI] [PubMed] [Google Scholar]
- 23. Niwa Y, Akamatsu H, Niwa H, Sumi H, Ozaki Y, Abe A. Correlation of tissue and plasma RANTES levels with disease course in patients with breast or cervical cancer. Clin Cancer Res. 2001;7:285‐289. [PubMed] [Google Scholar]
- 24. Yaal‐Hahoshen N, Shina S, Leider‐Trejo L, et al. The chemokine CCL5 as a potential prognostic factor predicting disease progression in stage II breast cancer patients. Clin Cancer Res. 2006;12:4474‐4480. [DOI] [PubMed] [Google Scholar]
- 25. Velasco‐Velazquez M, Jiao XM, De la Fuente M, et al. CCR5 antagonist blocks metastasis of basal breast cancer cells. Cancer Res. 2012;72:3839‐3850. [DOI] [PubMed] [Google Scholar]
- 26. Fertig EJ, Lee E, Pandey NB, Popel AS. Analysis of gene expression of secreted factors associated with breast cancer metastases in breast cancer subtypes. Sci Rep. 2015;5:12133. [DOI] [PMC free article] [PubMed] [Google Scholar]
- 27. Zhou BO, Sun C, Li NA, et al. Cisplatin‐induced CCL5 secretion from CAFs promotes cisplatin‐resistance in ovarian cancer via regulation of the STAT3 and PI3K/Akt signaling pathways. Int J Oncol. 2016;48:2087‐2097. [DOI] [PubMed] [Google Scholar]
- 28. Huang CY, Fong YC, Lee CY, et al. CCL5 increases lung cancer migration via PI3K, Akt and NF‐kappaB pathways. Biochem Pharmacol. 2009;77:794‐803. [DOI] [PubMed] [Google Scholar]
- 29. Tang CH, Yamamoto A, Lin YT, Fong YC, Tan TW. Involvement of matrix metalloproteinase‐3 in CCL5/CCR5 pathway of chondrosarcomas metastasis. Biochem Pharmacol. 2010;79:209‐217. [DOI] [PubMed] [Google Scholar]
- 30. Wang SW, Wu HH, Liu SC, et al. CCL5 and CCR5 interaction promotes cell motility in human osteosarcoma. PLoS ONE. 2012;7:e35101. [DOI] [PMC free article] [PubMed] [Google Scholar]
- 31. Yi EH, Lee CS, Lee JK, et al. STAT3‐RANTES autocrine signaling is essential for tamoxifen resistance in human breast cancer cells. Mol Cancer Res. 2013;11:31‐42. [DOI] [PubMed] [Google Scholar]
- 32. Curiel TJ, Coukos G, Zou L, et al. Specific recruitment of regulatory T cells in ovarian carcinoma fosters immune privilege and predicts reduced survival. Nat Med. 2004;10:942‐949. [DOI] [PubMed] [Google Scholar]


