

SUMMARY
Cancer metastasis accounts for the majority of cancer-related deaths and remains a clinical challenge. Metastatic cancer cells generally resemble cells of the primary cancer, but they may be influenced by the milieu of the organs they colonize. Here, we show that colorectal cancer (CRC) cells undergo metabolic reprogramming after they metastasize and colonize the liver, a key metabolic organ. In particular, via GATA6, metastatic cells in the liver up-regulate the enzyme aldolase B (ALDOB), which enhances fructose metabolism and provides fuel for major pathways of central carbon metabolism during tumor cell proliferation. Targeting ALDOB or reducing dietary fructose significantly reduces liver metastatic growth but has little effect on the primary tumor. Our findings suggest that metastatic cells can take advantage of reprogrammed metabolism in their new microenvironment, especially in a metabolically active organ such as the liver. Manipulation of involved pathways may impact the course of metastatic growth.
eTOC blurb
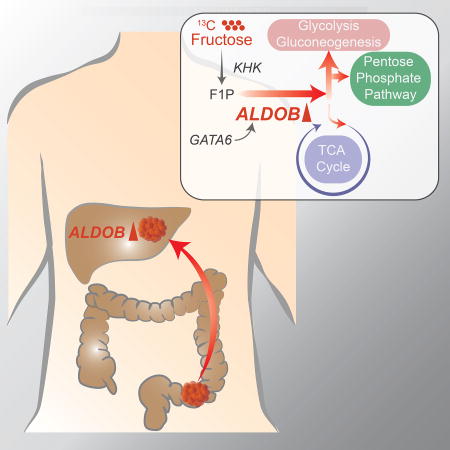
XXX et al show that, during colonization of the liver, the liver environment can cause colon cancer cells (CRC) to undergo metabolic reprogramming by upregulating aldolase B, which enhances fructose metabolism and promotes growth of CRC liver metastases. Targeting aldolase B or reducing dietary fructose reduces liver metastasis growth.
INTRODUCTION
Primary tumors gradually accumulate genetic alterations and are influenced by their microenvironment until they acquire the ability to metastasize to distant organs (Gupta and Massague, 2006; Valastyan and Weinberg, 2011). Typical of this process, CRC progresses through an adenoma-to-carcinoma sequence that eventually leads to metastasis (Barker et al., 2009; Clevers, 2006), preferentially (~70% patients) to the liver (Rothbarth and van de Velde, 2005). At this phase, the disease becomes challenging to treat and eventually develops resistance to most forms of combination therapy, making CRC metastasis a leading cause of cancer-related deaths (Andre et al., 2004; Meyerhardt and Mayer, 2005). Patients with inoperable liver metastasis respond poorly to chemotherapeutic intervention and have a median survival of 6 to 9 months (Alberts et al., 2005). Liver lesions have also been shown to seed tertiary tumors in the lungs of patients (Nguyen et al., 2009).
Current chemotherapy for advanced CRC does not target liver metastases specifically. This is partly based on observations that CRC metastases are not consistently associated with any specific genetic mutations (Jones et al., 2008) and that they generally resemble cells in the primary tumor. However, emerging evidence suggests that non-genetic alterations, such as epigenetic and metabolic reprogramming, may promote cancer metastasis (Dupuy et al., 2015; LeBleu et al., 2014; Loo et al., 2015; Piskounova et al., 2015; Ragusa et al., 2014; Singovski et al., 2015; Wu et al., 2015). Targeting such mechanisms may provide a new way to develop therapeutics against metastasis.
In this study, data from both clinical samples and an in vivo CRC metastasis model via cecum transplantation suggest that specific metabolic pathways are altered in CRC liver metastases. In particular, liver metastases upregulate ALDOB, an enzyme involved in fructose metabolism. Intrahepatic implantation indicates that the liver environment causes CRC cells to upregulate ALDOB. Metabolomics and 13C-labeled fructose tracing studies indicate that ALDOB promotes fructose metabolism to fuel glycolysis, gluconeogenesis and the pentose phosphate pathway. ALDOB knockdown or dietary fructose restriction suppresses growth of CRC liver metastases, but not primary tumors or lung metastases, highlighting the importance of tumor microenvironment.
RESULTS
Meta-analysis of Clinical CRC Liver Metastases
We identified four NCBI Gene Expression Omnibus (GEO) databases that contain transcriptomic profiles of 102 normal colon, 254 primary CRC, and 111 CRC liver metastasis samples (Barrett et al., 2013; Del Rio et al., 2013; Pizzini et al., 2013; Sheffer et al., 2009; Stange et al., 2010) (Table S1A). 90 matched samples (normal colon, primary CRC, liver metastasis) from 30 Stage IV CRC patients from these datasets were selected and processed by standard GEO2R analysis, followed by quantile normalization and log2 transformation. Paired differential analysis comparing matching normal colon tissues and primary CRC samples identified a set of differentially expressed genes, about 9.5% of which are involved in metabolic pathways (Figure 1A). In comparison, 23% of differentially expressed genes between matching primary CRC and liver metastasis are metabolism related, and more than 90% of the differentially expressed metabolic genes are upregulated in the liver metastases (Figure 1B). We also found 9 matched normal liver and liver metastasis samples from two of the GEO datasets (GSE14297 and GSE41258), which showed significant differences in metabolite levels (Figure 1C). Gene Set Enrichment Analysis (GSEA) between primary CRC and liver metastasis samples suggested highly altered activity levels in certain metabolic pathways (Figure 1D) including glycolysis/gluconeogenesis, amino acid metabolism, and fructose and mannose metabolism. This meta-analysis across independent clinical datasets and platforms suggests potential metabolic reprogramming between primary CRC and liver metastasis.
Figure 1. Comparison of metabolic states of primary CRC and liver metastasis.

(A and B) Volcano plots of differential metabolic gene expression between paired normal colon and primary CRC (A) and paired primary CRC and liver metastases (B) samples from 30 CRC liver metastasis patients selected from 4 public GEO datasets (Table S1A). (C) Volcano plots of differential metabolic gene expression between paired CRC liver metastases and normal liver samples from 9 CRC liver metastasis patients selected from GSE41258 and GSE14297 (Table S1A). Each circle represents a gene. Red color refers to significantly upregulated genes (p value < 0.05 and fold change >2) while blue color refers to significantly downregulated genes (p value < 0.05 and fold change >2). (D) Gene Set Enrichment Analysis (GSEA) of upregulated metabolic pathways in liver metastases based on comparison of the paired samples. (E) Heatmap of metabolite clusters in primary colon tumor and liver metastases measured by LC-MS based metabolomics. (F) Representation of the upregulated glycolysis/gluconeogenesis (top) and pentose phosphate (bottom) pathways and MS peak intensity of their corresponding intermediate metabolites. *, p<0.05; ***, p<0.001. p-value was calculated based on linear model. (G) Integrated pathway analysis of transcriptomic and metabolomics data. The significantly enriched (p value < 0.05, fold change >1) genes from RNA-seq and significantly enriched (p value < 0.05, fold change >1) metabolites from metabolomics comparing liver metastases samples to primary tumor samples were integrated by combining hypergeometric test for enrichment analysis and degree centrality in topology analysis based on gene-metabolite pathways using Metabolyst. The identified enrichment pathway list is compared with the clinical enriched pathway (Figure 1D) and the consistently enriched pathways are shown. x axis: p values from hypergeometric test, y axis: hits refers to the number of upregulated metabolites/genes overlapping with the ones in the metabolic pathway. Color bar refers to the topology analysis that calculates the importance of the genes and metabolites on its position within a metabolic pathway based on degree centrality. See also Figure S1.
Analysis of 186 primary tumor samples, 47 liver metastatic samples, and 20 lung metastatic (unmatched) samples in the GSE41258 CRC dataset (Sheffer et al., 2009) suggests that liver metastases and lung metastases have distinct transcriptomic signatures (Figure S1A). There is little overlap between genes up- or down-regulated in liver vs. lung metastases (Figure S1B). Pathway analysis indicates that more metabolic pathways are upregulated in liver metastases compared to lung metastases (Figure S1C).
Integrated Metabolomics and Transcriptomics Analysis of a CRC Liver Metastasis Model
Next, we used an in vivo CRC metastatic model by injecting mCherry- and luciferase-labeled HCT116 cells into NOD/SCID mice to study how the microenvironment affects CRC cell metabolism (Bu et al., 2015). Five weeks after injection, primary, liver metastatic and lung metastatic tumors were harvested and processed for metabolomics using a high-resolution, Q Exactive liquid chromatography-mass spectrometry (LC-MS) platform and bioinformatics analytical workflow (Liu et al., 2014). Analysis shows the presence of distinct metabolite clusters in primary tumors vs. liver metastases (Figure 1E, supplemental item Table S6). Differential analyses identified metabolites with significantly altered levels in liver metastases relative to primary tumors (Figure S1D). For example, metabolites of the glycolysis/gluconeogenesis and pentose phosphate pathways were upregulated in liver metastases (Figure 1F). Differential analysis, metabolite set enrichment analysis (MSEA), and similarity matrix analysis of metabolites suggest that the lung and liver environments regulate CRC cell metabolism differently, consistent with transcriptomic analyses of the clinical GEO datasets (Figures S1D–S1F).
RNA-seq was then performed to measure expression levels of the involved metabolic enzymes. To remove stromal cells, HCT116 cells were purified from ceca and livers of tumor-bearing mice based on mCherry expression using fluorescence-activated cell sorting (FACS) (Figure S1G). RNA-seq measurements were then carried out on the purified CRC cells (Figure S1H).
Integrated analysis of transcriptomics and metabolomics data identified metabolic pathways that were likely altered in CRC cells from liver metastases compared to primary tumors, which were further validated by the GEO datasets to highlight clinically relevant pathways (Figures 1G, S1I and Table S1B). For example, glycolysis, gluconeogenesis, fructose metabolism, and pentose phosphate pathways seem to be upregulated in CRC cells from liver metastases. Pathways that only contained alterations in metabolite levels but not in enzyme expression were not included as such metabolite differences could have occurred within the lesion’s stromal cells rather than the CRC cells. Altogether, the analyses suggest that CRC cells in the liver have multiple metabolic alterations compared to their counterparts in the primary tumor.
ALDOB is Upregulated in Liver Metastases
Among the altered metabolic pathways, we considered fructose metabolism to be quite unique. While the intestine may be a major site of fructose metabolism at low doses of fructose, at high doses, the liver is likely the major site of fructose metabolism (Hannou et al., 2018; Jang et al., 2018). Moreover, at high fructose consumption rates, fructose metabolism within the liver has been implicated in multiple fructose-induced chronic metabolic diseases (Cantley, 2014; Hannou et al., 2018; Softic et al., 2017). Fructose contributes to de novo glucose production by providing substrate that enters glycolytic/gluconeogenic carbon pools at the triose kinase-mediated step. Fructose is first metabolized by ketohexokinase (KHK) to fructose-1-phosphate which is converted into glyceraldehyde and dihydroxyacetone phosphate (DHAP) in a reversible reaction catalyzed by ALDOB. Glyceraldehyde is then phosphorylated by the triose kinase and the resulting glyceraldehyde-3-phosphate (GAP) can either serve as a glycolytic substrate or condense with DHAP into F1,6BP through the action of ALDOB to enter the gluconeogenic pathway (Feinman and Fine, 2013). As one of the three aldolase isoforms (A, B, and C), ALDOB shows comparable activity toward F1P and F1,6BP and participates in both glycolysis and gluconeogenic pathways (Penhoet et al., 1966) (Figure S2A). ALDOB is in part rate-limiting for fructose metabolism within the liver as shown by large increases in F1P levels in the liver after administration of large fructose loads (Kim et al., 2016; Niewoehner et al., 1984).
ALDOB was among the top metabolic genes identified in our meta-analysis of matched samples in the GEO dataset (Table S1C). The metabolites involved with ALDOB as shown in Figure S2A were significantly upregulated in liver metastases (Figure 1F). A paired differential analysis of 90 matched samples from 30 patients confirmed that ALDOB is consistently upregulated in liver metastasis compared to matched normal colon and primary CRC (Figure 2A). On the other hand, the aldolase A (the aldolase isoform that is not specific to fructose metabolism), KHK, HK1, HK2 and GLUT5 (fructose transporter) levels remained largely unchanged (Figure 2A). Analysis of the 9 matching liver metastasis and normal liver samples in GSE14297 and GSE41258 suggest that ALDOB and KHK levels are even higher in normal liver, while ALDOA, HK1, and HK2 levels are higher in liver metastasis (Figure S2B). Analysis of the unmatched 186 primary, 47 liver, and 20 lung CRC samples from GSE41258 confirmed that ALDOB is upregulated in liver metastasis but not in lung metastasis, while aldolase A, KHK, HK1, HK2 and GLUT5 levels remain unchanged between primary and metastatic samples (Figure S2C).
Figure 2. Liver metastases upregulate ALDOB.

(A) Paired box plots comparing expression levels of ALDOB, ALDOA, KHK, HK1, HK2 and GLUT5 between matched samples of normal colon, primary CRC, and liver metastases from 30 patients in 4 GEO datasets (Table S1A). Dots refer to different samples, and lines connect the paired samples. Different colors refer to different datasets. ***, p<0.001. p-values were calculated based on paired linear model using Limma. (B) Analysis of the expression levels of ALDOB, ALDOA, KHK, HK1, HK2 and GLUT5 in 39 primary colon carcinoma, 74 liver metastatic and 8 lung metastatic samples from stage IV CRC patients in GSE41568. p-values were calculated based on linear model using Limma. ***, p<0.001. See also Figure S2.
To further confirm ALDOB upregulation in CRC liver metastases, we meticulously collected and carried out microarray measurements on 39 primary colon carcinoma, 74 liver metastatic, and 8 lung metastatic samples from stage IV CRC patients at Duke Oncology Center (Table S2, GSE41568). Gene expression analysis indicated upregulation of ALDOB (log(fc)=3.75, p=5.03E-08) in liver metastases compared to primary tumors, while there was no significant difference in the levels of aldolase A, HK1, HK2, and GLUT5 (Figure 2B). In this dataset, KHK level was also increased in liver metastases. Pathway enrichment analysis of this dataset highlights carbohydrate, glycolysis, gluconeogenesis, and pentose phosphate pathways in liver metastases (Figure S2D). ALDOB and the other enzymes are not upregulated in the lung metastases (Figure 2B), consistent with previous analyses of the GSE41258 dataset. Last, we performed differential analysis (unpaired) for ALDOB in all five GEO datasets respectively, including matched and unmatched samples, which again showed that ALDOB is consistently upregulated in liver metastases (Table S3A). We then compared the ALDOB protein levels in CRC liver metastases and adjacent normal liver tissues from four CRC patients (Table S3B). ALDOB protein levels are higher in normal liver than in CRC liver metastasis in 3 out of the 4 cases (Figure S2E). Taken together, clinical CRC liver metastasis upregulates ALDOB compared to primary tumor, although the levels are still lower than those of normal hepatocytes.
Liver metastases upregulate ALDOB
To confirm ALDOB upregulation in liver metastases, we implanted three CRC cell lines – HCT116 and two liver metastatic patient-derived xenograft (PDX) cell lines, CRC119 and CRC57, into the cecum termini of NOD/SCID mice (Cespedes et al., 2007; Fu et al., 1991) (Table S4). The cells carried dual-labeled reporter constructs, stably expressing fluorescence protein (mCherry or GFP) and luciferase. Before cecal injection, FACS analysis showed single peaks in terms of KHK, ALDOB and HK expression in these CRC lines (Figure S3A). After cecal injections, the CRC cells first formed orthotopic tumors within 2 weeks. They subsequently developed CRC liver metastases in 5 weeks. After both primary cecal tumors and liver metastases were harvested, CRC cells were isolated by FACS based on fluorescence (Figures 3A and S3B). Liver metastases had significantly higher ALDOB levels than their primary counterparts, while KHK and HK levels remained largely unchanged (Figures 3B–3D). 20% to 40% of the mice also developed lung metastases, although ALDOB was not upregulated in lung metastases compared to the primary cecum tumors (Figure S3C).
Figure 3. Liver metastasis upregulates ALDOB in vivo.

(A) Schematic and representative IVIS luciferase in vivo images of the orthotopic/metastatic cecum injection mouse model. (B-D) Western blot showing ALDOB expression increased in liver metastases compared to primary cecum tumors derived from cecum-injected HCT116 (B), CRC119 (C) and CRC57 (D) cells. (E) Schematic and representative IVIS luciferase in vivo images of simultaneous cecum and intrahepatic injection mouse model. (F-H) Western blot showing higher ALDOB expression in liver tumors than in cecum tumors from HCT116 (F), CRC119 (G) and CRC57 (H) cells. (I) Schematic of GATA6 binding motif in ALDOB promoter. (J) ChIP-qPCR showing enrichement of GATA6 binding to the ALDOB promoter in CRC cells isolated from liver metastases compared to those from primary cecum tumors. Signals were normalized with Actin (input). The fold changes were calculated by normalized with IgG control antibody. (K) Western blot showing upregulation of ALDOB in response to fructose under hypoxia is dependent on GATA6. (L) Western blot showing GATA6 expression in response to fructose under hypoxia. (M) ChIP-qPCR showing enrichment of GATA6 binding to the ALDOB promoter in CRC cells in response to fructose under hypoxia. Signals were normalized by Actin (input). The fold changes were calculated based on normalization with IgG control antibody. Error bars denote s.d. of triplicates. *, p<0.05; ***, p<0.001. See also Figure S3
To investigate whether the liver environment can cause ALDOB upregulation in CRC cells, we injected HCT116, CRC119, and CRC57 cells directly into the mouse liver and cecum simultaneously. CRC tumors promptly formed in the livers and ceca, and we harvested the respective tumors 10 days after the injection before metastases from cecum to liver could form, which takes 3~5 weeks in the cecum-injection model (Figure 3E). From the harvested tumors, CRC cells were isolated by FACS based on fluorescence. Western blot confirmed higher ALDOB levels in CRC cells isolated from the liver than from the cecum, while KHK and HK levels remained similar (Figures 3F–3H). On the other hand, migrated and non-migrated CRC cells in the transwell migration assay expressed similar ALDOB levels, suggesting that ALDOB is not associated with enhanced migration capability (Figures S3D–S3G). Furthermore, after being cultured in vitro, disassociated tumor cells from liver and cecum express similar ALDOB levels (Figure S3H). Taken together, these data suggest that the liver environment can cause CRC cells to upregulate ALDOB.
We analyzed 2kb sequences of the ALDOB promoter and identified a putative GATA6 binding motif at −255 to −262 (Figure 3I). GATA6 expression has been reported to be associated with poor prognosis and liver metastasis (Shen et al., 2013). ChIP-qPCR was then performed to validate this putative GATA6 binding motif, which showed that GATA6 binding to the ALDOB promoter was significantly enriched in CRC cells isolated from the liver relative to cells isolated from the cecum (Figures 3J and S3I). We then cultured CRC cells in medium containing a range of fructose concentrations (0–40mM and 0–2mM). As shown by Western blot, ALDOB levels were upregulated by fructose in a dose dependent manner, which was abrogated by GATA6 knockdown. This indicates that ALDOB upregulation in response to fructose is dependent on GATA6 (Figures 3K, S3J–S3L). GATA6 levels responded to fructose levels more modestly (Figures 3L and S3M), and GATA6 binding to the ALDOB promoter was significantly enriched in response to fructose (Figure 3M). Altogether, CRC liver metastasis upregulates ALDOB, which also responds to fructose levels in a GATA6-dependent manner.
ALDOB enhances fructose metabolism
The products of ALDOB-mediated reactions could contribute to glucose, glycogen, lactate, and lipid synthesis, all essential for sustaining highly proliferative cells. Fructose metabolism could also enhance glycogen and lipid deposition (Stanhope et al., 2009). Immunohistochemical staining with periodic acid Schiff (PAS) with amylase digestion or Oil Red O on tumor and normal tissues from primary and metastatic lesions suggest liver metastases have higher glycogen accumulation and lipid deposits (Figures S3O–S3R).
We then purified HCT116 cells from the liver metastases based on mCherry expression (LV-HCT116) and studied phenotypic changes in these cells by measuring cellular energetics parameters including extracellular acidification rate (ECAR, indicative of lactate production from glycolytic energy metabolism) and oxygen consumption rate (OCR, indicative of mitochondrial respiration) in the presence or absence of 11mM fructose. The cells showed a significant increase in ECAR and no change in OCR, which suggests that liver-derived CRC cells are capable of utilizing fructose to perform glycolytic functions, whereas cecum-derived CRC cells did not show significant increase in ECAR (Figure S3S).
To assess the contribution of ALDOB to cell growth and metabolism, we ectopically expressed ALDOB as well as knocked down ALDOB in CRC cells using two shRNAs and validated the knockdown and overexpression efficiencies by Western blot (Figures S4A–S4B). ALDOB overexpression or knockdown significantly affected CRC cell proliferation in fructose-containing but not glucose-containing media with dialyzed FBS (Figure S4C), suggesting that ALDOB plays an important role in fructose metabolism for CRC cell growth.
We performed stable isotope tracing analysis by adding [U-13C] fructose to culture medium with dialyzed FBS and tracing the labeled 13C in metabolites using Gas Chromatography Mass Spectrometry (GC-MS). We performed tracing on control (WT), ALDOB knockdown (KD), and ALDOB overexpression (OE) cells (Figures 4, S4D–S4F).
Figure 4. ALDOB regulates fructose metabolism.

Tracing analysis using 13C labeled fructose by GC-MS. 13C labeled carbon was analyzed after cells were incubated in 13C labeled fructose-containing medium (8 mM [U-13C] fructose, 0 mM glucose) for 24 hours. WT: control; OE: ectopic ALDOB expression. The bar diagrams show the abundance (%) of isotopomers of glucose (M+5), ribose (M+4), pyruvate (M+3), alanine (M+3), citrate (M+2), glutamate (M+2), malate (M+2) and aspartate (M+2). The abundance represents the percentage of the corresponding isotopomer (e.g. pyruvate M+3) among all isotopomers of the metabolite (e.g. pyruvate: M+0, M+1, M+2, M+3). The isotopomer distributions have been corrected for natural isotope abundances. Error bars denote s.d. of triplicates. p-values were calculated based on Student's t-test. **, p<0.01; ***, p<0.001. The schematic diagrams show the corresponding isotopomer transition from 13C labeled fructose, and the red circles represents the number of detected 13C labeled carbons in the intermediate metabolites. For glucose and ribose, the fragmentation in mass spectrometry resulted in the loss of one carbon, therefore the bar diagrams denote M+5 for glucose and M+4 for ribose. See also Figure S4.
As fructose enters glycolysis at the triose phosphate level, it contributes to lower glycolysis, as illustrated by enrichments in label incorporation of pyruvate, the terminal intermediate of glycolysis (Figures 4 and S4D). Label incorporation of Alanine, an amino acid closely downstream of pyruvate, is also enriched (Figures 4 and S4D). Label incorporation of M+2 citrate indicates that fructose contributes directly to acetyl CoA entry into the TCA cycle (Figures 4 and S4D). M+2 label incorporation decreases several folds from citrate to glutamate, and M+3 aspartate is ≤1% for all conditions tested, suggesting that pyruvate anaplerosis through carboxylation into the TCA cycle is minimal and that glutamine in the medium is likely the predominant anaplerotic carbon source (Figures 4 and S4D). The levels of label incorporation among measured metabolites were largely similar between the hypoxia and normoxia conditions (Figure S4G).
To assess whether upper glycolytic intermediates (e.g. G6P) and nucleotide precursors (e.g. ribose-5-phosphate) were labeled from [U-13C] fructose, we hydrolyzed cell pellet-derived glycogen and RNA into the monomer sugars (glucose and ribose, respectively) and measured the 13C-enrichment. Both glucose and ribose displayed enrichment from [U-13C]fructose (fragmentation in mass spectrometry results in loss of one carbon from the sugar, hence M+5 for glucose and M+4 for ribose, see methods (Long et al., 2016; McConnell and Antoniewicz, 2016)) (Figure 4). Other sugar monomers were also labeled (Figure S4E). Hence fructose is a source for upper glycolytic and the pentose phosphate pathway intermediates. Label incorporation of fatty acids was also observed (Figure S4H), indicating that the M+2 citrate may contribute to cytosolic acetyl-CoA pool for de novo lipogenesis.
Ectopic ALDOB expression (OE) greatly enhanced label incorporation of the above metabolites (Figures 4 and S4D–S4E), whereas ALDOB knockdown reduced label incorporation, with some (e.g., ribose) below detection limits (Figure S4F). Therefore, ALDOB promotes the contribution of fructose to major pathways of central carbon metabolism (glycolysis/gluconeogenesis, PPP, and Pyruvate entry into TCA).
ALDOB promotes growth of CRC liver metastases
ALDOB knockdown in HCT116, CRC119, and CRC57 cells did not affect CRC cell migration cultured in either glucose- or fructose-containing medium in vitro (Figures S5A–S5F). However, while cecal transplanted HCT116, CRC119, or CRC57 cells with control vectors developed liver metastases efficiently (5 out of 5 mice for all three cell lines), ALDOB knockdown suppressed CRC liver metastasis in the cecum injection model. Injected HCT116, CRC119, or CRC57 cells with ALDOB knockdown by shRNA1 developed detectable liver metastases in only 2, 2, and 2 out of 5 mice respectively and 2, 1, and 2 out of 5 mice by shRNA2 respectively (Figures 5A–5E). Furthermore, the liver metastases grown from ALDOB knockdown cells were far fewer and much smaller than those grown from control cells. We then performed intrahepatic injection to see whether ALDOB promotes CRC growth in the liver. HCT116, CRC119, and CRC57 cells with control vectors grew significantly bigger tumors than cells with ALDOB knockdown in the liver (Figures 5F–5H). Ki67 staining indicated that loss of ALDOB decreased proliferative rates of tumor cells in the liver (Figure 5I). ALDOB knockdown did not seem to affect CRC lung metastasis in the cecum injection model—control cells and ALDOB knockdown cells developed similar number of lung metastases (1–3 out of 5 mice). Additionally, the sizes of the metastatic lung lesions were similar between the control group and the ALDOB knockdown group (Figures S5G–S5I). We then used an alternative lung metastasis model via tail vein injection of the control and ALDOB knockdown cells. All 5 mice injected with either control cells or ALDOB knockdown cells developed lung metastases of similar sizes (Figures S5J and S5K).
Figure 5. Silencing of ALDOB suppresses CRC liver metastasis.

(A) Schematic of the cecum injection model. (B-E) Analysis of CRC liver metastasis in mice with cecum injection of HCT116, CRC119, and CRC57 cells carrying dual luciferase/fluorescent reporter constructs. Representative IVIS luciferase in vivo images (B), bright field and fluorescent images of livers, and quantification of liver metastasis (C–E) show ALDOB knockdown suppressed liver metastasis. (F) Schematic of the intrahepatic injection model. (G and H) Analysis of CRC growth in liver with intrahepatic injection of HCT116, CRC119, and CRC57 cells carrying dual luciferase/fluorescence reporter constructs. Representative IVIS luciferase in vivo images (G) and bright-field and fluorescent images of livers (H) show ALDOB knockdown suppressed CRC growth in the liver. (I) Representative Ki67 staining images and percentage of Ki67+ cells in CRC liver metastases showing ALDOB knockdown suppressed CRC cells proliferation in the liver. Error bars denote s.d. of 5 mice per group. ***, p<0.001. p-values were calculated based on one-way ANOVA. See also Figure S5 and S6.
To take into consideration the effect of host immune system, we knocked down ALDOB in the mouse CRC cell line CT26 and injected them into immunocompetent BALB/c mice. Both cecum injection and intrahepatic injection models confirmed that loss of ALDOB suppressed CRC growth in the livers of immunocompetent mice compared to the control groups (5 mice per group) (Figures S5L–S5P). Ki67 staining indicated that loss of ALDOB decreased proliferation of CT26 cells in the liver (Figures S5Q and S5R).
GATA6 knockdown also suppressed CRC liver metastasis in the cecum-injection model, consistent with its role in regulation of ALDOB (Figures S5S–S5U). However, GATA6 levels in the clinical GEO datasets were not significantly different between primary colon tumor and liver metastases (Figure S5V). The correlations between GATA6 and ALDOB expression in the matching liver metastases, primary colon tumor, and normal colon were not very high either (Figure S5W). Therefore, although both ALDOB and GATA6 knockdowns suppress liver metastasis, ALDOB is more specific to liver metastasis.
Targeting fructose metabolism suppresses liver metastases
We next considered whether manipulating the level of fructose intake would impact tumor growth specifically in the liver. After cecum injection (5 mice per group), mice fed with a regulated diet with high fructose showed increased CRC liver metastases, while mice fed with a regulated diet devoid of fructose showed reduced liver metastases relative to the control mice (Figures 6A–6D and Table S5). We subsequently combined the two treatments. Mice were injected with ALDOB knockdown followed by a regulated diet devoid of fructose, which suppressed liver metastases as expected (Figures 6A–6D). Cecum injection of CT26 cells into immunocompetent BALB/c mice showed similar results regarding the effect of fructose diets on liver metastases (Figures S6A and S6B). Consistently, high fructose diets reduced mouse survival, while low fructose diet and ALDOB knockdown prolonged mouse survival. The survival benefits were stronger in the intrahepatic injection model than in the cecum-injection model, presumably because the latter group was already dying from their cecum tumors, which were largely unaffected by fructose diet or ALDOB knockdown (Figures 6E and S6C–S6F). Consistent with ALDOB knockdown, high fructose diet or fructose restriction did not affect lung metastasis in both the cecum injection and the tail vein injection model (Figures S5G–S5K).
Figure 6. Dietary fructose restriction suppresses CRC liver metastasis.

(A) Representative IVIS luciferase in vivo images of mice with CRC cell HCT116, CRC119 and CRC57 injected in cecum and fed with a regular diet (Normal), a fructose-high diet (High), a fructose-restricted diet (Low), or a fructose restricted diet + ALDOB knockdown (Low+ALDOB KD). (B-D) Bright field and fluorescent images of liver tissue from the mice in (A). Liver metastasis was quantified using the Image J software. Error bars denote s.d. of 5 mice per group. p-values were calculated based on one-way ANOVA. (E) Survival curves of mice intrahepatically injected with CRC cells and fed with a regular diet (Normal), a fructose-high diet (High), a fructose-restricted diet (Low), or a fructose restricted diet + ALDOB knockdown (Low+ALDOB KD). p value was calculated in comparison with normal diet group on the base of log-rank test. **, p<0.01; ***, p<0.001. See also Figure S5 and S6; Table S5.
We measured insulin, glucose, and fructose in mice fed with the three diets. Insulin levels in plasma and liver were somewhat similar among the three diets, although fructose diets slightly reduced insulin levels in the liver (Figures S6G and S6H). Glucose levels in plasma were also similar among the three groups (Figure S6I), while the fructose level was only high in the group fed with fructose rich diet (Figure S6J). However, despite fructose in the plasma, little fructose was detected in the liver tissues (< 0.2 nmol/mg tissue) in all three groups (Figures S6K and S6L). Fructose might have been rapidly converted to F1P by the abundant KHK from hepatocytes in the liver homogenates when we sampled, pulverized and homogenized the entire liver. This would be consistent with previous reports that F1P levels increase 10-fold to around 1 mM within 10 minutes after fructose ingestion and remain elevated for several hours in rodent liver (Niewoehner et al., 1984).
We then validated the role of ALDOB in promoting CRC tumor growth in the liver using an alternative model. For this we generated HCT116 lines (LV-HCT116) that exhibited specific tropism to the liver through sequential passaging in the livers of NOD/SCID mice. ALDOB knockdown was carried out by transfecting LV-HCT116 cells with the same shRNA constructs. Consistent with the cecum injection model, ALDOB knockdown and fructose restriction suppressed CRC tumor in the liver (Figures S6M–S6R). With regard to suppression of LV-HCT116 tumors in the liver, ALDOB knockdown and fructose restriction seem to be more effective than 5-Fluorouracil or Oxaliplatin, both of which are frontline chemotherapy for advanced and metastatic CRC (Figures S6S–S6V) (Alberts et al., 2005; Andre et al., 2004). Unlike ALDOB knockdown or fructose-restricted diet, 5-Fluorouracil or Oxaliplatin provided little benefit in terms of tumor suppression or survival. Hence, targeting ALDOB and fructose metabolism has the potential to impact the growth of liver metastases and to complement current chemotherapies.
DISCUSSION
Current CRC chemotherapies do not distinguish the site of metastasis. However, CRC cells may have to adjust to the metabolic environment in the liver after they migrate there from the colon. We show that metastatic CRC cells are capable of adjusting to nutrient changes in their colonized organ. Metastatic CRC cells upregulate ALDOB in the liver, which promote fructose metabolism to boost the central carbon metabolism. Silencing of ALDOB or dietary fructose restriction suppresses CRC liver metastasis. Targeting fructose metabolism presents a potentially interesting strategy to treat CRC liver metastasis.
Current CRC chemotherapies tend not to distinguish the organ environment of metastatic lesion. Our work suggests that metastatic cancer cells are capable of adjusting their metabolism to become more similar to the colonized organ. The specialized metabolism that occurs in the liver presents a particularly intriguing case, given that liver is not only an important organ for CRC metastasis, but also a common metastatic site for breast, lung, kidney, esophageal, melanoma, ovarian, uterine, pancreatic, and stomach cancer, among others. For example, liver-metastatic breast cancer cells increase PDK1 expression and exhibit an enhanced glycolytic phenotype compared to bone- or lung-metastatic cells (Dupuy et al., 2015). We analyzed GEO datasets containing breast and pancreatic cancer primary tumors and liver metastases (Desai et al., 2013; Moffitt et al., 2015; Tobin et al., 2015; Van den Broeck et al., 2012; Weigelt et al., 2005). Differential analysis found ALDOB upregulation in liver metastases (Figure S6W). Fructose restriction also reduced liver metastasis of a breast cancer cell line (MDA-MB-231) (Figure S6X). Our study raises the question as to whether the liver milieu contributes to its ability to host metastases from diverse cancers that retain the potential to upregulate ALDOB once resident in the liver. Fructose restriction and blocking fructose-related enzymes may be a viable strategy to suppress liver metastasis of other cancer types.
LIMITATIONS OF STUDY
Mutations in the human ALDOB gene give rise to hereditary fructose intolerance (HFI), which is phenocopied by ALDOB knockout in mice (Oppelt et al., 2015). HFI patients develop liver diseases and may experience liver failure after fructose consumption, suggesting that accumulation of F1P may be toxic to the liver. Therefore, therapeutically targeting ALDOB may cause toxic side effects unless patients abide by dietary fructose restriction. An alternative is to target the upstream enzyme KHK, which catalyzes the first step that converts fructose to F1P. Targeting KHK instead of ALDOB is more specific to fructose metabolism and prevents F1P-induced toxicity (Lanaspa et al., 2013).
Fructose may not act solely as a carbon source to stimulate tumor cell proliferation. Fructose may also activate other pro-growth metabolic and signaling pathways. F1P can upregulate hexokinase glucokinase (GCK) and pyruvate kinase, which promote glycolysis (Hannou et al., 2018). Fructose enzymes have also been shown to regulate hepatic secretion of FGF21, which regulates energy, glucose, and lipid homeostasis (Fisher et al., 2017). Therefore, fructose metabolism may amplify its effect by stimulating tumor cells to metabolize other nutrients available in the liver.
The impact of fructose on CRC liver metastasis may not be limited to tumor cells alone. Fructose-enriched diets can induce liver damage, obesity, glucose intolerance, hepatomegaly, and nonalcoholic fatty liver disease in animal models (Kavanagh et al., 2013; Kawasaki et al., 2009; Softic et al., 2017; Vos and Lavine, 2013). Fructose may enhance the progression of nonalcoholic fatty liver disease and clinical liver fibrosis, which are risk factors for liver cancer (Abdelmalek et al., 2012; Abdelmalek et al., 2010). Hence, diets high in fructose may disrupt normal liver homeostasis to create a more conducive environment for tumor growth in addition to providing fuel for CRC cell metabolism.
Recent measurements suggest that the small intestine in mice metabolizes a large fraction of fructose but high dose of fructose still reaches the liver (Jang et al., 2018). With consumption of large amounts of fructose, the liver is likely a major site of fructose metabolism (Gonzalez and Betts, 2018; Mayes, 1993). After fructose ingestion, F1P levels increase 10-fold to around 1 mM within 10 minutes and remain elevated for several hours in rat liver, suggesting that fructose does reach the liver (Niewoehner et al., 1984). In human, fructose infusion causes rapid ATP depletion in the liver (Cortez-Pinto et al., 1999). Excessive hepatic fructose has also been implicated in an array of metabolic diseases (Cantley, 2014; Hannou et al., 2018; Softic et al., 2017). However, the possibility remains that part of the fructose effect on CRC liver metastasis might be indirectly due to fructose metabolized in the intestine.
STAR*METHODS
CONTACT FOR REAGENT AND RESOURCE SHARING
Further information and requests for resources and reagents should be directed to and will be fulfilled by the Lead Contact, Xiling Shen (xs37@duke.edu).
EXPERIMENTAL MODEL AND SUBJECT DETAILS
Animal and Diets
All animal experiments were approved by Cornell Center for Animal Resources and Education (CARE), following the protocols 2009-0071 and 2010-0100, and by Duke Animal Care and Use Program, following the protocol A286-15-11. 6–8 week old NOD/SCID mice and BALB/c mice were used throughout the study. Select groups of mice were fed with a fructose-restricted and fructose-high diet purchased from Research Diets (New Brunswick, NJ). Diet ingredients are available in Table S5. Tumor-bearing mice were treated with 5-Fluorouracil (Sigma, St. Louis, MO) at a dose of 100 mg/kg, Oxaliplatin (Sigma, St. Louis, MO) at a dose of 6 mg/kg, 2-deoxyglucose (Sigma, St. Louis, MO) at a dose of 500 mg/kg or normal saline as vehicle control through intraperitoneal route twice a week.
Cell Culture
Human CRC cell line HCT116, patient derived xenograft human CRC cell lines CRC119 and CRC57 and BALB/c mouse colon cancer cell line CT26 were used in the study. The cell lines were grown in RPMI 1640 complete medium with 10% FBS and 1% penicillin-streptomycin solution.
METHOD DETAILS
Cecal Injection and IVIS imaging
2×10⁶ cells carrying a luciferase/mCherry or luciferase/GFP vector were injected into the mice for the cecum injection model and the intrahepatic injection model. 5×10⁵ cells were injected for intravenous injection. Luciferase signal was tracked in vivo using the IVIS luciferase imaging system 200 (Xenogen) for tumor development. Liver metastases were evaluated based on mCherry signals by an OV100 microscope (Olympus) after scarifying the mice.
Lentiviral Vector Constructs and Infection
The dual mCherry and luciferase reporter was constructed using lentiviral pFUW backbone (Addgene). Briefly, the vector was cut by restriction enzymes BamHI and EcoRI. The firefly luciferase-E2A–mCherry was amplified and connected by overlapping PCR and cut by BamHI and EcoRI. E2A is a self-cleaving peptide sequence. Immediately after luciferase-E2A–mCherry is translated into a fusion protein, it splits into separate luciferase and mCherry inside mammalian cells. ALDOB and GATA6 lentiviral shRNA constructs were purchased from Sigma Mission shRNA dataset.
The lentiviral vectors were co-transfected with helper plasmids into 293T cells. The viral supernatant was collected 48 hours after transfection and was used to infect CRC cells.
Western blot
Western blot was performed as described previously (Bu et al., 2015). Samples were prepared using the cancer cells purified by FACS based on mCherry expression. Antibodies used included anti-human ALDOB antibody (PA5–30218, 1:2000, Pierce), anti-Hexokinase (C35C4, 1:1000, Cell Signaling), anti-ketohexokinase (ab197593, 1:2000, Abcam), anti-GATA6 (AF1700, 1:1000, R&D system) and anti-actin (13E5, 1:1000, Cell Signaling; 4967S, Cell Signaling Technology).
Metabolomics
Primary cecum tumors and liver metastases were harvested from the mice. The tissues were rinsed with water and immediately transferred to a tube and placed in liquid nitrogen. Frozen tissue was minced, weighed, and 5 mg was dissolved in 80% methanol. Samples were centrifuged at maximum speed at 4°C. The resulting supernatant was transferred to a fresh tube and dried using SpeedVac concentrator (SPD131DDA, Thermo Scientific). Pellets were dissolved in 50ul water, and diluted with equal volume of acetonitrile:methanol (1:1, v:v) solution. Tubes were centrifuged again for 5 minutes to eliminate insoluble pellets, and 5 ul was injected into mass spectrometry tubes to measure polar metabolites using LC-MS as previously described (Liu et al., 2014).
Isotope tracing analysis with 13C-labeled fructose
Cells were cultured in unlabeled fructose-containing RPMI 1640 medium for 24 hours, then switched into 13C labeled fructose-containing medium (8 mM [U-13C] D-fructose, 0 mM D-glucose and 2 mM L-glutamine) for 9 hours and 24 hours, respectively. To harvest intracellular metabolites, media was aspirated from the cultures, metabolism was quenched with 80% cold methanol, and the resulting lysates were stored in −80°C until processing for GC-MS analysis. For GC-MS analysis, the clarified supernatants were dried under N2 gas-flow at 37°C using an evaporator. Amino and organic acids were derivatized via methoximation and silylation as previously described (Ahn and Antoniewicz, 2011). Briefly, metabolites were resuspended in 25 µL of methoxylamine hydrochloride (2% (w/v) in pyridine) and incubated at 40°C for 90 minutes on a heating block. After brief centrifugation, 35 µL of MTBSTFA + 1% TBDMS was added and the samples were incubated at 60°C for 30 minutes. To measure 13C-enrichment of monomer sugars, lysates were first hydrolyzed in an acid-mediated process to liberate any bound sugars from macromolecules (McConnell and Antoniewicz, 2016) and then subsequently treated via aldonitrile propionate derivatization as previously described (Antoniewicz et al., 2011). Fatty acids were extracted from the biomass pellets through a dual phase extraction (Crown et al., 2015), and the samples were prepared for FAME derivatization (Long and Antoniewicz, 2014), for GC-MS analysis. GC-MS analysis was performed on an Agilent 7890B GC system equipped with a HP-5MS capillary column connected to an Agilent 5977A Mass Spectrometer. Mass isotopomer distributions were obtained by integration of ion chromatograms (Antoniewicz et al., 2007) and corrected for natural isotope abundances (Fernandez et al., 1996).
Bioenergetics Assay
Liver metastases cells were purified by FACS based on mCherry expression and seeded into 24-well Seahorse XF24 cell culture microplate at a density of 40,000 cells per well in 2 steps. First, 100 ul of growth medium was added, cells were incubated for 4 hours to ensure the formation of a monolayer, and then another 150 ul of growth medium was added. The next day, the medium was switched to XF Base medium without supplements and in the absence of glucose and glutamine. Fructose (11 mM) was added to port A for injection. Both the cell plate and the fructose solution were incubated at 37°C without CO2 for 1 hour prior to assay. Baseline OCR and ECAR measurements were recorded before and after fructose injection into the medium.
Insulin, glucose, and fructose measurements
Blood was collected from mice with ad libitum feeding in three dietary groups (regular chow diet, fructose-high diet, and fructose-restrict diet, Table S5). Liver tissues were frozen using a freeze clamp. Glucose and fructose levels in the plasma were measured by a modified GC-MS method (Antoniewicz et al., 2011; Long and Antoniewicz, 2014). Briefly, internal standard of U-13C glucose or U-13C fructose were added for quantification. Protein in the plasma was precipitated with methanol. Samples were air-dried. Hydroxylamine/pyridine solution was added, and samples were then incubated for 60 min at 90°C, followed by adding propionic anhydride to react at 60°C for 30 min. Samples were then evaporated to dryness under airflow and re-dissolved in ethyl acetate for GC-MS analysis on the Agilent 7890B GC system. Glucose and fructose measurements used m/z 370 and m/z 401 respectively.
Liver insulin was extracted from snap frozen liver samples using Tissue Extraction Reagent I (FNN0071, ThermoFisher, USA). Insulin in both plasma and liver tissue was measured by UltraSensitive Mouse Insulin ELISA Kit (90080, Crystal Chem. Inc. USA), described previously (Kim et al., 2016).
Microarray Analysis
39 primary colon carcinoma, 74 liver metastatic samples, and 8 lung metastatic samples were collected from stage IV CRC patients at Duke Oncology Center. Their transcriptomes were profiled using the Affymetrix Human Genome U133 Plus 2.0 array and pre-processed by the Affymetirx MAS5 algorithm in the R Affy package.
Integrated Analysis of RNA-seq and Metabolomics
Cancer cells were purified by FACS based on mCherry expression, and the transcriptomes were profiled using Illumina HiSeq2000 at the Genomics Core of Weill Cornell Medical College. TopHat2 (Kim et al., 2013) and HTSeq (Anders et al., 2015) were used for RNA-seq data analysis with UCSC hg19 as the reference genome. The differential analysis of the RNA-seq data was performed using DESeq2(Love et al., 2014). The significant-differential (p value <0.05) genes were selected and integrated with the significant-differential (p value <0.05) metabolites from differential analysis of metabolomics data. The integrated gene-metabolite profile was analyzed by the Integrated Pathway Analysis module of the MetaboAnalyst (Xia et al., 2015; Xia and Wishart, 2016) (http://www.metaboanalyst.ca).
Meta-Analysis
Four NCBI:GEO datasets including clinical samples of normal colon, primary CRC tumor and liver metastases were selected to investigate the differential transcriptomic signatures (Table S1A). Within these four datasets, a total of 90 matched normal colon, primary CRC tumor, and liver metastatic samples from 30 patients were integrated for analysis. The microarray data were processed by quantile normalization and log2 transformation following the standard GEO2R analysis and then paired differential analysis were performed using the R package the Linear Models for Microarray Data (Limma) (Ritchie et al., 2015).
QUANTIFICATION AND STATISTICAL ANALYSIS
Limma was used for the differential analyses of transcriptomic data and metabolomic data. The global metabolic maps were generated from the KEGG mapper toolbox using Interactive Pathway Explorer (iPATH2) (Yamada et al., 2011). Gene Set Enrichment Analysis (GSEA) of the clinical microarray data was performed using the GSEA software (Subramanian et al., 2005). Heatmaps and hierarchal clustering were performed using Morpheus available from (https://software.broadinstitute.org/morpheus/). Data are presented as mean ± s.d. P values of < 0.05 were considered statistically significant. The statistical details can be found in the figure legends.
Supplementary Material
Table S6. Metabolomics dataset. Related to Figure 1.
Highlights.
Colon cancer liver metastasis upregulates ALDOB, an enzyme for fructose metabolism
Metabolized fructose provides fuel for the central carbon metabolism
Targeting ALDOB or its upstream regulator GATA6 reduces liver metastasis growth
Reducing dietary fructose diminishes liver metastatic growth
Acknowledgments
This work was supported by R21CA201963, NIH R35GM122465, U01 CA214300, NSF 1511357, NSF 1350659, National Natural Science Foundation of China (31771513), Strategic Priority Research Program of the Chinese Academy of Sciences (XDPB03), CAS Pioneer Hundred Talents Program and the Thousand Young Talents Program of China.
Footnotes
Publisher's Disclaimer: This is a PDF file of an unedited manuscript that has been accepted for publication. As a service to our customers we are providing this early version of the manuscript. The manuscript will undergo copyediting, typesetting, and review of the resulting proof before it is published in its final citable form. Please note that during the production process errors may be discovered which could affect the content, and all legal disclaimers that apply to the journal pertain.
Supplemental Information includes six figures, five tables, and one Excel table and can be found with this article online.
AUTHOR CONTRIBUTIONS
P. B., K. C., C.J. and X. S. designed the experiments. K.C. analyzed the data. P. B., and C. J. performed the experiments with the assistance of K.X., Y.A, N.R. and B.B.B for the animal experiments. K.X., S.C. and G.Z. performed fructose metabolic tracing. K.X. and L.W helped with the proliferation assay, migration assay and western blot. R.X., Y.H. and J.L helped with ALDOB knockdown. M.L. and D.S. performed the microarray. P. B., K. C., K.X., C.J., R.M., and X. S. wrote the manuscript.
DECLARATION OF INTERESTS
The authors declare no competing interests.
References
- Abdelmalek MF, Lazo M, Horska A, Bonekamp S, Lipkin EW, Balasubramanyam A, Bantle JP, Johnson RJ, Diehl AM, Clark JM, et al. Higher dietary fructose is associated with impaired hepatic adenosine triphosphate homeostasis in obese individuals with type 2 diabetes. Hepatology. 2012;56:952–960. doi: 10.1002/hep.25741. [DOI] [PMC free article] [PubMed] [Google Scholar]
- Abdelmalek MF, Suzuki A, Guy C, Unalp-Arida A, Colvin R, Johnson RJ, Diehl AM Nonalcoholic Steatohepatitis Clinical Research, N. Increased fructose consumption is associated with fibrosis severity in patients with nonalcoholic fatty liver disease. Hepatology. 2010;51:1961–1971. doi: 10.1002/hep.23535. [DOI] [PMC free article] [PubMed] [Google Scholar]
- Ahn WS, Antoniewicz MR. Metabolic flux analysis of CHO cells at growth and non-growth phases using isotopic tracers and mass spectrometry. Metab Eng. 2011;13:598–609. doi: 10.1016/j.ymben.2011.07.002. [DOI] [PubMed] [Google Scholar]
- Alberts SR, Horvath WL, Sternfeld WC, Goldberg RM, Mahoney MR, Dakhil SR, Levitt R, Rowland K, Nair S, Sargent DJ, et al. Oxaliplatin, Fluorouracil, and Leucovorin for Patients With Unresectable Liver-Only Metastases From Colorectal Cancer: A North Central Cancer Treatment Group Phase II Study. Journal of Clinical Oncology. 2005;23:9243–9249. doi: 10.1200/JCO.2005.07.740. [DOI] [PubMed] [Google Scholar]
- Anders S, Pyl PT, Huber W. HTSeq--a Python framework to work with high-throughput sequencing data. Bioinformatics. 2015;31:166–169. doi: 10.1093/bioinformatics/btu638. [DOI] [PMC free article] [PubMed] [Google Scholar]
- Andre T, Boni C, Mounedji-Boudiaf L, Navarro M, Tabernero J, Hickish T, Topham C, Zaninelli M, Clingan P, Bridgewater J, et al. Oxaliplatin, Fluorouracil, and Leucovorin as Adjuvant Treatment for Colon Cancer. New England Journal of Medicine. 2004;350:2343–2351. doi: 10.1056/NEJMoa032709. [DOI] [PubMed] [Google Scholar]
- Antoniewicz MR, Kelleher JK, Stephanopoulos G. Accurate assessment of amino acid mass isotopomer distributions for metabolic flux analysis. Anal Chem. 2007;79:7554–7559. doi: 10.1021/ac0708893. [DOI] [PubMed] [Google Scholar]
- Antoniewicz MR, Kelleher JK, Stephanopoulos G. Measuring Deuterium Enrichment of Glucose Hydrogen Atoms by Gas Chromatography/Mass Spectrometry. Anal Chem. 2011;83:3211–3216. doi: 10.1021/ac200012p. [DOI] [PMC free article] [PubMed] [Google Scholar]
- Barker N, Ridgway RA, van Es JH, van de Wetering M, Begthel H, van den Born M, Danenberg E, Clarke AR, Sansom OJ, Clevers H. Crypt stem cells as the cells-of-origin of intestinal cancer. Nature. 2009;457:608–611. doi: 10.1038/nature07602. [DOI] [PubMed] [Google Scholar]
- Barrett T, Wilhite SE, Ledoux P, Evangelista C, Kim IF, Tomashevsky M, Marshall KA, Phillippy KH, Sherman PM, Holko M, et al. NCBI GEO: archive for functional genomics data sets--update. Nucleic Acids Res. 2013;41:D991–995. doi: 10.1093/nar/gks1193. [DOI] [PMC free article] [PubMed] [Google Scholar]
- Bu P, Wang L, Chen KY, Rakhilin N, Sun J, Closa A, Tung KL, King S, Kristine Varanko A, Xu Y, et al. miR-1269 promotes metastasis and forms a positive feedback loop with TGF-beta. Nat Commun. 2015;6:6879. doi: 10.1038/ncomms7879. [DOI] [PMC free article] [PubMed] [Google Scholar]
- Cantley LC. Cancer, metabolism, fructose, artificial sweeteners, and going cold turkey on sugar. BMC Biology. 2014;12:8–8. doi: 10.1186/1741-7007-12-8. [DOI] [PMC free article] [PubMed] [Google Scholar]
- Cespedes MV, Espina C, Garcia-Cabezas MA, Trias M, Boluda A, Gomez del Pulgar MT, Sancho FJ, Nistal M, Lacal JC, Mangues R. Orthotopic microinjection of human colon cancer cells in nude mice induces tumor foci in all clinically relevant metastatic sites. The American journal of pathology. 2007;170:1077–1085. doi: 10.2353/ajpath.2007.060773. [DOI] [PMC free article] [PubMed] [Google Scholar]
- Clevers H. Wnt/b-Catenin Signaling in Development and Disease. Cell. 2006;127:469–480. doi: 10.1016/j.cell.2006.10.018. [DOI] [PubMed] [Google Scholar]
- Cortez-Pinto H, Chatham J, Chacko VP, Arnold C, Rashid A, Diehl AM. Alterations in liver ATP homeostasis in human nonalcoholic steatohepatitis - A pilot study. Jama-J Am Med Assoc. 1999;282:1659–1664. doi: 10.1001/jama.282.17.1659. [DOI] [PubMed] [Google Scholar]
- Crown SB, Marze N, Antoniewicz MR. Catabolism of Branched Chain Amino Acids Contributes Significantly to Synthesis of Odd-Chain and Even-Chain Fatty Acids in 3T3-L1 Adipocytes. Plos One. 2015;10:e0145850. doi: 10.1371/journal.pone.0145850. [DOI] [PMC free article] [PubMed] [Google Scholar]
- Del Rio M, Mollevi C, Vezzio-Vie N, Bibeau F, Ychou M, Martineau P. Specific extracellular matrix remodeling signature of colon hepatic metastases. Plos One. 2013;8:e74599. doi: 10.1371/journal.pone.0074599. [DOI] [PMC free article] [PubMed] [Google Scholar]
- Desai JV, Bruno VM, Ganguly S, Stamper RJ, Mitchell KF, Solis N, Hill EM, Xu W, Filler SG, Andes DR, et al. Regulatory role of glycerol in Candida albicans biofilm formation. MBio. 2013;4:e00637–00612. doi: 10.1128/mBio.00637-12. [DOI] [PMC free article] [PubMed] [Google Scholar]
- Dupuy F, Tabaries S, Andrzejewski S, Dong Z, Blagih J, Annis MG, Omeroglu A, Gao D, Leung S, Amir E, et al. PDK1-Dependent Metabolic Reprogramming Dictates Metastatic Potential in Breast Cancer. Cell Metab. 2015;22:577–589. doi: 10.1016/j.cmet.2015.08.007. [DOI] [PubMed] [Google Scholar]
- Feinman RD, Fine EJ. Fructose in perspective. Nutrition & Metabolism. 2013;10:45–45. doi: 10.1186/1743-7075-10-45. [DOI] [PMC free article] [PubMed] [Google Scholar]
- Fernandez CA, Des Rosiers C, Previs SF, David F, Brunengraber H. Correction of 13C mass isotopomer distributions for natural stable isotope abundance. J Mass Spectrom. 1996;31:255–262. doi: 10.1002/(SICI)1096-9888(199603)31:3<255::AID-JMS290>3.0.CO;2-3. [DOI] [PubMed] [Google Scholar]
- Fisher FM, Kim M, Doridot L, Cunniff JC, Parker TS, Levine DM, Hellerstein MK, Hudgins LC, Maratos-Flier E, Herman MA. A critical role for ChREBP-mediated FGF21 secretion in hepatic fructose metabolism. Mol Metab. 2017;6:14–21. doi: 10.1016/j.molmet.2016.11.008. [DOI] [PMC free article] [PubMed] [Google Scholar]
- Fu XY, Besterman JM, Monosov A, Hoffman RM. Models of human metastatic colon cancer in nude mice orthotopically constructed by using histologically intact patient specimens. Proceedings of the National Academy of Sciences of the United States of America. 1991;88:9345–9349. doi: 10.1073/pnas.88.20.9345. [DOI] [PMC free article] [PubMed] [Google Scholar]
- Gonzalez JT, Betts JA. Dietary Fructose Metabolism By Splanchnic Organs: Size Matters. Cell Metab. 2018;27:483–485. doi: 10.1016/j.cmet.2018.02.013. [DOI] [PubMed] [Google Scholar]
- Gupta GP, Massague J. Cancer Metastasis: Building a Framework. Cell. 2006;127:679–695. doi: 10.1016/j.cell.2006.11.001. [DOI] [PubMed] [Google Scholar]
- Hannou SA, Haslam DE, McKeown NM, Herman MA. Fructose metabolism and metabolic disease. J Clin Invest. 2018;128:545–555. doi: 10.1172/JCI96702. [DOI] [PMC free article] [PubMed] [Google Scholar]
- Jang C, Hui S, Lu W, Cowan AJ, Morscher RJ, Lee G, Liu W, Tesz GJ, Birnbaum MJ, Rabinowitz JD. The Small Intestine Converts Dietary Fructose into Glucose and Organic Acids. Cell Metab. 2018;27:351–361. e353. doi: 10.1016/j.cmet.2017.12.016. [DOI] [PMC free article] [PubMed] [Google Scholar]
- Jones S, Chen WD, Parmigiani G, Diehl F, Beerenwinkel N, Antal T, Traulsen A, Nowak MA, Siegel C, Velculescu VE, et al. Comparative lesion sequencing provides insights into tumor evolution. Proceedings of the National Academy of Sciences of the United States of America. 2008;105:4283–4288. doi: 10.1073/pnas.0712345105. [DOI] [PMC free article] [PubMed] [Google Scholar]
- Kavanagh K, Wylie AT, Tucker KL, Hamp TJ, Gharaibeh RZ, Fodor AA, Cullen JM. Dietary fructose induces endotoxemia and hepatic injury in calorically controlled primates. Am J Clin Nutr. 2013;98:349–357. doi: 10.3945/ajcn.112.057331. [DOI] [PMC free article] [PubMed] [Google Scholar]
- Kawasaki T, Igarashi K, Koeda T, Sugimoto K, Nakagawa K, Hayashi S, Yamaji R, Inui H, Fukusato T, Yamanouchi T. Rats fed fructose-enriched diets have characteristics of nonalcoholic hepatic steatosis. J Nutr. 2009;139:2067–2071. doi: 10.3945/jn.109.105858. [DOI] [PubMed] [Google Scholar]
- Kim D, Pertea G, Trapnell C, Pimentel H, Kelley R, Salzberg SL. TopHat2: accurate alignment of transcriptomes in the presence of insertions, deletions and gene fusions. Genome Biol. 2013;14:R36. doi: 10.1186/gb-2013-14-4-r36. [DOI] [PMC free article] [PubMed] [Google Scholar]
- Kim MS, Krawczyk SA, Doridot L, Fowler AJ, Wang JX, Trauger SA, Noh HL, Kang HJ, Meissen JK, Blatnik M, et al. ChREBP regulates fructose-induced glucose production independently of insulin signaling. J Clin Invest. 2016;126:4372–4386. doi: 10.1172/JCI81993. [DOI] [PMC free article] [PubMed] [Google Scholar]
- Lanaspa MA, Ishimoto T, Li N, Cicerchi C, Orlicky DJ, Ruzycki P, Rivard C, Inaba S, Roncal-Jimenez CA, Bales ES, et al. Endogenous fructose production and metabolism in the liver contributes to the development of metabolic syndrome. Nat Commun. 2013;4:2434. doi: 10.1038/ncomms3434. [DOI] [PMC free article] [PubMed] [Google Scholar]
- LeBleu VS, O'Connell JT, Gonzalez Herrera KN, Wikman H, Pantel K, Haigis MC, de Carvalho FM, Damascena A, Domingos Chinen LT, Rocha RM, et al. PGC-1alpha mediates mitochondrial biogenesis and oxidative phosphorylation in cancer cells to promote metastasis. Nature cell biology. 2014;16:992–1003. 1001–1015. doi: 10.1038/ncb3039. [DOI] [PMC free article] [PubMed] [Google Scholar]
- Liu X, Ser Z, Cluntun AA, Mentch SJ, Locasale JW. A Strategy for Sensitive, Large Scale Quantitative Metabolomics. Journal of Visualized Experiments : JoVE. 2014:51358. doi: 10.3791/51358. [DOI] [PMC free article] [PubMed] [Google Scholar]
- Long CP, Antoniewicz MR. Quantifying Biomass Composition by Gas Chromatography/Mass Spectrometry. Anal Chem. 2014;86:9423–9427. doi: 10.1021/ac502734e. [DOI] [PMC free article] [PubMed] [Google Scholar]
- Long CP, Gonzalez JE, Sandoval NR, Antoniewicz MR. Characterization of physiological responses to 22 gene knockouts in Escherichia coli central carbon metabolism. Metab Eng. 2016;37:102–113. doi: 10.1016/j.ymben.2016.05.006. [DOI] [PMC free article] [PubMed] [Google Scholar]
- Loo JM, Scherl A, Nguyen A, Man FY, Weinberg E, Zeng Z, Saltz L, Paty PB, Tavazoie SF. Extracellular metabolic energetics can promote cancer progression. Cell. 2015;160:393–406. doi: 10.1016/j.cell.2014.12.018. [DOI] [PMC free article] [PubMed] [Google Scholar]
- Love MI, Huber W, Anders S. Moderated estimation of fold change and dispersion for RNA-seq data with DESeq2. Genome Biol. 2014;15:550. doi: 10.1186/s13059-014-0550-8. [DOI] [PMC free article] [PubMed] [Google Scholar]
- Mayes PA. Intermediary metabolism of fructose. The American Journal of Clinical Nutrition. 1993;58:754S–765S. doi: 10.1093/ajcn/58.5.754S. [DOI] [PubMed] [Google Scholar]
- McConnell BO, Antoniewicz MR. Measuring the Composition and Stable-Isotope Labeling of Algal Biomass Carbohydrates via Gas Chromatography/Mass Spectrometry. Anal Chem. 2016;88:4624–4628. doi: 10.1021/acs.analchem.6b00779. [DOI] [PubMed] [Google Scholar]
- Meyerhardt JA, Mayer RJ. Systemic Therapy for Colorectal Cancer. New England Journal of Medicine. 2005;352:476–487. doi: 10.1056/NEJMra040958. [DOI] [PubMed] [Google Scholar]
- Moffitt RA, Marayati R, Flate EL, Volmar KE, Loeza SG, Hoadley KA, Rashid NU, Williams LA, Eaton SC, Chung AH, et al. Virtual microdissection identifies distinct tumor- and stroma-specific subtypes of pancreatic ductal adenocarcinoma. Nat Genet. 2015;47:1168–1178. doi: 10.1038/ng.3398. [DOI] [PMC free article] [PubMed] [Google Scholar]
- Nguyen DX, Bos PD, Massague J. Metastasis: from dissemination to organ-specific colonization. Nat Rev Cancer. 2009;9:274–284. doi: 10.1038/nrc2622. [DOI] [PubMed] [Google Scholar]
- Niewoehner CB, Gilboe DP, Nuttall GA, Nuttall FQ. Metabolic effects of oral fructose in the liver of fasted rats. Am J Physiol. 1984;247:E505–512. doi: 10.1152/ajpendo.1984.247.4.E505. [DOI] [PubMed] [Google Scholar]
- Oppelt SA, Sennott EM, Tolan DR. Aldolase-B knockout in mice phenocopies hereditary fructose intolerance in humans. Mol Genet Metab. 2015;114:445–450. doi: 10.1016/j.ymgme.2015.01.001. [DOI] [PubMed] [Google Scholar]
- Penhoet E, Rajkumar T, Rutter WJ. Multiple forms of fructose diphosphate aldolase in mammalian tissues. Proceedings of the National Academy of Sciences of the United States of America. 1966;56:1275–1282. doi: 10.1073/pnas.56.4.1275. [DOI] [PMC free article] [PubMed] [Google Scholar]
- Piskounova E, Agathocleous M, Murphy MM, Hu Z, Huddlestun SE, Zhao Z, Leitch AM, Johnson TM, DeBerardinis RJ, Morrison SJ. Oxidative stress inhibits distant metastasis by human melanoma cells. Nature. 2015;527:186–191. doi: 10.1038/nature15726. [DOI] [PMC free article] [PubMed] [Google Scholar]
- Pizzini S, Bisognin A, Mandruzzato S, Biasiolo M, Facciolli A, Perilli L, Rossi E, Esposito G, Rugge M, Pilati P, et al. Impact of microRNAs on regulatory networks and pathways in human colorectal carcinogenesis and development of metastasis. BMC Genomics. 2013;14:589. doi: 10.1186/1471-2164-14-589. [DOI] [PMC free article] [PubMed] [Google Scholar]
- Ragusa S, Cheng J, Ivanov KI, Zangger N, Ceteci F, Bernier-Latmani J, Milatos S, Joseph JM, Tercier S, Bouzourene H, et al. PROX1 promotes metabolic adaptation and fuels outgrowth of Wnt(high) metastatic colon cancer cells. Cell Rep. 2014;8:1957–1973. doi: 10.1016/j.celrep.2014.08.041. [DOI] [PubMed] [Google Scholar]
- Ritchie ME, Phipson B, Wu D, Hu Y, Law CW, Shi W, Smyth GK. limma powers differential expression analyses for RNA-sequencing and microarray studies. Nucleic Acids Res. 2015;43:e47. doi: 10.1093/nar/gkv007. [DOI] [PMC free article] [PubMed] [Google Scholar]
- Rothbarth J, van de Velde CJ. Treatment of liver metastases of colorectal cancer. Ann Oncol. 2005;16(Suppl 2):ii144–149. doi: 10.1093/annonc/mdi702. [DOI] [PubMed] [Google Scholar]
- Sheffer M, Bacolod MD, Zuk O, Giardina SF, Pincas H, Barany F, Paty PB, Gerald WL, Notterman DA, Domany E. Association of survival and disease progression with chromosomal instability: a genomic exploration of colorectal cancer. Proceedings of the National Academy of Sciences of the United States of America. 2009;106:7131–7136. doi: 10.1073/pnas.0902232106. [DOI] [PMC free article] [PubMed] [Google Scholar]
- Shen F, Li J, Cai W, Zhu G, Gu W, Jia L, Xu B. GATA6 predicts prognosis and hepatic metastasis of colorectal cancer. Oncol Rep. 2013;30:1355–1361. doi: 10.3892/or.2013.2544. [DOI] [PubMed] [Google Scholar]
- Singovski G, Bernal C, Kuciak M, Siegl-Cachedenier I, Conod A, Ruiz IAA. In vivo epigenetic reprogramming of primary human colon cancer cells enhances metastases. J Mol Cell Biol. 2015 doi: 10.1093/jmcb/mjv034. [DOI] [PMC free article] [PubMed] [Google Scholar]
- Softic S, Gupta MK, Wang GX, Fujisaka S, O'Neill BT, Rao TN, Willoughby J, Harbison C, Fitzgerald K, Ilkayeva O, et al. Divergent effects of glucose and fructose on hepatic lipogenesis and insulin signaling. J Clin Invest. 2017;127:4059–4074. doi: 10.1172/JCI94585. [DOI] [PMC free article] [PubMed] [Google Scholar]
- Stange DE, Engel F, Longerich T, Koo BK, Koch M, Delhomme N, Aigner M, Toedt G, Schirmacher P, Lichter P, et al. Expression of an ASCL2 related stem cell signature and IGF2 in colorectal cancer liver metastases with 11p15.5 gain. Gut. 2010;59:1236–1244. doi: 10.1136/gut.2009.195701. [DOI] [PubMed] [Google Scholar]
- Stanhope KL, Schwarz JM, Keim NL, Griffen SC, Bremer AA, Graham JL, Hatcher B, Cox CL, Dyachenko A, Zhang W, et al. Consuming fructose-sweetened, not glucose-sweetened, beverages increases visceral adiposity and lipids and decreases insulin sensitivity in overweight/obese humans. The Journal of Clinical Investigation. 2009;119:1322–1334. doi: 10.1172/JCI37385. [DOI] [PMC free article] [PubMed] [Google Scholar]
- Subramanian A, Tamayo P, Mootha VK, Mukherjee S, Ebert BL, Gillette MA, Paulovich A, Pomeroy SL, Golub TR, Lander ES, et al. Gene set enrichment analysis: a knowledge-based approach for interpreting genome-wide expression profiles. Proceedings of the National Academy of Sciences of the United States of America. 2005;102:15545–15550. doi: 10.1073/pnas.0506580102. [DOI] [PMC free article] [PubMed] [Google Scholar]
- Tobin NP, Harrell JC, Lovrot J, Egyhazi Brage S, Frostvik Stolt M, Carlsson L, Einbeigi Z, Linderholm B, Loman N, Malmberg M, et al. Molecular subtype and tumor characteristics of breast cancer metastases as assessed by gene expression significantly influence patient post-relapse survival. Ann Oncol. 2015;26:81–88. doi: 10.1093/annonc/mdu498. [DOI] [PMC free article] [PubMed] [Google Scholar]
- Valastyan S, Weinberg RA. Tumor Metastasis: Molecular Insights and Evolving Paradigms. Cell. 2011;147:275–292. doi: 10.1016/j.cell.2011.09.024. [DOI] [PMC free article] [PubMed] [Google Scholar]
- Van den Broeck A, Vankelecom H, Van Eijsden R, Govaere O, Topal B. Molecular markers associated with outcome and metastasis in human pancreatic cancer. J Exp Clin Cancer Res. 2012;31:68. doi: 10.1186/1756-9966-31-68. [DOI] [PMC free article] [PubMed] [Google Scholar]
- Vos MB, Lavine JE. Dietary fructose in nonalcoholic fatty liver disease. Hepatology. 2013;57:2525–2531. doi: 10.1002/hep.26299. [DOI] [PubMed] [Google Scholar]
- Weigelt B, Hu Z, He X, Livasy C, Carey LA, Ewend MG, Glas AM, Perou CM, Van't Veer LJ. Molecular portraits and 70-gene prognosis signature are preserved throughout the metastatic process of breast cancer. Cancer Res. 2005;65:9155–9158. doi: 10.1158/0008-5472.CAN-05-2553. [DOI] [PubMed] [Google Scholar]
- Wu Z, Wei D, Gao W, Xu Y, Hu Z, Ma Z, Gao C, Zhu X, Li Q. TPO-Induced Metabolic Reprogramming Drives Liver Metastasis of Colorectal Cancer CD110+ Tumor-Initiating Cells. Cell Stem Cell. 2015;17:47–59. doi: 10.1016/j.stem.2015.05.016. [DOI] [PubMed] [Google Scholar]
- Xia J, Sinelnikov IV, Han B, Wishart DS. MetaboAnalyst 3.0-making metabolomics more meaningful. Nucleic Acids Res. 2015 doi: 10.1093/nar/gkv380. [DOI] [PMC free article] [PubMed] [Google Scholar]
- Xia J, Wishart DS. Using MetaboAnalyst 3.0 for Comprehensive Metabolomics Data Analysis. Curr Protoc Bioinformatics. 2016;55:14 10 11–14 10 91. doi: 10.1002/cpbi.11. [DOI] [PubMed] [Google Scholar]
- Yamada T, Letunic I, Okuda S, Kanehisa M, Bork P. iPath2.0: interactive pathway explorer. Nucleic Acids Res. 2011;39:W412–415. doi: 10.1093/nar/gkr313. [DOI] [PMC free article] [PubMed] [Google Scholar]
Associated Data
This section collects any data citations, data availability statements, or supplementary materials included in this article.
Supplementary Materials
Table S6. Metabolomics dataset. Related to Figure 1.